




Volume 215 - Issue 11
Ambulance ramping, system pressure, and hospitals in crisis: what do the data tell us?
Authors: Laura M Boyle, Mark Mackay and Keith Stockman
Med J Aust 2021; 215 (11): 526-527. || doi: 10.5694/mja2.51335
Published online: 13 December 2021
Published online: 13 December 2021
To the Editor: Recent media reports imply there is an increased pressure on Adelaide’s metropolitan emergency medical system which has resulted in additional ambulance ramping and consequent industrial action.1,2,3 We collected a novel dataset of emergency department (ED) capacity state observations at 30‐minute intervals from the public South Australia ED Dashboard4 to investigate the claims of increased pressure. The dashboard uses a traffic light system to indicate ED busyness.
The 7‐day moving average of the daily percentage of EDs in “green” status (≤ 80% of capacity) oscillated around 25% between 3 October 2019 and 16 March 2020 and then steeply increased to 80%, coinciding with the first wave of coronavirus disease 2019 (COVID‐19) cases in South Australia, which drove a major reduction in ED presentations (Box).5 The graph then shows a slow return to a baseline fluctuation of around 25% until January 2021. Since then, the moving average of EDs in “green” has been lower than 25%, showing an overall trend of increasing pressure over the subsequent months. This pattern is mirrored in the daily percentage of “red” and “white” status (ED at ≥ 95% of capacity). The 7‐day moving average of the daily percentage of EDs in “red” and “white” status exceeded 75% for the first time in February 2021. Four new record highs have been recorded since 10 May 2021, with the highest daily percentage of “red” and “white” observations at 98% on 27 May 2021. The average daily proportion of “red” and “white” observations pre‐pandemic (from 4 October 2019 to 19 March 2020) was 55% and has since increased to 64% (from 5 December 2020 to 29 June 2021), indicating that EDs are currently under significantly more strain.
These issues are not new; EDs are one component of a complex interdependent health care system. EDs operating for extended periods at or near capacity is often the most conspicuous symptom of a broader system under pressure. It is doubtful that a solution to this problem can be found within the ED. Long term ED congestion relief lies in redesigning multiple aspects of the health and social care systems, which should involve health care consumer groups. Suggestions include: i) reducing hospital access block, ii) increasing social and community care, iii) adequate hospital beds, iv) alternatives to traditional care such as urgent care facilities or virtual wards, and v) cohort‐specific interventions to reduce ED presentations (eg, rehabilitation centres for alcohol and substance misuse).
Box – Seven‐day moving average of the daily proportions of observations of the six metropolitan public hospitals (excluding the Women’s and Children’s Hospital) classified as alert codes “green” (0–80% occupied capacity), “amber” (80–95% occupied capacity), “red” (95–125% occupied capacity), and “white” (> 125% occupied capacity) between 4 November 2019 and 19 June 2021*
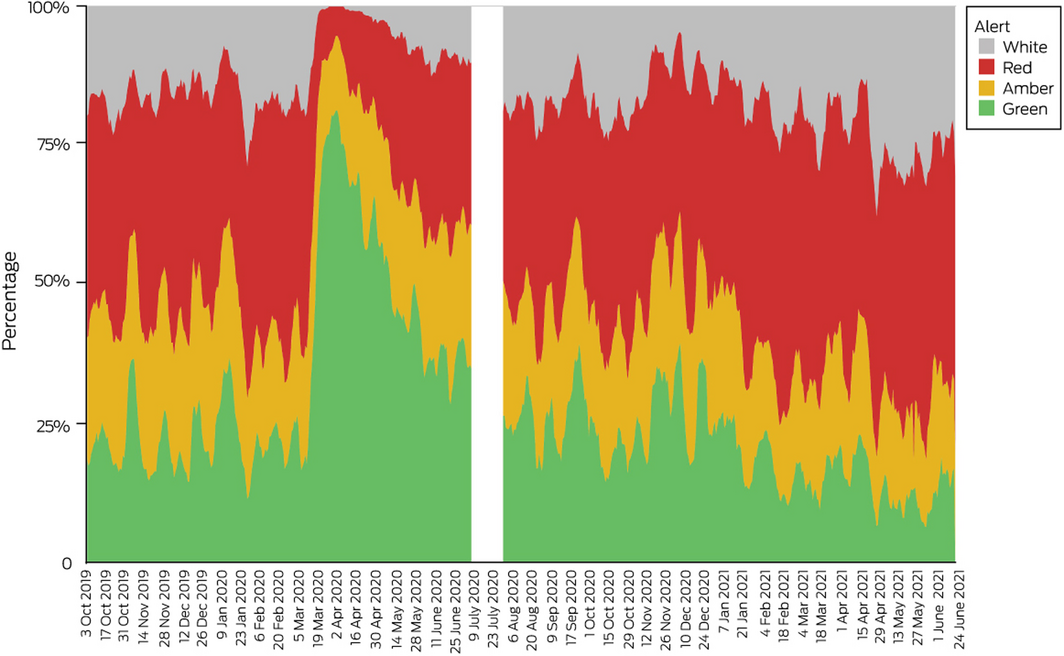
* Due to problems in the data collection system, the data for the period between 14 and 31 July 2020 are missing.
Competing interests
No relevant disclosures.
Acknowledgements
Laura Boyle acknowledges the support of the Australian Research Council Centre of Excellence for Mathematical and Statistical Frontiers (ACEMS). She was an ACEMS‐funded researcher at the University of Adelaide.
References
- SA Government and ambulance union reach agreement after dispute over staff numbers and rostering. ABC News 2021; 5 May. https://www.abc.net.au/news/2021‐05‐05/ambulance‐dispute‐with‐sa‐government‐resolved/100117996 (viewed Aug 2021).
- Australian Nursing and Midwifery Federation (SA Branch). “Donut” budget full of holes and will not address the needs of a health system in crisis [media release]. 22 June 2021. https://www.anmfsa.org.au/Web/Media_Releases/Media.aspx (viewed Aug 2021).
- Statistics reveal thousands of hours lost to ramping outside SA hospitals. ABC News 2021; 8 May. https://www.abc.net.au/news/2021‐05‐07/sa‐ramping‐statistics/100125640 (viewed Aug 2021).
- Government of South Australia, SA Health. Emergency department dashboard. https://www.sahealth.sa.gov.au/wps/wcm/connect/public+content/sa+health+internet/about+us/our+performance/our+hospital+dashboards/about+the+ed+dashboard/emergency+department+dashboard (viewed Aug 2021).
- Boyle LM, Mackay M, Bean N, Roughan M. Impact of the COVID‐19 pandemic on South Australia’s emergency departments: evidence from two lockdowns. Aust Health Rev 2021; https://doi.org/10.1071/AH20366 [Epub ahead of print].
‘Once Bitten’: A Case of Tetanus Following Snakebite in Australia
Adrian A. S. Doherty, Naomi N. E. Clarke, Sarah Fletcher, Sarah Huffam, Camille V. Awburn, Eugene Athan
Epidemiology and Quality of Care for Aboriginal and Torres Strait Islander Peoples Treated by Emergency Medical Services for Stroke in Victoria, Australia: Retrospective Analysis of Linked Data
Candice Menezes, Ziad Nehme, Luke J. Burchill, Tegwyn McManamny, Angela Dos Santos, Michelle Crilly, Luke P. Dawson, Benjamin Clissold, David Anderson, Emily Nehme
Intranasal Adrenaline Use for the Management of Insect Venom-Induced Anaphylaxis
Thomas J. Young, Wilhelmina R. F. Johnson, Braydon L. Pennington, Troy Wanandy, Wun Y. Lau, Thanh-Thao A. Le
Gabapentinoid Poisoning Presentations to Victorian Emergency Departments: A 15-Year Trend Analysis
Bishaal Tej Gurung, Amy McNeilage, Angus Skeen, Tina Lam, Joanna F. Dipnall, Jane Hayman, Suzanne Nielsen, Ting Xia
They Brought the Hospital to Me
Hugh N. Burrill
Predictors of Ambulance Transport to Hospital for Older People Living in Tasmanian Aged Care Facilities: A Retrospective Cohort Study
Sharon Andrews, Pieter F. Fouche, Belinda Flanagan, Michael McDermott, Melanie Greenwood