




Volume 218 - Issue 11
Influenza and pertussis vaccine coverage in pregnancy in Australia, 2016–2021
Authors: Jocelynne E McRae, Lisa McHugh, Catherine King, Frank H Beard, Christopher C Blyth, Margie H Danchin, Michelle L Giles, Hassen Mohammed, Nicholas Wood and Kristine Macartney
Med J Aust 2023; 218 (11): 528-541. || doi: 10.5694/mja2.51989
Published online: 19 June 2023
Published online: 19 June 2023
Maternal influenza and pertussis vaccine coverage rates appear to be increasing, at least in parts of Australia, but significant gaps remain
Summary
- Vaccination in pregnancy is the best strategy to reduce complications from influenza or pertussis infection in infants who are too young to be protected directly from vaccination. Pregnant women are also at risk of influenza complications preventable through antenatal vaccination. Both vaccines are funded under the National Immunisation Program for pregnant women in Australia, but coverage is not routinely reported nationally.
- We reviewed all reported Australian maternal influenza and pertussis vaccine coverage data for the period 2016–2021, to identify gaps and information needs.
- Maternal influenza vaccine coverage was suboptimal at <58% for 2016–2018, with higher coverage of 62–75% reported in two states (Victoria and Western Australia) for 2019–2021. Maternal pertussis vaccine coverage from 2016 was generally higher than for influenza at >70%, with the highest jurisdictional coverage of 89% reported in Western Australia in 2020.
- Vaccination rates were often suboptimal among First Nations pregnant women and up to 20% lower than among non‐First Nations Australian women; while data were limited, coverage was low among culturally and linguistically diverse women and among women of lower socio‐economic status.
- Jurisdictional perinatal data collections were the best source of information on antenatal vaccine coverage but were only available for a minority of the population; a nationally consistent systematic approach is lacking.
- Timely and comprehensive data are needed to provide feedback to improve maternal vaccination coverage, particularly among groups with higher risk and/or low uptake, and as new vaccines are recommended, including COVID‐19 vaccination.
Achieving high vaccine coverage in populations with higher risks of complications from vaccine‐preventable diseases is key to ensure maximum individual and population‐level benefit. Before the coronavirus disease 2019 (COVID‐19) pandemic, influenza was the most commonly reported vaccine‐preventable disease across all age groups in Australia,1,2 with infants aged <6 months and pregnant women at higher risk of complications, including death, compared with older children and adults of similar age, respectively.3,4,5,6 Influenza vaccination given during pregnancy reduces these risks during pregnancy and in the early post partum period, and among infants aged <6 months.4,7,8,9,10,11 Pertussis infection in young infants, while less prevalent compared with influenza,1 poses a severe threat to those aged <4 months who have not yet derived protection from their primary vaccination course.12 Infants aged <6 months are too young to be vaccinated against influenza and can only be partially immunised against pertussis infections; protection is best mediated via passive maternal transplacental antibody transfer.7,13,14,15,16
Seasonal influenza vaccination in pregnancy (maternal vaccination) has been recommended in Australia since 2000 and the vaccine has been funded for all pregnant women on the National Immunisation Program (NIP) since 2010.17 Pertussis‐containing vaccines, which also include diphtheria and tetanus antigens, have been recommended in pregnancy since 2013 for women in their third trimester.18 All Australian states and territories had funded a program for pregnant women by June 2015, which was replaced by NIP funding from July 2018.19 In 2019, the recommended timing of pertussis vaccination in pregnancy was revised to occur any time from 20 weeks’ gestation (down from 28 weeks), to allow for earlier maternal antibody transfer and improve opportunities for protection in infants born preterm.20
Estimates of maternal influenza and pertussis vaccine coverage in Australia have historically been derived from ad hoc descriptive observational studies and in select populations. Contemporary, timely and consistent national data on maternal vaccine coverage are critical to identify areas of low coverage and evaluate the effectiveness of strategies to increase vaccine uptake if low. We sought to better understand all data sources estimating maternal influenza and pertussis vaccine coverage from 2016 (by which time both vaccines were funded for use across Australia) to 2021, to describe data gaps and examine trends in coverage over time, including among First Nations women. Additionally, we describe vaccine coverage, not presently well understood among women of culturally and linguistically diverse (CALD) background (women born overseas or those who speak languages other than English), and women experiencing socio‐economic disadvantage.
Method
For this narrative review, the following databases were used to identify relevant literature: Ovid MEDLINE, Embase, the Cochrane Library, the Cochrane Central Register of Controlled Trials, and Informit. A full outline of the search strategy is included in the Supporting Information. Grey literature was also identified from government websites of all states and territories of Australia (Supporting Information, appendix 1). Data were reviewed between 4 March and 30 June 2022.
Studies were restricted to quantitative data analysis of influenza and/or pertussis vaccination in pregnancy from January 2016 to December 2021. We included studies that crossed multiple calendar years or influenza seasons where data from 2016 onwards were included. Studies were excluded if vaccination in pregnancy could not be distinguished from pre‐conception vaccination or postnatal vaccination, or were based only on intention to vaccinate. Interventional studies are described in this review; however, post‐intervention data were excluded from summary vaccine coverage estimates assuming that individual vaccine uptake was influenced by the intervention itself. Post‐intervention vaccine coverage is described separately (Supporting Information, table 1). Coverage among control groups in these studies was excluded if they did not meet review inclusion criteria.
Study data were tabulated with vaccine coverage shown by year and how vaccine status was determined; for example, by a vaccination provider, an immunisation register or via self‐report. Trends in vaccine coverage were reported according to source data. Vaccine coverage, reported as percentages, was calculated from the original studies as the number of women vaccinated during pregnancy divided by the number of women for whom vaccination status was known. We reviewed demographic data regarding First Nations status, CALD background, and socio‐economic status (SES) via the Socio‐Economic Index for Areas (SEIFA). Where possible, content experts and authors were contacted for more information; for example, denominators that were not available from the publication. Manual calculations were created from published data in some instances to provide a breakdown in coverage by year, coverage excluding missing data, and to report coverage that was only shown graphically.
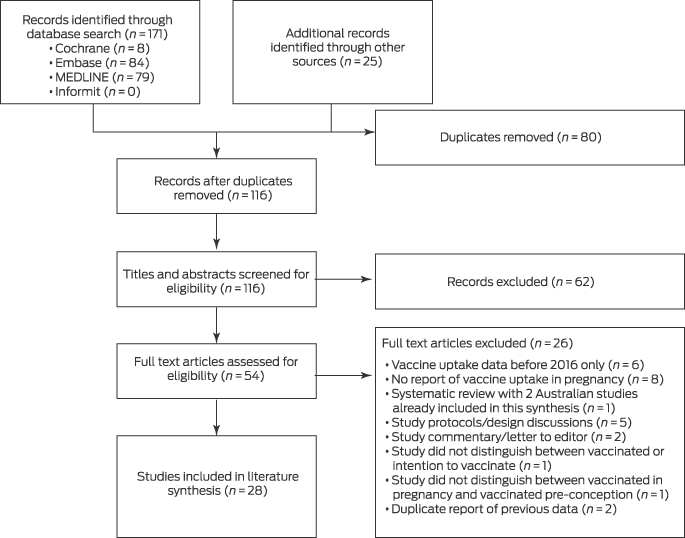
There were 171 records extracted from core databases and an additional 25 studies identified from government websites and publication reference lists. After removal of duplicates and studies that did not meet eligibility criteria, 28 reports provided information on either maternal influenza or pertussis vaccine coverage for the period 2016–2021 (Box 1). A small subset of these studies (n = 12) provided maternal vaccination data among either First Nations women, women of CALD background, and/or by SES. Sample sizes ranged from 55 to 269493 participants, with a total number of more than 880000 women providing data across the 28 independent studies.
Influenza vaccine coverage in pregnancy
There were 24 studies that reported on maternal influenza vaccine coverage in differing jurisdictional populations, 11 of which were from Victoria (Box 2). Vaccination status was collected by self‐report in 11 studies; one was presumed self‐report24 (based on prior report methods23); four were validated from a vaccine provider, hand‐held antenatal medical record, immunisation register or other medical documents, and eight were based on data entered into a perinatal database which permitted inclusion of sighted evidence (a record) of vaccination in pregnancy as well as self‐reported uptake to the notifying midwife/medical practitioner (Box 2).45,46
Of the 24 studies, 21 provided information on maternal influenza vaccine coverage (or proportion vaccinated), which ranged from 32% to 75% for the period 2016–2021 (Box 3). Coverage was below 40% in three studies including one multijurisdictional Australian study in 2016–2017,44 and two studies from Queensland in 2017, one of which was a population surveillance report and the other a large cross‐sectional survey (n = 968; Box 2 and Box 3).23,25 The highest coverage for maternal influenza vaccine was 75% in 2019 from a Victorian population surveillance report (n = 77779; Box 2 and Box 3).37 Published data for maternal influenza vaccine coverage in 2020 and 2021 were less common than in earlier years, with data only available from one source each year (WA Midwives Notification System).41
Three studies were interventional and none contributed pre‐intervention data as they were either duplicate data from other studies or pre‐dated 2016 (Box 2; Supporting Information, table 1A). Post‐intervention coverage reached 82% (n = 55)31 and 83% (n = 155)39 in two studies, while the third study reported a 50–196% increase in influenza vaccination coverage during pregnancy from baseline and an increase in monthly coverage reaching 90–100% (n = 11121).30
Pertussis vaccine coverage in pregnancy
There were 21 studies reporting maternal pertussis vaccine coverage, ten of which derived from Victoria (Box 4). Vaccination status was collected by self‐report in nine studies; one was presumed self‐report,24 based on prior report methods;23 four had records validated from a vaccine provider, the hand‐held antenatal medical record, immunisation register or other medical document, and seven were based on a perinatal database (with either sighted evidence of vaccination in pregnancy and/or self‐report) (Box 4).45,46
Of the 21 studies, 17 provided information on maternal pertussis vaccine coverage (or proportion vaccinated) that was predominantly greater than 70% for the period 2016–2021 (Box 4 and Box 5). The lowest reported coverage of maternal pertussis vaccine of 49% was from a study in the Northern Territory in 2016 (Box 5).48 The highest coverage observed was from Western Australian population surveillance data: 88%, 89% and 88% annually for 2019, 2020 and 2021, respectively,51 and 89% in 2019 from a multijurisdictional survey (n = 81)43 (Box 4 and Box 5).
Four studies were interventional; none contributed pre‐intervention data to summary estimates as they were either duplicate data reported in other studies, pre‐dated 2016 or provided variable coverage estimates from multiple sites. (Box 4; Supporting Information, table 1B). After intervention, all four studies found >90% coverage of pertussis vaccine in pregnancy and up to 100% for monthly coverage from some study sites in Victoria.30
Maternal vaccine coverage among First Nations women
Among the 24 studies on maternal influenza vaccine coverage, five reported data among First Nations women from Queensland, Victoria and South Australia (Box 2 and Box 6). Coverage ranged from 22% to 45% (Box 6), including annual increases in coverage reported from Queensland surveillance data of 22%, 25% and 33% for 2016, 2017 and 2018, respectively.24 Coverage was 2–18% lower than in non‐Indigenous Australian women for influenza vaccine (Box 6).
Of the 21 studies on maternal pertussis vaccine coverage, six reported coverage in First Nations pregnant women from Queensland, Victoria, SA and the NT (Box 4 and Box 6). Coverage ranged between 43% and 68%, with annual increases also evident in Queensland where rates were 43%, 48% and 55% for 2016, 2017 and 2018, respectively24 (Box 4 and Box 6). Maternal pertussis vaccine coverage among First Nations women was 5–20% lower than among non‐First Nations Australian women (Box 6).
Maternal vaccine coverage among women of CALD background
Six studies reported data on maternal vaccination among women of CALD background compared with other Australian women. Regarding influenza vaccination, lower coverage was reported in one study (48% v 59%, n = 71),26 three studies reported similar coverage (49% v 50%, n = 170683;36 43% v 45%, n = 70635;35 48% v 49%, n = 123340), one study reported higher influenza vaccine coverage (54% v 41%, n = 1305),34 while another study found overseas regional variability in coverage compared with that of Australian‐born women for influenza vaccine (46–61% v 55%, n = 249798).29 In five studies, maternal pertussis vaccine coverage in women of CALD background ranged between 63% and 80%, which was predominantly lower compared with other Australian women, where coverage was 76–86% (N = 488731).29,34,35,36,40 Additionally, a study that included 69% of women of CALD background reported coverage of 57% (n = 489) and 61% (n = 204) for influenza and pertussis vaccines, respectively33 (Supporting Information, table 2).
Maternal vaccine coverage among socio‐economically disadvantaged women
Two studies provided data on vaccination of women of differing SES, reporting by SEIFA Index of Relative Socio‐economic Disadvantage (IRSD) quintiles (Supporting Information, table 3). Both studies, from Victoria, found that women who were living in the most socio‐economically disadvantaged quintiles of residence had the lowest maternal vaccine coverage compared with those from the least disadvantaged quintiles. The first study (2015–2017) reported an incremental increase in coverage from 39% to 53% (n = 72474) and from 68% to 77% (n = 70275) for influenza and pertussis vaccines, respectively.35 The second study (2021) reported narrower intervals between lowest and highest IRSD quintiles, ranging from 52% to 58% for influenza and from 75% to 77% (with mid quintiles of 78%) for pertussis.29
Discussion
We reviewed several maternal vaccination studies from multiple Australian jurisdictions and populations, providing a comprehensive synopsis of coverage data for two NIP‐funded maternal vaccines from 2016 to 2021. Maternal pertussis vaccine coverage was consistently higher than maternal influenza coverage for the same time period, although with an increasing trend towards 80–89% in 2019–2021 from WA's state‐based immunisation database.41 Influenza vaccine coverage was generally below 60%; however, perinatal data from Victoria and WA from 2019–2021 suggest increasing coverage rates compared with earlier years (62–75%).37,38,41 Higher coverage with pertussis vaccination compared with influenza may have occurred for a number of reasons; antenatal services may not promote or deliver influenza vaccine year round; no vaccine is available from the end of February (prior year vaccine expiry) to early April (current year vaccine availability) annually; risk from influenza may be perceived to be low; benefits to the infant may not be widely known (despite evidence strongly indicating protection);15,52,53 and provider attitudes may also affect vaccine promotion and delivery. Promotion of pertussis vaccination as providing benefit against serious illness and death in newborns likely influences women to be vaccinated each pregnancy.33,54 Studies have shown that targeted maternal vaccination strategies, training and specific interventions have increased vaccine uptake, but it is unclear how universal or sustained such changes have been.30,31,39,50
Only a few Australian states and territories provided regular data, and there was considerable variation between jurisdictions. Despite NIP funding, there were no nationally representative data, and no reporting by the Commonwealth Government. It was also unclear whether differences in vaccine coverage were real or due to study heterogeneity. For example, Queensland population health data from 2018 indicated maternal influenza vaccine coverage was 25% lower than in Victoria for the same year,24,38 where mandatory reporting to the Victorian Perinatal Data Collection has been in place since 2015 across public and private health services and may therefore be a better reflection of true coverage. Large population data from bigger jurisdictions of New South Wales and South Australia were not available, and we found no published data from Tasmania or the Australian Capital Territory. Nationally, there are about 300000 pregnancies each year (291712 in 2020);55 data on vaccine coverage in the majority is not reported at the public health level where, by comparison, national coverage data for influenza and pertussis is routinely available in other countries such as the United Kingdom, United States and Spain enabling comprehensive assessment of national vaccine programs and the fundamental components that drive uptake.56,57,58
Maternal vaccine coverage among First Nations women was up to 20% lower than coverage among non‐Indigenous Australian women. Similar coverage gaps were reported in a recent large multijurisdictional Australian study incorporating perinatal data from NT, WA and Queensland (not included in this review) on maternal vaccine coverage during 2012–2017 (n = 591868).59 This disparity in vaccine coverage needs urgent attention and may be addressed through health care provider recommendations, communication on the benefits and effectiveness of vaccination, and implementation of First Nations led program changes.60,61,62 These are underpinned by the need for timely, comprehensive data to inform strategies to improve coverage and ultimately afford greater protection of First Nations Australian women and their infants.
Maternal vaccine coverage among women of CALD background varied compared with women of other Australian backgrounds. One study found that women born overseas were less likely to have heard of vaccination for pertussis and/or influenza in pregnancy and would benefit from health care provider recommendations,33 but further understanding of culture‐specific gaps is needed to inform targeted vaccine promotion. Few studies reported maternal vaccine coverage among women by socio‐economic status that could provide any definitive understanding of coverage. Data on CALD and socio‐economic status should be routinely reported with vaccine coverage and used to inform vaccine promotion and delivery strategies. COVID‐19 vaccine uptake has been shown to be lower among certain CALD groups, but also responsive to tailored locally driven strategies to increase uptake.
We found that reporting from perinatal data collections, which obtain clinical and demographic information on all registered births at ≥20 weeks’ gestation,59 provided the largest and most representative sources of data on annual vaccine coverage for Victoria, Queensland and WA.23,24,37,38,41,51 Importantly, perinatal data collections provide the opportunity for data linkage with the Australian Immunisation Register (AIR) at either a national or jurisdictional level, which is essential for accurate assessment of coverage. The AIR has been capturing information on adult vaccinations since 2016,63 albeit non‐mandatory until recently, and informs national estimates on population coverage for vaccine‐preventable diseases in Australia. However, the AIR does not capture pregnancy status or at‐risk medical conditions.64 All states and territories should harmonise methodologies to include vaccination status and derive timely national population weighted estimates from jurisdictional data or perinatal data collection links to the AIR nationally; moreover, a range of options should be explored, including those using assets such as the AIR Multi‐Agency Data Integration Project65 incorporating linked Australian Government datasets, which provide demographic information such as SES and cultural diversity alongside vaccination status from the AIR. In the absence of a national perinatal database that includes vaccination status, we need real‐time data on antenatal vaccine coverage from each jurisdiction in Australia, to provide ongoing and systematic estimates similar to the way other vaccines are managed in the AIR.64
Limitations
This narrative review provides insight into national maternal vaccine coverage not well understood and has identified important gaps in data reporting that are vital for informing vaccine programs. However, given the nature of the study, we acknowledge the following limitations. No formal quality and risk of bias assessment was undertaken; data were extracted by a single person, although tabulated results were reviewed by a second and co‐authors provided input on familiar studies; the majority of studies reported vaccination status by self‐report, which may have led to over‐ or underestimation of vaccination coverage; and publication bias may be present with respect to inclusion of interventional studies. Comparison of coverage estimates in this review was challenging due to variations in denominators used for coverage assessment; the definition for “vaccinated” — whether determined from a validated source or by self‐report; and the definitions for women of CALD background and by SES, acknowledging that coverage of women who reside in the lowest SES area quintiles may include women who are not financially disadvantaged. In addition, there is a disproportionately higher number of studies (48%) in this review from Victoria, many of which use the same perinatal data collection data for different studies, and the demographic may not necessarily be representative of the rest of Australia. There is also a lack of consistently reported data (for example, by year) that is regionally representative from all jurisdictions of Australia, and some jurisdictional reports do not routinely report all data collected on various population groups.
Conclusion
Maternal influenza and pertussis vaccine coverage rates appear to be increasing, at least in parts of Australia, but significant gaps remain. Coverage among First Nations women for both influenza and pertussis vaccines in pregnancy remains consistently lower than for non‐Indigenous Australian women; addressing this is a priority, as is improving understanding of coverage across different SES and CALD groups. A lack of nationally representative information on maternal vaccination coverage limits the ability to use data‐driven evidence to evaluate the effectiveness of vaccine programs. A systematic approach to assess maternal vaccine coverage using data linkage, either across all jurisdictions or nationally via the AIR and national perinatal data collection linkage, is essential to provide accurate estimates.
Box 2 – Studies on influenza vaccine coverage in pregnancy
|
|
|
|
|
|
|
Vaccine coverage |
|||||||||
|
State/territory |
Publication |
Study period |
Study design** |
Cohort description (participants, setting) |
Validation of vaccination status |
Total population |
First Nations Australians |
Non‐First Nations Australians |
|||||||
|
|
|||||||||||||||
|
NT |
Janagaraj et al 201921 |
2016 |
Perinatal database study |
All births that occurred in NT public hospitals identified through the NT Perinatal Register during 2016 |
Validated (NT Immunisation Register) |
Including pre‐conception: 1547/3392 (46%) |
— |
— |
|||||||
|
Qld |
Laurie et al 202122 |
May 2016–May 2018 |
Secondary analysis of randomised controlled trial (cross‐sectional cohort) |
All pregnant women (First Nations or non‐First Nations Australian) in second or third trimester, attending First Nations‐specific primary care clinics and public hospitals in south‐east Queensland |
Validated (Australian Immunisation Register) |
142/310 (46%) |
26/58 (45%) |
116/252 (47%) |
|||||||
|
|
Department of Health 201823 |
2016–2017 |
Perinatal database study |
Women who gave birth to one or more infants in Queensland during the study period |
Self‐report only |
34% (2017) |
— |
— |
|||||||
|
|
Department of Health 202024 |
2016–2018 |
Perinatal database study |
Women who gave birth to one or more infants in Queensland during the study period |
Not stated, presumed self‐report as for previous years |
25050†/59644 (42%; 2018) |
~22% (2016); ~25% (2017); ~33% (2018)†¶ |
~27% (2016); ~35% (2017); ~43% (2018)†¶ |
|||||||
|
|
Van Buynder et al 201925 |
Apr–Oct 2017 |
Survey |
Postnatal women ≥18 years attending public vaccination clinics on the Gold Coast |
Self‐report only |
355/968 (37%) |
— |
— |
|||||||
|
NSW |
Carlson et al 201926 |
Sep–Oct 2016 |
Survey |
Pregnant women attending a public hospital antenatal clinic in Sydney |
Self‐report only |
38/71 (54%) |
— |
— |
|||||||
|
|
McRae et al 202127 |
Jul–Oct 2017 |
Survey |
Pregnant women aged ≥18 years attending antenatal care at two public hospitals in Sydney |
Self‐report only |
369/642 (58%) |
— |
— |
|||||||
|
Vic |
Giles et al 202028 |
2016–2017 |
Perinatal database study |
Singleton births ≥28 weeks' gestation in Victoria |
Self‐report and validated (VPDC‡) |
Including unknown: 72764/154479 (47%) |
— |
— |
|||||||
|
|
Giles et al 202129 |
July 2015–Dec 2018 |
Perinatal database study |
Singleton births ≥28 weeks' gestation in Victoria |
Self‐report and validated (VPDC‡) |
138698/269493 (52%) |
— |
— |
|||||||
|
|
Giles et al 202130 |
2019 |
Interventional |
Pregnant women who attended one of six maternity services in Victoria |
Self‐report and validated (VPDC‡) |
N =11121 |
— |
— |
|||||||
|
|
Kaufman et al 202031 |
Oct 2018–2019 |
Interventional |
Pregnant women attending a public hospital antenatal clinic in Melbourne |
Self‐report only |
45/55 (82%) (control group coverage included in Victorian Perinatal Services Performance Indicators report)38 |
— |
— |
|||||||
|
|
Krishnaswamy et al 201732 |
Aug–Dec 2016 |
Survey |
Women who were admitted and delivered a healthy baby at one public hospital network and two private hospitals in Melbourne |
Self‐report only |
365/689 (55%) |
— |
— |
|||||||
|
|
Krishnaswamy et al 201833 |
Sept–Dec 2016 |
Survey |
Women attending antenatal care at public health care network: Monash Health, Melbourne |
Self‐report only |
279/489 (57%) |
— |
— |
|||||||
|
|
Moir et al 202034 |
Jan 2017–Jan 2018 |
Survey |
Women who delivered their infant at a large hospital in western Melbourne |
Self‐report only |
630/1305 (48%) |
— |
— |
|||||||
|
|
Rowe et al 201935 |
Jul 2015–Jun 2017 |
Perinatal database study |
Pregnancies ending in the study period captured by the VPDC |
Self‐report and validated (VPDC‡) |
59938/153980 (39%; 2015–2017) |
369/1049 (35%; 2016, excluding missing data)† |
31491/71723 (44%, excluding missing data)† |
|||||||
|
|
Rowe et al 202136 |
Sep 2015 ‐ Dec 2017 |
Perinatal database study |
Pregnancies ending in the study period captured by the VPDC. These were linked to five other databases capturing events of public health importance |
Self‐report and validated (VPDC‡) |
85830/186962 (46%) |
1003/2486 (40%, excluding missing data)† |
84200/168247 (50%, excluding missing data)† |
|||||||
|
|
Department of Health 202137 |
2018‐2019 |
Perinatal database study |
Women who delivered an infant among both public and private hospitals statewide captured by the VPDC |
Self‐report and validated (VPDC‡) |
51828/77355 (67%; 2018) |
— |
— |
|||||||
|
|
Department of Health 201938 |
2017–2018 |
Perinatal database study |
Women who delivered an infant among both public and private hospitals statewide captured by the VPDC |
Self‐report and validated (VPDC‡) |
42244/78229 (54%; 2017) |
— |
— |
|||||||
|
SA |
Mohammed et al 201839 |
Nov 2014–July 2016 |
Interventional |
Pregnant women aged ≥18 years attending antenatal care at a maternity hospital in Adelaide |
Self‐report |
Post intervention: 128/155 (83%) |
— |
— |
|||||||
|
|
Mohammed et al 202040 |
2015–2018 |
Prospective cohort study |
Healthy nulliparous women who delivered at two public hospitals in Adelaide |
Validated (medical case notes and pregnancy hand‐held records) |
605/1263 (48%) (2015–16 influenza season: 40%; 2017–18 influenza season: 52%) |
7/23 (30%)† |
598/1240 (48%) |
|||||||
|
WA |
Department of Health 202241 |
2016–2021 |
Perinatal database study |
Births registered in the Midwives Notification System |
Self‐report and validated (Midwives Notification System§) |
N =144475 |
— |
— |
|||||||
|
Vic, SA, WA |
Danchin et al 201842 |
Oct 2015–2016 |
Survey |
Pregnant women attending public hospital antenatal clinics from four locations: Melbourne, Vic (2); Adelaide, SA (1); Perth, WA (1) |
Self‐report only |
132/290 (46%) |
— |
|
|||||||
|
NSW, NT, Qld, SA, WA |
Carlson et al 202243 |
2019 |
Survey |
Mothers of infants <6 months of age and hospitalised for acute respiratory infection in five hospitals across Australia as captured by the PAEDS network |
Self‐report only |
44/81 (54%) |
— |
|
|||||||
|
NT, Qld, NSW, Vic, SA, WA |
McRae et al 202244 |
Apr–Nov 2016–2019 |
Test negative design, case control study |
Mothers of infants aged <6 months test negative for influenza and hospitalised for acute respiratory infection in seven hospitals across Australia as captured by the PAEDS network |
Validated (vaccination provider, health record or AIR) |
164/435 (38%; 2016–2019) |
— |
— |
|||||||
|
|
|||||||||||||||
|
AIR = Australian Immunisation Register; NSW = New South Wales; NT = Northern Territory; PAEDS = Paediatric Active Enhanced Disease Surveillance; Qld = Queensland; SA = South Australia; Vic = Victoria; VPDC = Victorian Perinatal Data Collection; WA = Western Australia. ** The majority of studies are observational studies and defined further as: surveys — quantitative data on maternal vaccination are obtained via a questionnaire; perinatal database studies — these include studies that use state/territory‐wide perinatal data collections or perinatal registers where information on maternal vaccination is captured; case–control studies — defined by individuals who meet symptom eligibility criteria and who present to a medical facility/hospital, are tested for the disease of interest and are classified as either test‐positive cases or test‐negative controls; and interventional studies — these are experimental and have a control group. Vaccine coverage from interventional studies is shown pre‐ and post‐intervention where relevant. * Where calendar years are not reported for coverage, the coverage shown is relative to the study period. † Data shown was manually calculated/estimated from the published data. ‡ Vaccine coverage is recorded by the midwife into the VPDC according to the mother's self‐recollection of vaccination or any written evidence.35,45 ¶ Exact data could not be located from source statistics: data estimated based on Queensland Health 2020 (Figure 5.13)24. § Vaccine coverage is entered into the Midwives Notification System from a midwife, nurse or medical practitioner attending the birth and may include mother's self‐report of vaccination in pregnancy.46,47 || Data reported by the Midwives Notification System was total coverage in percentage points to 100% including unknown coverage. Numerator and denominator data were supplied by WA Health. Percentage coverage among women with known vaccination status was calculated by subtracting for women who reported unknown vaccination status. Vaccination data collection by the Midwives Notification System commenced in July 2016. The denominator is the number of women who gave birth. |
|||||||||||||||
Box 3 – Studies reporting influenza vaccine uptake in pregnancy, by year
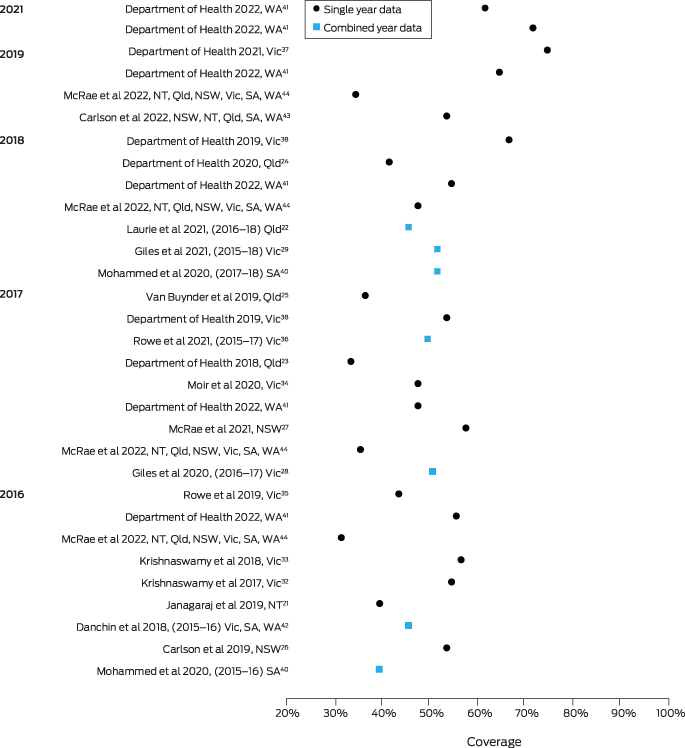
Where possible, individual year data on vaccine coverage are shown in preference to combined year data. A published study may be shown multiple times, across years, where it has provided data for individual years. Where individual calendar year data could not be determined from published works, the total combined year coverage is shown by blue squares against the last year of captured vaccine data. Calendar years included in combined year vaccine coverage estimates are shown with author details in parentheses. Post‐intervention vaccine coverage from interventional studies has been excluded; reference group coverage from these studies is also not shown as data are already reported in other studies or predate 2016.
Box 4 – Studies on pertussis vaccine coverage in pregnancy
|
|
|
|
|
|
|
Vaccine coverage |
|||||||||
|
State/territory |
Publication |
Study period |
Study design** |
Cohort description (participants, setting) |
Validation of vaccination status |
Total population |
First Nations Australians |
Non‐First Nations Australians |
|||||||
|
|
|||||||||||||||
|
NT |
Janagaraj et al 201948 |
2016 |
Perinatal database study |
All births >24 weeks’ gestation that occurred in NT public hospitals identified through the NT Perinatal Register during 2016 |
Validated (NT Immunisation Register) |
1660/3392 (49%) |
591/1281† (46%) |
1069/2111 (51%) |
|||||||
|
Qld |
Laurie et al 202122 |
May 2016–May 2018 |
Retrospective cohort study |
Pregnant women in second or third trimester attending First Nations‐specific primary care clinics and public hospitals in south‐east Queensland |
Validated (AIR) |
216/310 (70%) |
31/58 (53%) |
185/252 (73%) |
|||||||
|
|
Department of Health 201823 |
2016–2017 |
Perinatal database study |
Women who gave birth to one or more infants in Queensland during the study period |
Self‐report only |
40500/~64285† (63%; 2017)¶ |
— |
— |
|||||||
|
|
Department of Health 202024 |
2016–2018 |
Perinatal database study |
Women who gave birth to one or more infants in Queensland during the study period |
Not stated, presumed self‐report as for previous years |
40557†/59644 (68%; 2018) |
~43% (2016); ~48% (2017); ~55% (2018)†§ |
~55% (2016); ~65% (2017); ~70% (2018)†¶ |
|||||||
|
|
Van Buynder et al 201925 |
Apr–Oct 2017 |
Survey |
Postnatal women aged ≥18 years attending public vaccination clinics on the Gold Coast |
Self‐report only |
864/1014 (85%) |
— |
— |
|||||||
|
NSW |
Abdou et al 201749 |
Sept–Dec 2016 (audit period) |
Retrospective cohort study |
Third trimester women attending a public hospital antenatal clinic in Sydney |
Validated (antenatal records, medication charts and pertussis vaccine administration register) |
200/300 (67%) |
— |
— |
|||||||
|
Vic |
Giles et al 202129 |
July 2015–Dec 2018 |
Perinatal database study |
Singleton births ≥28 weeks’ gestation in Victoria |
Self‐report and validated (VPDC‡) |
192487/269493 (71%) |
— |
— |
|||||||
|
|
Giles et al 202130 |
2019 |
Interventional |
Pregnant women who attended one of six maternity services in Victoria |
Self‐report and validated (VPDC‡) |
N =11121 |
— |
— |
|||||||
|
|
Kaufman et al 202031 |
Oct 2018–2019 |
Interventional |
Pregnant women attending a public hospital antenatal clinic in Melbourne |
Self‐report only |
51/55 (93%) |
— |
— |
|||||||
|
|
Krishnaswamy et al 201732 |
Aug–Dec 2016 |
Survey |
Women who were admitted and delivered a healthy baby at one public hospital network and two private hospitals in Melbourne |
Self‐report only |
479/689 (70%) |
— |
— |
|||||||
|
|
Krishnaswamy et al 201833 |
Sept–Dec 2016 |
Survey |
Pregnant women, including non‐English speaking, attending antenatal care at a public health care network in Melbourne; pertussis vaccination coverage in pregnancy was reported for women ≥32 weeks’ gestation |
Self‐report only |
124/204 (61%) |
— |
— |
|||||||
|
|
Krishnaswamy et al 201850 |
Sept 2015–June 2017 |
Interventional |
Women attending three different antenatal facilities in Monash Health |
Self‐report and validated (VPDC‡) |
N =1766 (68–91% post intervention with standing orders) |
— |
— |
|||||||
|
|
Moir et al 202034 |
Jan 2017–Jan 2018 |
Survey |
Women who delivered their infant at ≥32 weeks’ gestation at a large hospital in western Melbourne |
Self‐report only |
1082/1305 (83%) |
— |
— |
|||||||
|
|
Rowe et al 201935 |
July 2015–June 2017 |
Retrospective population cohort study |
Pregnancies ≥28 weeks’ gestation that ended in the study period captured by the VPDC |
Self‐report and validated (VPDC‡) |
98853/153980 (64%; July 2015–June 17) |
650/1040 (63%; 2016) excluding missing data† |
50250/18834 (72%) excluding missing data† |
|||||||
|
|
Rowe et al 202136 |
Sept 2015–Dec 2017 |
Perinatal database study |
Pregnancies that ended in the study period captured by the VPDC; these were linked to five other databases capturing events of public health importance |
Self‐report and validated (VPDC‡) |
128060/186920 (69%) |
1666/2459 (68%) excluding missing data† |
125050/165628 (76%) excluding missing data† |
|||||||
|
|
Department of Health 201938 |
2017–2018 |
Perinatal database study |
Women who delivered an infant among both public and private hospitals statewide captured by the VPDC |
Self‐report and validated (VPDC‡) |
61019/78229 (78%; 2017) |
— |
— |
|||||||
|
SA |
Mohammed et al 201839 |
Nov 2014–June 2016 |
Interventional |
Pregnant women aged ≥18 years attending antenatal care at a maternity hospital in Adelaide |
Self‐report |
140/155 (90%) post intervention (control group coverage not shown as predates 2016) |
— |
— |
|||||||
|
|
Mohammed et al 202040 |
2015–2018 |
Prospective cohort study |
Healthy nulliparous women who delivered an infant at ≥28 weeks’ gestation at two public hospitals |
Validated (medical case notes and pregnancy hand‐held records) |
1024/1296 (79%): 77% (2015); 81%, (2016); 78% (2017) |
15/24 (63%) |
1009/1272 (79%) |
|||||||
|
WA |
Department of Health 202251 |
2016–2021 |
Perinatal database study |
Births registered in the Midwives Notification System |
Self‐report and validated (Midwives Notification System||) |
N =146696 |
— |
— |
|||||||
|
Vic, SA, WA |
Danchin et al 201842 |
Oct 2015–2016 |
Survey |
Pregnant women attending public hospital antenatal clinics from four locations: Melbourne, Victoria (2); Adelaide, SA (1); Perth, WA (1) |
Self‐report only |
236/290 (82%) |
— |
— |
|||||||
|
NSW, NT, Qld, SA, WA |
Carlson et al 202243 |
2019 |
Survey |
Mothers of infants <6 months of age and hospitalised for acute respiratory infection in five hospitals across Australia as captured by the PAEDS network |
Self‐report only |
72/81 (89%) |
— |
— |
|||||||
|
|
|||||||||||||||
|
AIR = Australian Immunisation Register; NSW = New South Wales; NT = Northern Territory; PAEDS = Paediatric Active Enhanced Disease Surveillance; Qld = Queensland; SA = South Australia; Vic = Victoria; VPDC = Victorian Perinatal Data Collection; WA = Western Australia. ** The majority of studies are observational studies and defined further as: surveys — quantitative data on maternal vaccination are obtained via a questionnaire; perinatal database studies — these include studies that use state/territory‐wide perinatal data collections or perinatal registers where information on maternal vaccination is captured; case–control studies — defined by individuals who meet symptom eligibility criteria and who present to a medical facility/hospital, are tested for the disease of interest and are classified as either test‐positive cases or test‐negative controls; and interventional studies — these are experimental and have a control group. Vaccine coverage from interventional studies is shown pre‐ and post‐intervention where relevant. * Where calendar years are not reported for coverage, the coverage shown is relative to the study period. † Data shown was manually calculated/estimated from the published data. ‡ Vaccine coverage is recorded by the midwife into the VPDC according to the mother's self‐recollection of vaccination or any written evidence.35,45 ¶ Exact data could not be located from source statistics: data estimated based on Queensland Health 2020 (Figure 5.13)24. § Vaccine coverage is entered into the Midwives Notification System from a midwife, nurse or medical practitioner attending the birth and may include mother's self‐report of vaccination in pregnancy.46,47 || Data reported by the Midwives Notification System was total coverage in percentage points to 100% including unknown coverage. Numerator and denominator data were supplied by WA Health. Percentage coverage among women with known vaccination status was calculated by subtracting for women who reported unknown vaccination status. Vaccination data collection by the Midwives Notification System commenced in July 2016. The denominator is the number of women who gave birth. |
|||||||||||||||
Box 5 – Studies reporting pertussis vaccine uptake in pregnancy, by year
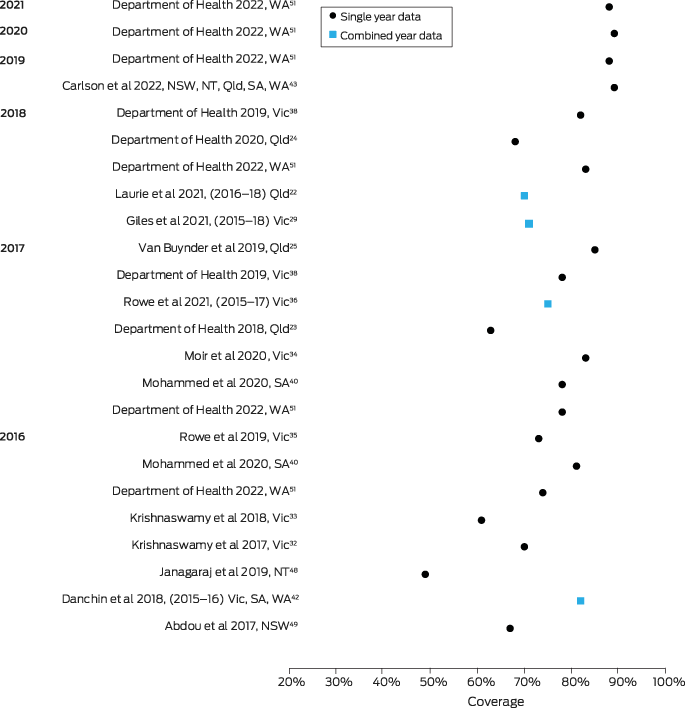
Where possible, individual year data on vaccine coverage are shown in preference to combined year data. A published study may be shown multiple times, across years, where it has provided data for individual years. Where individual calendar year data could not be determined from published works, the total combined year coverage is shown by blue squares against the last year of captured vaccine data. Calendar years included in combined year vaccine coverage estimates are shown with author details in parentheses. Post‐intervention vaccine coverage from interventional studies has been excluded; reference group coverage from these studies is also not shown as data are already reported in other studies or predate 2016.
Box 6 – Studies reporting influenza and pertussis vaccine coverage in pregnancy among First Nations women compared with coverage among non‐First Nations women
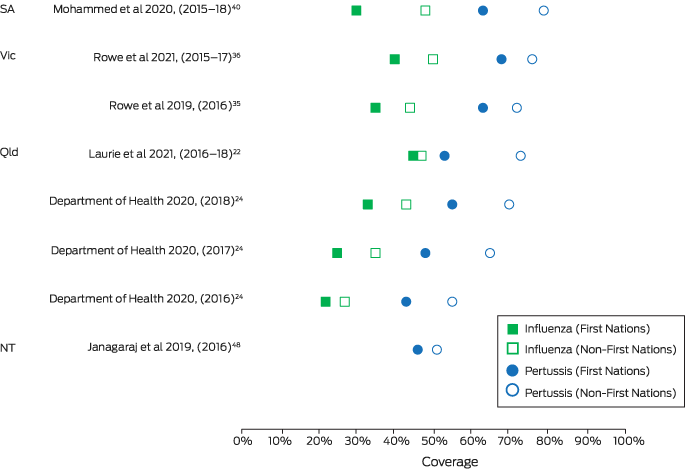
NT = Northern Territory; Qld = Queensland; SA = South Australia; Vic = Victoria. The study period is denoted in parentheses following the author's name and year of publication. Data on influenza vaccine coverage were not available from the NT study.48
Competing interests
No relevant disclosures.
References
- Department of Health and Aged Care. National Notifiable Diseases Surveillance System (NNDSS) fortnightly summary notes – 2019. Fortnight 24: 23 November to 06 December 2019. https://webarchive.nla.gov.au/awa/20210605044019/https://www1.health.gov.au/internet/main/publishing.nsf/Content/cdnareport‐fn24‐19.htm (viewed May 2023).
- Department of Health and Aged Care. Australian Influenza Surveillance Report (AISR) – 2019 national influenza season summary. 2021. https://www.health.gov.au/resources/publications/aisr‐2019‐national‐influenza‐season‐summary?language=en (viewed May 2023).
- Nunes MC, Madhi SA. Prevention of influenza‐related illness in young infants by maternal vaccination during pregnancy. F1000 Res 2018; 7: 122.
- Neuzil KM, Reed GW, Mitchel EF, et al. Impact of influenza on acute cardiopulmonary hospitalizations in pregnant women. Am J Epidemiol 1998; 148: 1094‐1102.
- Cox S, Posner SF, McPheeters M, et al. Hospitalizations with respiratory illness among pregnant women during influenza season. Obs Gynecol 2006; 107: 1315‐1322.
- Lafond KE, Nair H, Rasooly MH, et al. Global role and burden of influenza in pediatric respiratory hospitalizations, 1982–2012: a systematic analysis. PLoS Med 2016; 13: e1001977.
- Madhi SA, Cutland CL, Kuwanda L, et al. Influenza vaccination of pregnant women and protection of their infants. N Engl J Med 2014; 371: 918‐931.
- Maltezou HC, Asimakopoulos G, Stavrou S, et al. Effectiveness of quadrivalent influenza vaccine in pregnant women and infants, 2018–2019. Vaccine 2020; 38: 4625‐4631.
- Molgaard‐Nielson D, Fischer T, Krause T, Hviid A. Effectiveness of maternal immunization with trivalent inactivated influenza vaccine in pregnant women and their infants. J Intern Med 2019; 286: 469‐480.
- Regan AK, Klerk N, Moore HC, et al. Effectiveness of seasonal trivalent influenza vaccination against hospital‐attended acute respiratory infections in pregnant women: a retrospective cohort study. Vaccine 2016; 34: 3649‐3656.
- Mertz D, Kim TH, Johnstone J, et al. Populations at risk for severe or complicated influenza illness: systematic review and meta‐analysis. BMJ 2013; 347: 5061.
- Campbell H, Amirthalingam G, Andrews N, et al. Accelerating control of pertussis in England and Wales. Emerg Infect Dis 2012; 18: 38‐47.
- Perrett KP, Halperin SA, Nolan T, et al. Immunogenicity, transplacental transfer of pertussis antibodies and safety following pertussis immunization during pregnancy: Evidence from a randomized, placebo‐controlled trial. Vaccine 2020; 38: 2095‐2104.
- Chu HY, Englund JA. Maternal immunization. Birth Defects Res 2017; 109: 379‐386.
- Zaman K, Roy E, Arifeen SE, et al. Effectiveness of maternal influenza immunization in mothers and infants. N Engl J Med 2008; 359: 1555‐1564.
- Quinn HE, Comeau JL, Marshall HS, et al. Pertussis disease and antenatal vaccine effectiveness in Australian children. Pediatr Infect Dis J 2022; 41: 180‐185.
- National Centre for Immunisation Research and Surveillance (NCIRS). History of immunisation in Australia. Influenza. http://ncirs.org.au/health‐professionals/history‐immunisation‐australia (viewed June 2022).
- Australian Technical Advisory Group on Immunisation. Australian immunisation handbook. Pertussis (whooping cough). https://immunisationhandbook.health.gov.au/contents/vaccine‐preventable‐diseases/pertussis‐whooping‐cough (viewed Mar 2023).
- National Centre for Immunisation Research and Surveillance (NCIRS). History of immunisation in Australia. Diphtheria, tetanus, pertussis. https://www.ncirs.org.au/health‐professionals/history‐immunisation‐australia (viewed Mar 2022).
- Australian Technical Advisory Group on Immunisation. Changes to the recommended use of pertussis vaccines in pregnant women. January 2019. https://consultations.health.gov.au/ohp‐immunisation‐branch/maternal‐pertussis‐vaccination/supporting_documents/Final%20public%20%20changes%20to%20the%20recommended%20use%20of%20pertussis%20vaccines%20in%20pregnant%20women.pdf (viewed Sept 2022).
- Janagaraj PD, Gurusamy PSR, Webby R. Gaps in maternal influenza vaccine uptake in Northern Territory: a need for a year‐round influenza vaccination campaign. Commun Dis Intell 2019; 43; doi: https://doi.org/10.33321/cdi.2019.43.49.
- Laurie L, Lambert SB, Jones L, et al. Influenza and pertussis vaccine uptake during pregnancy among Australian women in south‐east Queensland, Australia. Aust N Z J Public Health 2021; 45: 443‐448.
- Queensland Health. The health of Queenslanders 2018. Report of the Chief Health Officer Queensland. Brisbane: State of Queensland, 2018. https://www.health.qld.gov.au/__data/assets/pdf_file/0032/732794/cho‐report‐2018‐full.pdf (viewed Mar 2022).
- Queensland Health. The health of Queenslanders 2020. Report of the Chief Health Officer Queensland. Brisbane: State of Queensland, 2020. https://www.health.qld.gov.au/__data/assets/pdf_file/0019/1011286/cho‐report‐2020‐full.pdf (viewed Mar 2022).
- Van Buynder PG, Van Buynder JL, Menton L, et al. Antigen specific vaccine hesitancy in pregnancy. Vaccine 2019; 37: 2814‐2820.
- Carlson S, Dey A, Beard F. An evaluation of the 2016 influenza vaccination in pregnancy campaign in NSW, Australia. Public Heal Res Pract 2019; 30: 29121908.
- McRae JE, Dey A, Carlson S, et al. Influenza vaccination among pregnant women in two hospitals in Sydney, NSW: What we can learn from women who decline vaccination. Public Heal Res Pract 2021; 32: 3123‐2111.
- Giles ML, Davey MA, Krishnaswamy S, et al. Maternal influenza vaccination reduces preterm birth and stillbirth. J Paediatr Child Health 2020; 56 Suppl 1: 138.
- Giles ML, Davey MA, Wallace EM. Associations between maternal immunisation and reduced rates of preterm birth and stillbirth: a population based retrospective cohort study. Front Immunol 2021; 12: 704254.
- Giles ML, Khai K, Krishnaswamy S, et al. An evaluation of strategies to achieve greater than 90% coverage of maternal influenza and pertussis vaccines including an economic evaluation. BMC Pregnancy Childbirth 2021; 21: 771.
- Kaufman J, Attwell K, Tuckerman J, et al. Feasibility and acceptability of the multi‐component P3‐MumBubVax antenatal intervention to promote maternal and childhood vaccination: a pilot study. Vaccine 2020; 38: 4024‐4031.
- Krishnaswamy S, Wallace EM, Cheng AC, et al. Protecting newborns from pertussis: the role of partner vaccination in the era of maternal immunization. Eur J Obstet Gynecol Reprod Biol 2017; 216: 159‐163.
- Krishnaswamy S, Cheng AC, Wallace EM, et al. Understanding the barriers to uptake of antenatal vaccination by women from culturally and linguistically diverse backgrounds: a cross‐sectional study. Hum Vaccines Immunother 2018; 14: 1591‐1598.
- Moir D, Gunter K, Lynch L‐A, et al. Antenatal vaccine uptake: a cross‐sectional study investigating factors influencing women's choices in pregnancy. Aust N Z J Obstet Gynaecol 2020; 60: 729‐737.
- Rowe SL, Perrett KP, Morey R, et al. Influenza and pertussis vaccination of women during pregnancy in Victoria, 2015–2017. Med J Aust 2019; 210: 454‐462. https://www.mja.com.au/journal/2019/210/10/influenza‐and‐pertussis‐vaccination‐women‐during‐pregnancy‐victoria‐2015‐2017#:~:text=The%20new%3A%20Pertussis%20vaccination%20of,the%20level%20varied%20by%20season
- Rowe SL, Leder K, Perrett KP, et al. Maternal vaccination and infant influenza and pertussis. Pediatrics 2021; 148: e2021051076.
- Safer Care Victoria. Victorian perinatal services performance indicators 2019–20. https://www.safercare.vic.gov.au/publications/victorian‐perinatal‐services‐performance‐indicators‐2019‐20 (viewed Mar 2022).
- Safer Care Victoria. Victorian perinatal services performance indicators 2018–19. https://www.safercare.vic.gov.au/publications/pspi‐2018‐19 (viewed Mar 2022).
- Mohammed H, Clarke M, Koehler A, et al. Factors associated with uptake of influenza and pertussis vaccines among pregnant women in South Australia. PLoS One 2018; 13: e0197867.
- Mohammed H, Roberts CT, Grzeskowiak LE, et al. Psychosocial determinants of pertussis and influenza vaccine uptake in pregnant women: a prospective study. Vaccine 2020; 38: 3358‐3368.
- Department of Health WA. Midwives Notification System. Influenza vaccination. https://ww2.health.wa.gov.au/Reports‐and‐publications/Western‐Australias‐Mothers‐and‐Babies‐summary‐information/data?report=mns_fluv_y (viewed Apr 2022).
- Danchin MH, Costa‐Pinto J, Attwell K, et al. Vaccine decision‐making begins in pregnancy: correlation between vaccine concerns, intentions and maternal vaccination with subsequent childhood vaccine uptake. Vaccine 2018; 36: 6473‐6479.
- Carlson S, McRae J, Wiley K, et al. Knowledge, attitudes and practices regarding influenza vaccination among parents of infants hospitalised for acute respiratory infection in Australia. Public Heal Res Pract 2022; 32:32012202.
- McRae J, Blyth CC, Cheng AC, et al. Preventing severe influenza in Australian infants: maternal influenza vaccine effectiveness in the PAEDS‐FluCAN networks using the test‐negative design. Vaccine 2022; 40: 2761‐2771.
- Victorian Government Department of Health. Victorian Perinatal Data Collection (VPDC) manual 2021–22. Section 3 – Data definitions. https://www.health.vic.gov.au/publications/victorian‐perinatal‐data‐collection‐vpdc‐manual‐2021‐22 (viewed Mar 2022).
- Department of Health WA. Guidelines for midwives notification of case attended. 2021. https://ww2.health.wa.gov.au/~/media/Corp/Documents/Health‐for/Data‐collection/Guidelines_Completion_of_NOCA_202107.pdf (viewed Mar 2022).
- Regan AK, Effler P V, Thomson C, Mak DB. Potential use of Western Australia's mandatory Midwives Notification System for routinely monitoring antenatal vaccine coverage. Commun Dis Intell 2019; 43: 1‐12.
- Janagaraj PD, Gurusamy PSR, Webby R. Current antenatal pertussis vaccination guidelines miss preterm infants: an epidemiological study from the Northern Territory. Aust N Z J Obstet Gynaecol 2019; 59: 436‐443.
- Abdou R, Henry A, Kavanagh‐Patel K. Pertussis vaccination in pregnancy: increasing uptake through free antenatal clinic availability? [abstract]. J Paediatr Child Health 2017; 53 Suppl 2: 3.
- Krishnaswamy S, Wallace E, Buttery J, Giles M. Strategies to implement maternal vaccination: A comparison between standing orders for midwife delivery, a hospital based maternal immunisation service and primary care. Vaccine 2018; 36: 1796‐1800.
- Department of Health WA. Midwives Notification System. Pertussis vaccination. https://ww2.health.wa.gov.au/Reports‐and‐publications/Western‐Australias‐Mothers‐and‐Babies‐summary‐information/data?report=mns_pertv_y (viewed Apr 2022).
- Benowitz I, Esposito DB, Gracey KD, et al. Influenza vaccine given to pregnant women reduces hospitalization due to influenza in their infants. Clin Infect Dis 2010; 51: 1355‐1361.
- Shakib JH, Korgenski K, Presson AP, et al. Influenza in infants born to women vaccinated during pregnancy. Pediatrics 2016; 137: e20152360.
- Wiley KE, Cooper SC, Wood N, Leask J. Understanding pregnant women's attitudes and behavior toward influenza and pertussis vaccination. Qual Health Res 2015; 25: 360‐370.
- Australian Institute of Health and Welfare. Australia's mothers and babies. https://www.aihw.gov.au/reports/mothers‐babies/australias‐mothers‐babies/contents/summary (viewed July 2022).
- UK Health Security Agency. Pertussis vaccination coverage for pregnant women in England, January to March 2021 and annual; coverage 2021 to 2022. https://www.gov.uk/government/publications/pertussis‐immunisation‐in‐pregnancy‐vaccine‐coverage‐estimates‐in‐england‐october‐2013‐to‐march‐2014/pertussis‐vaccination‐coverage‐for‐pregnant‐women‐in‐england‐january‐to‐march‐and‐annual‐coverage‐2021‐to‐20 (viewed Oct 2022).
- UK Health Security Agency. Seasonal influenza vaccine uptake in GP patients: winter season 2021 to 2022. https://www.gov.uk/government/statistics/seasonal‐influenza‐vaccine‐uptake‐in‐gp‐patients‐winter‐season‐2021‐to‐2022 (viewed Oct 2022).
- Baissas T, Boisnard F, Cuesta Esteve I, et al. Vaccination in pregnancy against pertussis and seasonal influenza: key learnings and components from high‐performing vaccine programmes in three countries: the United Kingdom, the United States and Spain. BMC Public Health 2021; 21: 2182.
- McHugh L, Van Buynder P, Sarna M, et al. Timing and temporal trends of influenza and pertussis vaccinations during pregnancy in three Australian jurisdictions: The Links2HealthierBubs population‐based linked cohort study, 2012–2017. Aust N Z J Obstet Gynaecol 2022. doi: https://doi.org/10.1111/ajo.13548 [Epub ahead of print].
- Menzies R, Aqel J, Abdi I, et al. Why is influenza vaccine uptake so low among Aboriginal adults? Aust N Z J Public Health 2020; 44: 279‐83.
- Lotter K, Regan AK, Thomas T, et al. Antenatal influenza and pertussis vaccine uptake among Aboriginal mothers in Western Australia. Aust N Z J Obstet Gynaecol 2018; 58: 417‐24.
- Hendry AJ, Beard FH, Dey A, et al. Closing the vaccination coverage gap in New South Wales: the Aboriginal Immunisation Healthcare Worker Program. Med J Aust 2018; 209: 24‐28. https://www.mja.com.au/journal/2018/209/1/closing‐vaccination‐coverage‐gap‐new‐south‐wales‐aboriginal‐immunisation
- Australian Digital Health Agency. Australian Immunisation Register. https://developer.digitalhealth.gov.au/products/australian‐immunisation‐register (viewed July 2022).
- Tuckerman J, Blyth C, Beard F, Danchin M. COVID‐19 and changes in the National Immunisation Program: A unique opportunity to optimise the Australian Immunisation Register (AIR). Med J Aust 2021; 214: 247‐249. https://www.mja.com.au/journal/2021/214/6/covid‐19‐and‐changes‐national‐immunisation‐program‐unique‐opportunity‐optimise
- Australian Government Department of Health and Aged Care. Australian Immunisation Register linked to the Multi‐Agency Data Integration Project. https://www.health.gov.au/our‐work/australian‐immunisation‐register‐linked‐to‐the‐multi‐agency‐data‐integration‐project (viewed Mar 2023).
Provenance: Not commissioned; externally peer reviewed.
Costs of Delivering the Hep B PAST Model of Care in Remote Australia: A Retrospective Pre–Post Study
Hoa Nguyen, Anh Le Tuan Nguyen, Paula Binks, Melita McKinnon, Emily Vintour-Cesar, Karen Wills, Nicola Stephens, Benjamin Cowie, Joshua S. Davis, Yuejen Zhao, Peter Nihill, Julie A. Campbell, Andrew J. Palmer, Jane Davies, Barbara de Graaff
Buruli Ulcer Acquired From Ringtail Possum Rescue
Daniel P. O'Brien, Naomi Clarke, Sara Bonnici, Mohammad A. Hussain
Q Fever Visceral Abscesses After Contact With Native Australian Marsupials
Samantha J. Laws, Enzo Binotto, James Stewart, Jennifer Ho, Trent Yarwood, Josh Hanson, Simon Smith
Hospital-Admitted Injection-Related Infections Among Incarcerated People Who Inject Drugs in Australia: A Retrospective Cohort Study
Andrew Palmer, Matthew Carter, Jeremy Yeo, Cecilia Shim, Jason Connor, Jeremy Hayllar, Gerald Holtmann, Naomi Moy, Elliott G. Playford, Naomi Runnegar, Paul J. Clark
The Live Attenuated Influenza Vaccine in Australia: An Additional Tool for Influenza Prevention
Cyra Patel, Alexis Pillsbury, Tran Nguyen, Xia Wang, Helen E. Quinn, Clayton K. Chiu, Allen C. Cheng, Katie L. Flanagan, Zhicheng Wang
Reflex Testing for Hepatitis D Infection: A Unique Opportunity to Reduce Hepatitis D-Related Chronic Liver Disease Deaths in Australia
Jessica Howell, Lauren Andersson, Miriam T. Levy, James O'Beirne, Leon Adams, Katharine Irvine, Avik Majumdar, Golo Ahlenstiel, Kathy Jackson, Krispin Hajkowicz, Joseph Doyle, Jane Davies, Sarah Cherian, Wayne Dimech, Alexander J. Thompson