




Volume 214 - Issue 2
Demographics and performance of candidates in the examinations of the Australian Medical Council, 1978–2019
Authors: Neville D Yeomans, Jillian R Sewell, Philip Pigou and Stuart Macintyre
Med J Aust 2021; 214 (2): 54-58.e1. || doi: 10.5694/mja2.50800
Published online: 5 October 2020
Published online: 5 October 2020
Australia has relied, for most of its history, on international medical graduates (IMGs) to supplement its workforce. Since 1978, IMGs applying for general registration to practise in Australia have usually needed to pass the examinations of the Australian Medical Examining Council, or since 1986, its successor, the Australian Medical Council (AMC). The AMC provides several pathways to registration by the Australian Health Practitioner Regulation Agency (AHPRA). The route now termed “the standard pathway” consists of a two‐part assessment including a multiple choice question (MCQ) examination followed by a clinical examination. While most IMGs are required to pass both examinations, since 2007, IMGs who qualified in the so‐called competent authority countries (the United Kingdom, Ireland, the United States and Canada) have usually not been required to sit these examinations.1
The examinations have sometimes provoked controversy and political responses in various forms.2,3,4 Partly in reaction to these, but mainly through an internal process of continuous improvement, their formats have been adapted considerably over the 42‐year period. The MCQ examination assesses “basic and applied medical knowledge across a wide range of topics,” and since 2000, its pass mark has been set using item response theory.5,6 The original clinical examination used short cases and viva voces; in 2004, this was replaced by a 16‐station objective structured clinical examination (OSCE). The standard of both examinations is set at that “of newly qualified graduates of Australian medical schools who are about to commence intern training”.6
The last account of the demographic features of candidates attempting the examinations and their performance was provided in 2010.5 Now, a decade later, there have been striking changes in both these parameters, which we document and evaluate in this article. A further aim was to identify some demographic or candidate factors that might influence examination success.
Source of data
De‐identified information about candidates who took the MCQ and clinical examinations of the Australian Medical Examining Council and AMC, from their inception in 1978 until October 2019, were provided by the Council. It included the country and year of primary medical qualification, gender, year of birth, years of first attempt and success, and number of attempts for each candidate.
From this information, we calculated the numbers of candidates, numbers of attempts, the success rate per attempt, and the proportion eventually achieving success each year. To examine the contributions of individual countries, results were aggregated into decades. Countries of training were also consolidated into regions, according to the United Nations geographical regions report, last updated in 1999 (Supporting information, table 1).7
Ethics approval was obtained from the University of Melbourne Human Research Ethics Committee (ID: 1750338.3).
Demographic features of candidates
Over the 42‐year period, a total of 35 699 candidates from 153 countries sat the MCQ examination, 16 588 (46.7%) of whom were female (Box 1). The median age of all candidates at their first MCQ attempt was 32 years (interquartile range [IQR], 28–37 years; range, 20–73 years). The clinical examination was attempted by 20 494 candidates. Their demographic features were similar to that of the candidates for the MCQ.
Box 1 shows the number of candidates for the MCQ and clinical examination for the top ten countries of primary medical qualification at each examination. The data for countries grouped by UN region are provided in the online Supporting information, table 1, and data for candidates from all individual countries (except those with very few candidates) are provided in the online Supporting information, table 2. South Asia was the region contributing most candidates, with just under half the total — predominantly graduates from India, Pakistan and Sri Lanka. Next in order were those from South‐East Asia and North Africa.
Candidate performance
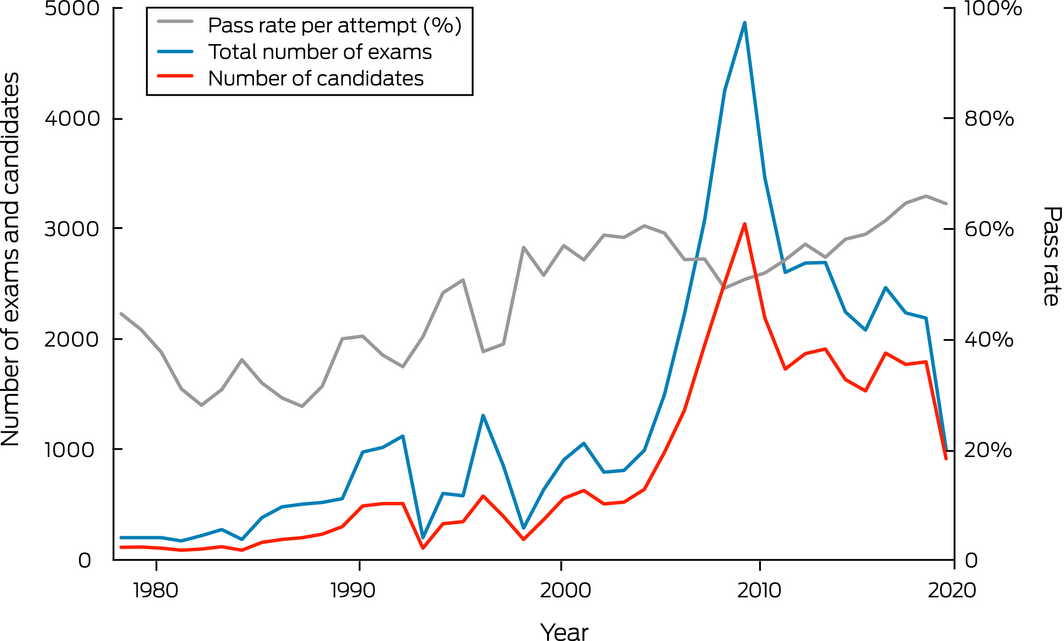
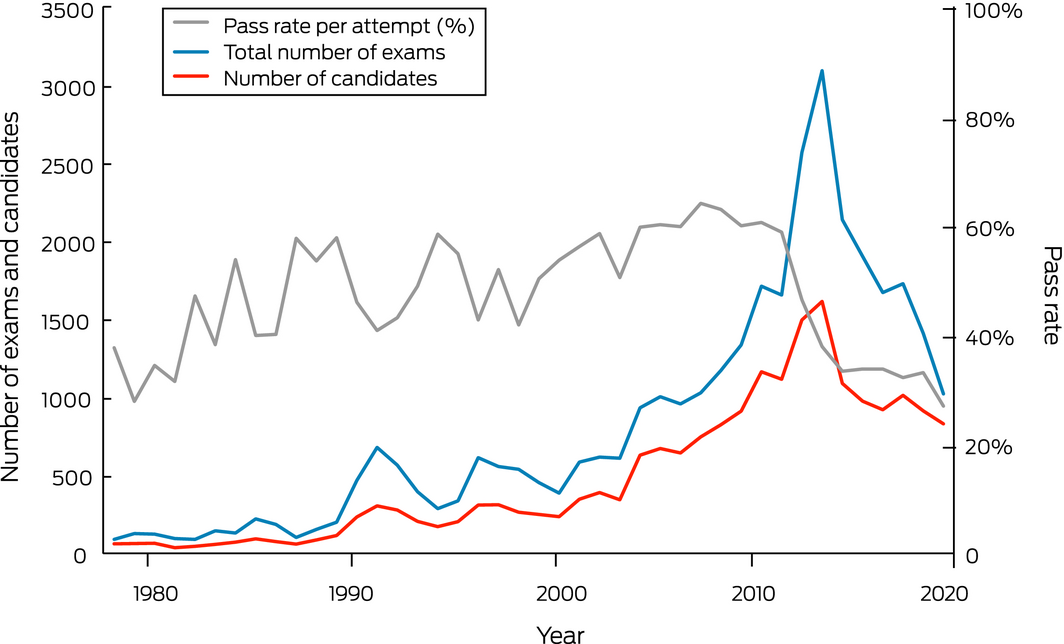
From a low base until about the year 2000, there was a marked increase in candidates attempting each examination, reaching a peak in 2009 for the MCQ and 4 years later for the clinical examination (Box 2 and Box 3). Although the candidate numbers declined slightly after these peaks, they remained almost fourfold higher than in 2000.
The pass rate at each attempt in the MCQ examination fluctuated, with most year‐to‐year variations not reaching statistical significance. However, overall pass rates per attempt increased over time, from a low of 28% in 1987 to a high of 66% in 2018. Some candidates showed great persistence: 86 attempted the examination ten or more times.
As with the MCQ examination, the pass rate in the clinical examination increased between the 1980s and the 2000s, reaching a peak of 64% in 2007. However, between 2011 and 2012 it fell by more than 10%, followed by a further decline; and for the past 5 years (excepting 2019 when data were incomplete), it has remained just above 30%. Nevertheless, most candidates who persevered managed to pass after one or two further attempts. As with the MCQ, there were a few who found it much more difficult. Five or more attempts were made by 621 candidates (3.0%), 144 of whom have not yet succeeded.
Pass rates by individual country are provided in the Supporting information, table 3.
In the MCQ, during the past three decades, women had a higher pass rate per attempt and overall, although the magnitude of the difference (about 3%) was small (Box 4). In the clinical examination since 1990, women had both a higher pass rate and fewer attempts. In the most recent decade, the difference in pass rates was substantial (+12%).
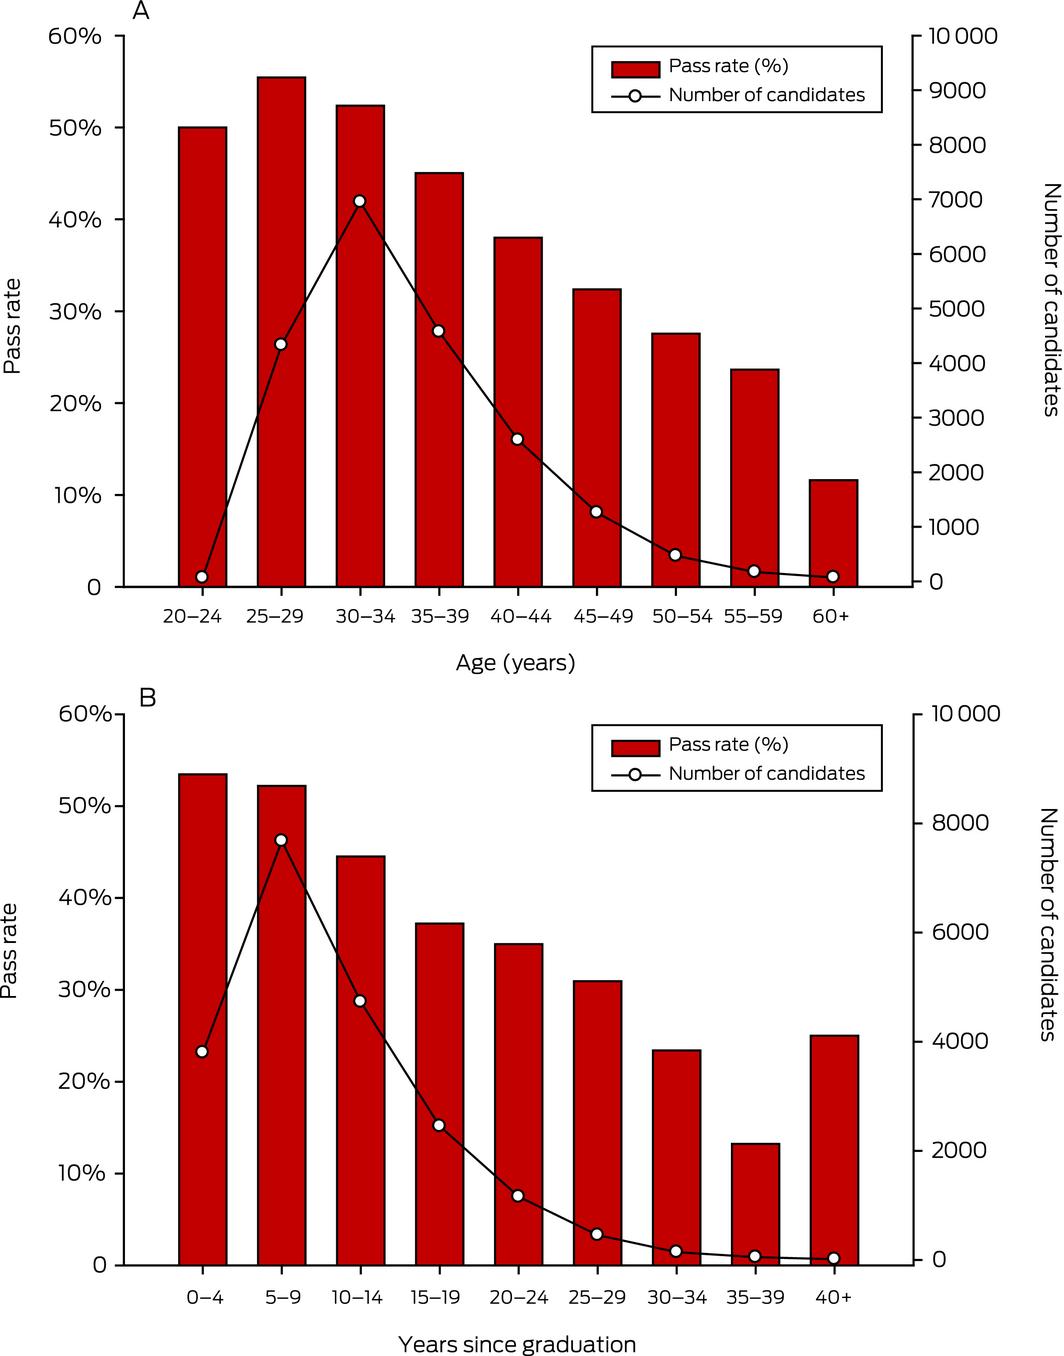
Box 5 and Box 6 show the pass rates in the MCQ and clinical examinations, respectively, graphed against candidates’ age and the interval (recency) since their medical graduation. There was a marked decline in success with both increasing age and interval since graduation; this was more marked in the clinical examination. While the number of candidates who were 55 years or older was small (245; 1.2% of total), their pass rate was one‐third that of candidates aged 20–29 years, and only 45% of the older group eventually passed.
Commentary
Before 2000, the number of IMGs attempting AMC examinations annually was usually less than 300 and never exceeded 600. However, between 2000 and 2018, candidate numbers increased more than threefold to an annual mean of 1003 during a period when the number of all Australians born overseas increased only from 4.5 to 7.3 million.8 Some factors likely to have contributed to the increase in candidates were removal in 1998 of the requirement to be an Australian citizen, and offering the computer‐delivered MCQ examination from 2005 in several centres outside Australia. A further increase in candidates for the MCQ examination resulted from the 2006 decision by the Council of Australian Governments that all IMGs with limited or temporary registration with the individual state medical boards should pass that examination. The peak in attempts at the clinical examination in 2013 followed the establishment of the National Registration and Accreditation Scheme in July 2010 and the requirement that limited registrants (non‐specialists) demonstrate progress towards full registration (including passing the AMC clinical examination where applicable).
It is important to note that these data are specific to those sitting the AMC examinations. They give only a partial picture of medical immigration over this period. Firstly, they do not include IMGs who were registered as specialists by the various states, and subsequently by AHPRA on advice from specialist colleges. Secondly, until 1992 the Medical Acts in all Australian states allowed graduates from the UK (and usually Ireland) exemption from the need for further examination. For the next 15 years, generalists from those countries usually had to take the AMC examinations, but from 2007 they were again exempted (along with IMGs from Canada and the US) when the AMC introduced the competent authority pathway.
The overall success rate in the MCQ examination increased significantly from the 1980s. The AMC made several changes over that time to increase reliability and fairness. One was altering question types to formats less dependent on English language skill; another was publication of annotated question banks to assist candidates in their preparation.5,6,9 From 2000, the pass mark has been set by criterion‐referenced methodology. A further refinement from 2011 was administering the MCQ examination in computer‐adaptive format, where the difficulty of items is adjusted in real time according to a candidate's performance, considered to increase fairness and precision.10
A factor likely to have contributed to the recent lower pass rate in the clinical examination (Box 3) is the removal of nearly all candidates from the competent authority countries. Up till 2009, UK graduates had the highest pass rate in this examination (Supporting information, table 3), and their removal from the pool would inevitably lower the overall rate. However, the decline since 2010 cannot be fully accounted for by this since competent authority candidates comprised less than 10% of the 2000–2009 total. Thus, other factors affecting the most recent cohorts of candidates (eg, the changing mix of parent countries) are likely to have contributed. Many IMGs must often overcome hurdles less likely to be faced by those from competent authority countries. These include adapting to an unfamiliar health system, developing fluency in English, preparing for the examinations while under time pressure from short‐stay visas, and needing to support themselves with sometimes long hours of work outside the health system.11 It is possible, though, that changes in the format or content of the OSCE have also contributed.
The differences between the results for women and men in the MCQ should not be overplayed, since the magnitude was small. Others have found little gender effect in postgraduate written examinations in the UK and the US.12,13
However, the outperformance by women in the clinical examination, particularly in the past decade, is more striking. Those findings have been seen elsewhere. Women perform better than men in Step 2 of the United States Medical Licensing Examination.14 Female overseas‐trained doctors were twice as likely as males to pass the UK Federation of Royal Colleges of Physicians’ Practical Assessment of Clinical Examination Skills (PACES) at their first attempt.15 The PACES examination has many similarities to the AMC OSCE, with communication skills important for both. Female superiority in patient–doctor communication has been documented previously,16 and may partly explain the present findings.
That performance in the MCQ deteriorated with both age and time since graduation is not entirely surprising: the examination tests knowledge in all domains of medicine, including some of the basic sciences. The longer since these were studied, the more difficult it might be to pass questions based on them, especially for IMGs who had practised as specialists in their original country.
More unexpected was the much lower performance in the clinical examination by older candidates. Clinical experience might have been expected to give them an advantage, but this does not appear to have been generally so. We have been unable to find exactly comparable data from medical licensing examinations in other countries. A UK retrospective analysis observed that international graduates aged more than 37 years actually performed better in a postgraduate paediatric examination.17 However, a US analysis noted a negative correlation between age when first certified by the American Board of Internal Medicine and the American Board of Surgery and subsequent success in maintenance of certification examinations.18
Since 1978, these examinations have played an important role in informing the credentialing of generalist IMGs by state medical boards and now the national board. This article has documented substantial changes over the four decades in the demography of candidates, and some factors that were associated with their success in the examinations. The information will be of interest to health planners, but more particularly to those IMGs who have passed through the process and others who are contemplating it. Many rural health services still struggle to meet their workforce needs and rely heavily on doctors who have migrated to practise medicine here.19 Australia continues to owe a debt to its immigrant doctors.
Box 1 – Multiple choice question (MCQ) and clinical examinations: numbers of candidates, top ten countries*
|
Country of training |
1978–1989 |
1990–1999 |
2000–2009 |
2010–2019 |
Total |
||||||||||
|
|
|||||||||||||||
|
MCQ examination |
|
|
|
|
|
||||||||||
|
India |
351 |
496 |
2619 |
2483 |
5949 |
||||||||||
|
Pakistan |
32 |
113 |
1007 |
1838 |
2990 |
||||||||||
|
Sri Lanka |
159 |
246 |
1005 |
1394 |
2804 |
||||||||||
|
Egypt |
179 |
356 |
375 |
1171 |
2081 |
||||||||||
|
Bangladesh |
16 |
99 |
777 |
1107 |
1999 |
||||||||||
|
Iran |
32 |
34 |
664 |
1197 |
1927 |
||||||||||
|
Philippines |
83 |
182 |
646 |
714 |
1625 |
||||||||||
|
China |
4 |
219 |
641 |
745 |
1609 |
||||||||||
|
Myanmar |
21 |
66 |
485 |
772 |
1344 |
||||||||||
|
Iraq |
8 |
160 |
420 |
602 |
1190 |
||||||||||
|
Total all countries |
1864 |
3859 |
12 722 |
17 254 |
35 699 |
||||||||||
|
Clinical examination |
|
|
|
|
|
||||||||||
|
India |
190 |
392 |
1059 |
2074 |
3715 |
||||||||||
|
Sri Lanka |
101 |
194 |
399 |
960 |
1654 |
||||||||||
|
Pakistan |
13 |
59 |
342 |
1168 |
1582 |
||||||||||
|
Bangladesh |
7 |
53 |
483 |
831 |
1374 |
||||||||||
|
Iran |
8 |
27 |
263 |
688 |
986 |
||||||||||
|
China |
0 |
109 |
398 |
475 |
982 |
||||||||||
|
Egypt |
78 |
296 |
195 |
375 |
944 |
||||||||||
|
Myanmar |
5 |
45 |
175 |
661 |
886 |
||||||||||
|
Philippines |
11 |
104 |
198 |
507 |
820 |
||||||||||
|
Iraq |
2 |
85 |
303 |
358 |
748 |
||||||||||
|
Total all countries |
897 |
2588 |
5806 |
11 203 |
20 494 |
||||||||||
|
|
|||||||||||||||
|
* By total number of candidates. Data are listed by the year each candidate first attempted the examination. Many candidates made multiple attempts. International medical graduates trained in the United Kingdom and Ireland were exempted from the Australian Medical Council examinations by most states until 1992. Since 1997, few candidates from the competent authority countries (UK, Ireland, Canada and the United States) were required to take the examinations. |
|||||||||||||||
Box 2 – Number of candidates and success rate per attempt in the multiple choice question examinations since 1978, and total number of attempts by candidates each year*
* Data for 2019 truncated at October.
Box 3 – Number of candidates, success rate per attempt and total attempts in the clinical examinations since 1978, and total number of attempts by candidates each year*
* Data for 2019 truncated at October.
Box 4 – Influence of gender on examination success*
|
Period |
Gender |
N |
Total attempts |
Total passes |
Mean (SD) attempts |
Pass total (%) |
Pass/attempt (%) |
||||||||
|
|
|||||||||||||||
|
MCQ examination |
|
|
|
|
|
|
|
||||||||
|
1978–1989 |
Female |
568 |
1299 |
412 |
2.29 ± 1.84 |
72.5% |
31.7% |
||||||||
|
Male |
1142 |
2431 |
817 |
2.13 ± 1.68 |
71.5% |
33.6% |
|||||||||
|
1990–1999 |
Female |
1691 |
3279 |
1434 |
1.95 ± 1.57 |
84.8% |
43.7% |
||||||||
|
Male |
2164 |
4275 |
1729 |
1.98 ± 1.71 |
79.9% |
40.4% |
|||||||||
|
2000–2009 |
Female |
5438 |
8666 |
4813 |
1.59 ± 1.14 |
88.5% |
55.5% |
||||||||
|
Male |
7287 |
11846 |
6192 |
1.63 ± 1.32 |
85.0% |
52.3% |
|||||||||
|
2010–2019 |
Female |
8891 |
12238 |
7378 |
1.38 ± 0.86 |
83.0% |
60.3% |
||||||||
|
Male |
8365 |
12041 |
6845 |
1.35 ± 0.85 |
81.8% |
56.8% |
|||||||||
|
Clinical examination |
|||||||||||||||
|
1978–1989 |
Female |
257 |
503 |
233 |
1.96 ± 1.58 |
90.7% |
46.3% |
||||||||
|
Male |
543 |
1085 |
471 |
2.00 ± 1.47 |
86.7% |
43.4% |
|||||||||
|
1990–1999 |
Female |
1156 |
2037 |
1084 |
1.76 ± 1.07 |
93.8% |
53.2% |
||||||||
|
Male |
1432 |
2917 |
1243 |
2.04 ± 1.35 |
86.8% |
42.6% |
|||||||||
|
2000–2009 |
Female |
2636 |
3662 |
2428 |
1.39 ± 0.82 |
92.1% |
66.3% |
||||||||
|
Male |
3170 |
5036 |
2772 |
1.59 ± 1.08 |
87.4% |
55.0% |
|||||||||
|
2010–2019 |
Female |
6150 |
9802 |
4535 |
1.59 ± 1.03 |
73.7% |
46.3% |
||||||||
|
Male |
5053 |
9184 |
3132 |
1.82 ± 1.30 |
62.0% |
34.1% |
|||||||||
|
|
|||||||||||||||
|
* MCQ = multiple choice question; SD = standard deviation. * The Australian Medical Examining Council did not list candidates’ gender in a few instances during the first decade. |
|||||||||||||||
Box 5 – Australian Medical Council multiple choice question (MCQ) examination, 1978–2019: pass rates versus (A) age and (B) recency (interval since graduation) in the year when candidates first attempted the MCQ (all countries combined)*
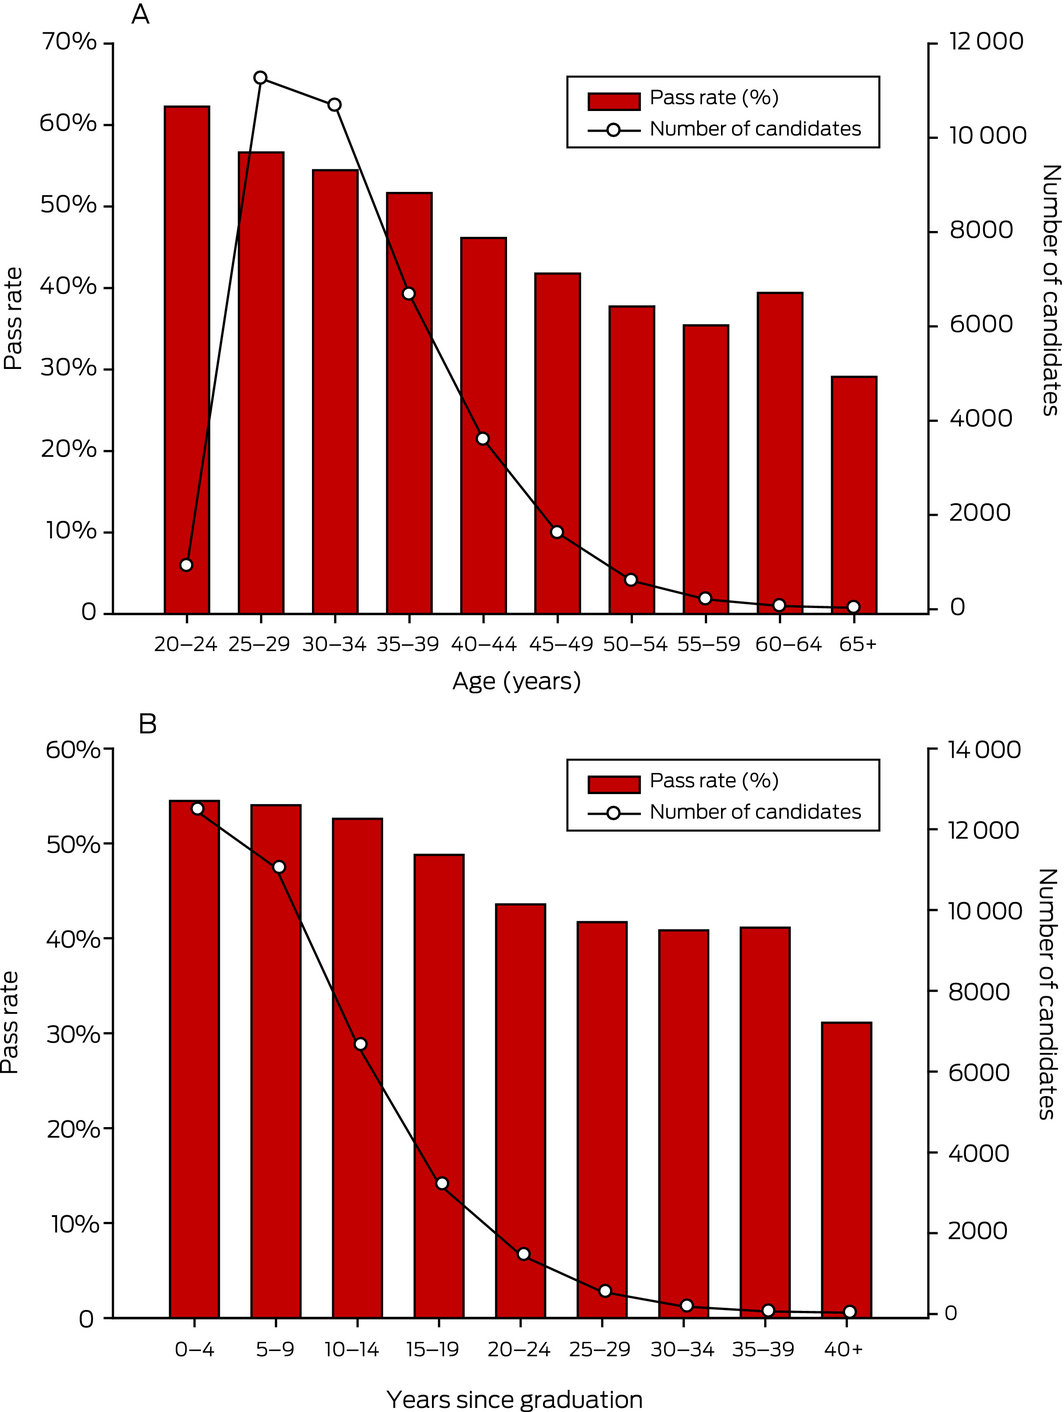
Spearman rank order correlation: (A) r = −0.964, P < 0.001; (B) r = −0.983, P < 0.001.
Competing interests
No relevant disclosures.
Acknowledgements
We acknowledge the assistance of Kevin Ng and Prathyusha Sama, Senior Computer Programmer and Software Developer at the AMC, for programming to extract the de‐identified data analysed in this article.
References
- Medical Board of Australia. Competent authority pathway [website]. AHPRA, 2019. https://www.medicalboard.gov.au/Registration/International-Medical-Graduates/Competent-Authority-Pathway.aspx (viewed July 2020).
- Australian Government Publishing Service. Human Rights and Equal Opportunity Commission — annual report 1990–91. Canberra: Commonwealth of Australia; 1991. https://humanrights.gov.au/sites/default/files/Annual_Report_90-91.pdf (viewed July 2020).
- Australian Competition and Consumer Commission and Australian Health Workforce Officials’ Committee. Review of Australian specialist medical colleges: report to Australian Health Ministers. Canberra: Commonwealth of Australia, 2005.
- House of Representatives Standing Committee on Health and Ageing. Lost in the labyrinth: report on the inquiry into registration processes and support for overseas trained doctors. Canberra: Commonwealth of Australia, 2012. https://www.aph.gov.au/Parliamentary_Business/Committees/House_of_Representatives_Committees?url=haa/overseasdoctors/report.htm (viewed July 2020).
- Geffen L. Assuring medical standards: the Australian Medical Council 1985–2010. Canberra, ACT: Australian Medical Council, 2010.
- Australian Medical Council Limited. IMG guides. https://www.amc.org.au/publications/img-guides/ (viewed July 2020).
- United Nations Statistics Division. Geographical regions 1999. https://unstats.un.org/unsd/methodology/m49 (viewed July 2020).
- Australian Bureau of Statistics. Migration, Australia, 1993–2018 [Cat. No. 3412.0]. Canberra, ACT: ABS, 2018. https://www.abs.gov.au/AUSSTATS/abs@.nsf/DetailsPage/3412.02017-18?OpenDocument (viewed July 2020).
- Breen K, Frank I, Walters T. Australian Medical Council: a view from the inside. Intern Med J 2001; 31: 243–248.
- McCoubrie P. Improving the fairness of multiple‐choice questions: a literature review. Med Teach 2004; 26: 709–712.
- Yeomans ND. They came to heal: Australia's medical immigrants, 1960 to the present [dissertation]. Melbourne: University of Melbourne, 2018: 120.
- Dewhurst NG, McManus C, Mollon J, et al. Performance in the MRCP (UK) examination 2003–4: analysis of pass rates of UK graduates in relation to self‐declared ethnicity and gender. BMC Med 2007; 5: 8.
- Shellito JL, Osland JS, Helmer SD, Chang FC. American Board of Surgery examinations: can we identify surgery residency applicants and residents who will pass the examinations on the first attempt? Am J Surg 2010; 199: 216–222.
- Rubright JD, Jodoin M, Barone MA. Examining demographics, prior academic performance, and United States Medical Licensing Examination scores. Acad Med 2019; 94: 364–370.
- Unwin E, Potts HWW, Dacre J, et al. Passing MRCP (UK) PACES: a cross‐sectional study examining the performance of doctors by sex and country. BMC Med Educ 2018; 18: 1–9.
- Sandhu H, Adams A, Singleton L, et al. The impact of gender dyads on doctor–patient communication: A systematic review. Patient Educ Couns 2009; 76: 348–355.
- Menzies L, Minson S, Brightwell A, et al. An evaluation of demographic factors affecting performance in a paediatric membership multiple‐choice examination. Postgrad Med J 2015; 91: 72–76.
- Lipner R, Song H, Biester T, et al. Factors that influence general internists’ and surgeons’ performance on maintenance of certification exams. Acad Med 2011; 86: 53–58.
- McGrail MR, Russell DJ. Australia's rural medical workforce: supply from its medical schools against career stage, gender and rural‐origin. Aust J Rural Health 2016; 25: 298–305.
Provenance: Not commissioned; externally peer reviewed.
Designing Housing to Reduce Overcrowding-Related Harms: Rheumatic Heart Disease as the Canary in the Coal Mine
Simon Quilty, Veronica Matthews, Angus Baumann, James Marangou, Bo Remenyi, Gavin Wheaton, Serena Morton Nabanunga, Norman Frank Jupurrurla, Simon Robinson, Steve Mintern, Cary Duffield, Joshua R. Francis, Paul C. Memmott
Australian Climate Leadership in 2026: COP-Out or Step-Up for Health?
Catherine G. A. Pendrey, Angie Bone, Aletha Ward, Francis Nona, Michelle Isles, Paul M. Kelly, Nicholas J. Talley
The impact of the Breast Screen NSW transition from film to digital mammography, 2002–2016: a linked population health data analysis
Rachel Farber, Nehmat Houssami, Katy J L Bell
Shifting focus to adolescent wellbeing and inclusive participation in the digital age
Allyson R Todd, Elena Wang, Stephanie R Partridge
The CURE Asthma roadmap
Gary P Anderson, Anthony Flynn, Phil G Bardin, John D Blakey, Shyamali C Dharmage, Paul Foster, Peter G Gibson, Adam Jaffe, Alan James, Christine R Jenkins, Sundram Sivamalai, Peter D Sly, Guy B Marks, Vanessa M McDonald, Judy Wetttenhall
Protecting public interest journalism as a public health good
Bronwyn Fredericks, Neha Lalchandani, Melissa A Sweet, Alex Cramb, Carmel Williams