




Volume 222 - Issue 3
Bulk‐billing rates and out‐of‐pocket costs for general practitioner services in Australia, 2022, by SA3 region: analysis of Medicare claims data
Authors: Karinna Saxby and Yuting Zhang
Med J Aust 2025 || doi: 10.5694/mja2.52562
Published online: 27 January 2025
Published online: 27 January 2025
Out-of-pocket costs for non-bulk-billed services are particular high for people in remote and socio-economically disadvantaged areas of Australia
Abstract
Objectives: To examine bulk‐billing rates and out‐of‐pocket costs for non‐bulk‐billed general practitioner services in Australia at the Statistical Area 3 (SA3) level; to assess differences by area‐level socio‐economic disadvantage and remoteness.
Study design: Retrospective analysis of administrative data (Medicare claims data).
Setting, participants: All Medicare claims for non‐referred general practitioner services in Australia during the 2022 calendar year, as recorded in the Person Level Integrated Data Asset (PLIDA).
Main outcome measures: Mean proportions of general practitioner services that were bulk‐billed and mean patient out‐of‐pocket costs for non‐bulk‐billed general practitioner visits by SA3 region, adjusted for area‐level age and sex, both overall and by area‐level socio‐economic disadvantage (Index of Relative Socioeconomic Disadvantage quintile) and remoteness (simplified Modified Monash Model category).
Results: During 2022, 82% (95% confidence interval [CI], 80–83%) of general practitioner services in Australia were bulk‐billed; the mean out‐of‐pocket cost for non‐bulk‐billed visits was $43 (95% CI, $42–44). By SA3, mean bulk‐billing rates ranged between 46% and 99%, mean out‐of‐pocket costs for non‐bulk‐billed general practitioner visit between $16 and $99. Bulk‐billing rates were higher in regions in the most socio‐economically disadvantaged quintile (86%; 95% CI, 84–88%) than those in the least disadvantaged quintile (73%; 95% CI, 70–76%); the mean rate was not significantly different for remote (86%; 95% CI, 79–92%) and metropolitan areas (81%; 95% CI, 79–83%). Out‐of‐pocket costs for non‐bulk‐billed general practitioner services were higher in remote ($56; 95% CI, $46–66) than in metropolitan areas ($43; 95% CI, $42–44), and lower in areas in the most socio‐economically disadvantaged quintile ($42; 95% CI, $40–45) than in those in the least disadvantaged quintile ($47; 95% CI, $45–49).
Conclusion: Although most general practitioner services are bulk‐billed, out‐of‐pocket costs for non‐bulk‐billed services are relatively high, particularly for people in remote and socio‐economically disadvantaged areas of Australia.
The known: Out‐of‐pocket costs are an important determinant of health care access. Little has been published about regional variations in out‐of‐pocket costs for general practitioner care in Australia.
The new: In 2022, mean bulk‐billing rates by SA3 region (30000–130000 people) ranged from 46% to 99%. Mean out‐of‐pocket costs for non‐bulk‐billed general practitioner visits ranged from $16 to $99, and were higher in remote than metropolitan areas; the mean cost in many regions exceeded the level of bulk‐billing incentive payments.
The implications: Access to affordable general practitioner care in Australia varies by region. Recently introduced bulk‐billing incentives are unlikely to make primary care more affordable in metropolitan areas.
Affordable and equitable access to health care is a pillar of the Australian universal health care system,1 but out‐of‐pocket costs for patients comprise a substantial proportion of all health care spending.2 As the cost of living increases, concern is growing about the decline in bulk‐billing by general practitioners and the rise in out‐of‐pocket costs for non‐bulk‐billed services. Medicare subsidises fees for patients, but doctors set their own fees. Out‐of‐pocket payments (the gap between fee and Medicare rebate) consequently vary substantially between doctors.
Information about geographic variation in costs for general practitioner care is important because general practitioners are the main gatekeepers for health care in Australia. Further, variation by broad area‐level characteristics is important because people with lower incomes and those living in rural and remote areas are more likely to use general practitioner care than specialist care.3 Greater transparency in general practitioner fees, particularly at the small area level, would also inform people about the out‐of‐pocket costs they are likely to pay.
Geographic differences in out‐of‐pocket costs have been reported for specific Medicare‐subsidised services and conditions4 and for general practitioner services aggregated by geographic remoteness,5 or at the primary health network6 or state and territory levels.7 The federal government has increased price transparency for different types of health care services, including general practitioner services, at the primary health network level with its Medical Costs Finder.8 However, as it depends on providers reporting their own fees, the information provided by this tool has been limited. Area‐level information is crucial for informing people about the costs to expect in their communities, particularly as they are likely to seek care near where they live.9
To provide this information, we used newly available whole‐of‐population administrative data to derive rich, small area‐level information about costs in Australia. We examined bulk‐billing rates and out‐of‐pocket costs for non‐bulk‐billed general practitioner services at the Statistical Area 3 (SA3) level. We also explored differences in these outcomes by area‐level socio‐economic disadvantage and remoteness.
Methods
For our retrospective analysis, we used the Person Level Integrated Data Asset (PLIDA), an individual‐level, linked administrative dataset that includes information on Medicare claims and patient demographic characteristics for Australia.10 Given administrative delays in claims processing, we analysed data for claims reported during the 2022 calendar year, the most recent year for which claims data were complete at the time of our analysis. We extracted data for all claims for all non‐referred general practitioner attendances based on Broad Type of Service category 101.11 Claims data include information on whether a service was bulk‐billed (that is, the total service cost is covered by Medicare), the postcode in which the service was provided, the fee charged by the provider, and the benefit paid by Medicare. The out‐of‐pocket cost for non‐bulk‐billed services was calculated by subtracting the Medicare benefit paid from the provider fee; all costs were inflated to 2024 dollars using the consumer price index.12 Using the linked demographic information in PLIDA, we then calculated the number of services, the number of bulk‐billed services, and the mean out‐of‐pocket costs per non‐bulk‐billed service for each postcode, age group (0–15, 16–40, 40–65, 65 years or older), and sex (male, female).
We generated weighted means at the SA3 level (the smallest spatial level permitted by data custodians and PLIDA user agreements) using 2021 Australian Bureau of Statistics correspondences.13 SA3 regions include populations of 30000–130000 people, and include clusters of related suburbs in larger cities and regional towns, and their larger surrounding areas in less densely populated parts of Australia.14 We excluded all SA3 regions with an effective design population of zero (for example, large national parks) and, in accordance with PLIDA use agreements, all SA3s with fewer than ten general practitioner services. We calculated the mean proportion of bulk‐billed services and the mean out‐of‐pocket costs per non‐bulk‐billed general practitioner service in each SA3 region. Given the substantial differences in the case mix of services in different regions, we adjusted for differences in general practitioner service use by age group (0–15, 16–40, 40–65, 65 years or older) and sex (male, female) (Supporting Information, table 1). We depict these differences in SA3‐level maps by level quartiles for each outcome. Using the Greater Capital City Statistical Area correspondences,13 we also provide separate maps for Greater Melbourne, Greater Adelaide, Greater Brisbane, Greater Perth, Greater Sydney, Greater Darwin, Greater Hobart, and the Australian Capital Territory.
We linked SA3‐level outcomes information with classification by remoteness and area‐level socio‐economic resources. For remoteness, we used three categories based on those of the Modified Monash Model (MMM):15 metropolitan, including metropolitan areas (MMM1) and regional centres (MMM2); rural, including large rural towns (MMM3), medium rural towns (MMM4), and small rural towns (MMM5); and remote, including remote communities (MMM6) and very remote communities (MMM7). Area‐level socio‐economic resource status was based on the 2021 SA3‐level Socioeconomic Indexes for Areas (SEIFA) Index of Relative Socioeconomic Disadvantage (IRSD),16 by quintile.
We separately compared outcomes (bulk‐billing rates and out‐of‐pocket costs for non‐bulk‐billed services) by SA3‐level characteristics (IRSD quintile and remoteness category); the statistical significance of differences was assessed in Wald tests. All analyses were completed in Stata 17.
Ethics approval
The University of Melbourne Research Ethics Committee approved this study (project reference, 12519).
Results
Bulk‐billing rates and out‐of‐pocket costs for non‐bulk‐billed general practitioner visits, by SA3 level
Mean bulk‐billing rates by SA3 level are shown in Box 1 and Supporting Information, table 2; mean out‐of‐pocket costs for non‐bulk‐billed general practitioner services are shown in Box 2 and Supporting Information, table 2. Overall, 82% (95% confidence interval [CI], 80–83%) of general practitioner services were bulk‐billed; the mean out‐of‐pocket cost for non‐bulk‐billed visits was $43 (95% CI, $42–44). The bulk‐billing rate was lowest in South Canberra (46%) and highest in St Marys (New South Wales) and Daly–Tiwi–West Arnhem (Northern Territory), where 99% of general practitioner services were bulk‐billed. Mean out‐of‐pocket costs for non‐bulk‐billed general practitioner visits were lowest in Mount Druitt (NSW; $16 per non‐bulk‐billed visit) and highest in Bourke–Cobar–Coonamble (NSW; $99 per non‐bulk‐billed visit).
Bulk‐billing rates and out‐of‐pocket costs, by SA3‐level socio‐economic disadvantage quintile
Bulk‐billing rates and out‐of‐pocket costs for non‐bulk‐billed general practitioner services by SA3‐level socio‐economic disadvantage quintile are shown in Box 3. Mean bulk‐billing rates were higher in regions in the most socio‐economically disadvantaged quintile (86%; 95% CI, 84–88%) than in those in the least socio‐economically disadvantaged quintile (73%; 95% CI, 70–76%; mean difference, 13 [95% CI, 10–16] percentage points) (Supporting Information, table 3).
Mean out‐of‐pocket costs for non‐bulk‐billed general practitioner services were lower in SA3 regions in the most socio‐economically disadvantaged quintile ($42 [95% CI, $40–45] per visit) than in those in the least socio‐economically disadvantaged quintile ($47 [95% CI, $45–49] per visit; mean difference, $4.82 [95% CI, $2.15–7.50]) (Supporting Information, table 3).
Bulk‐billing rates and out‐of‐pocket costs, by SA3‐level remoteness category
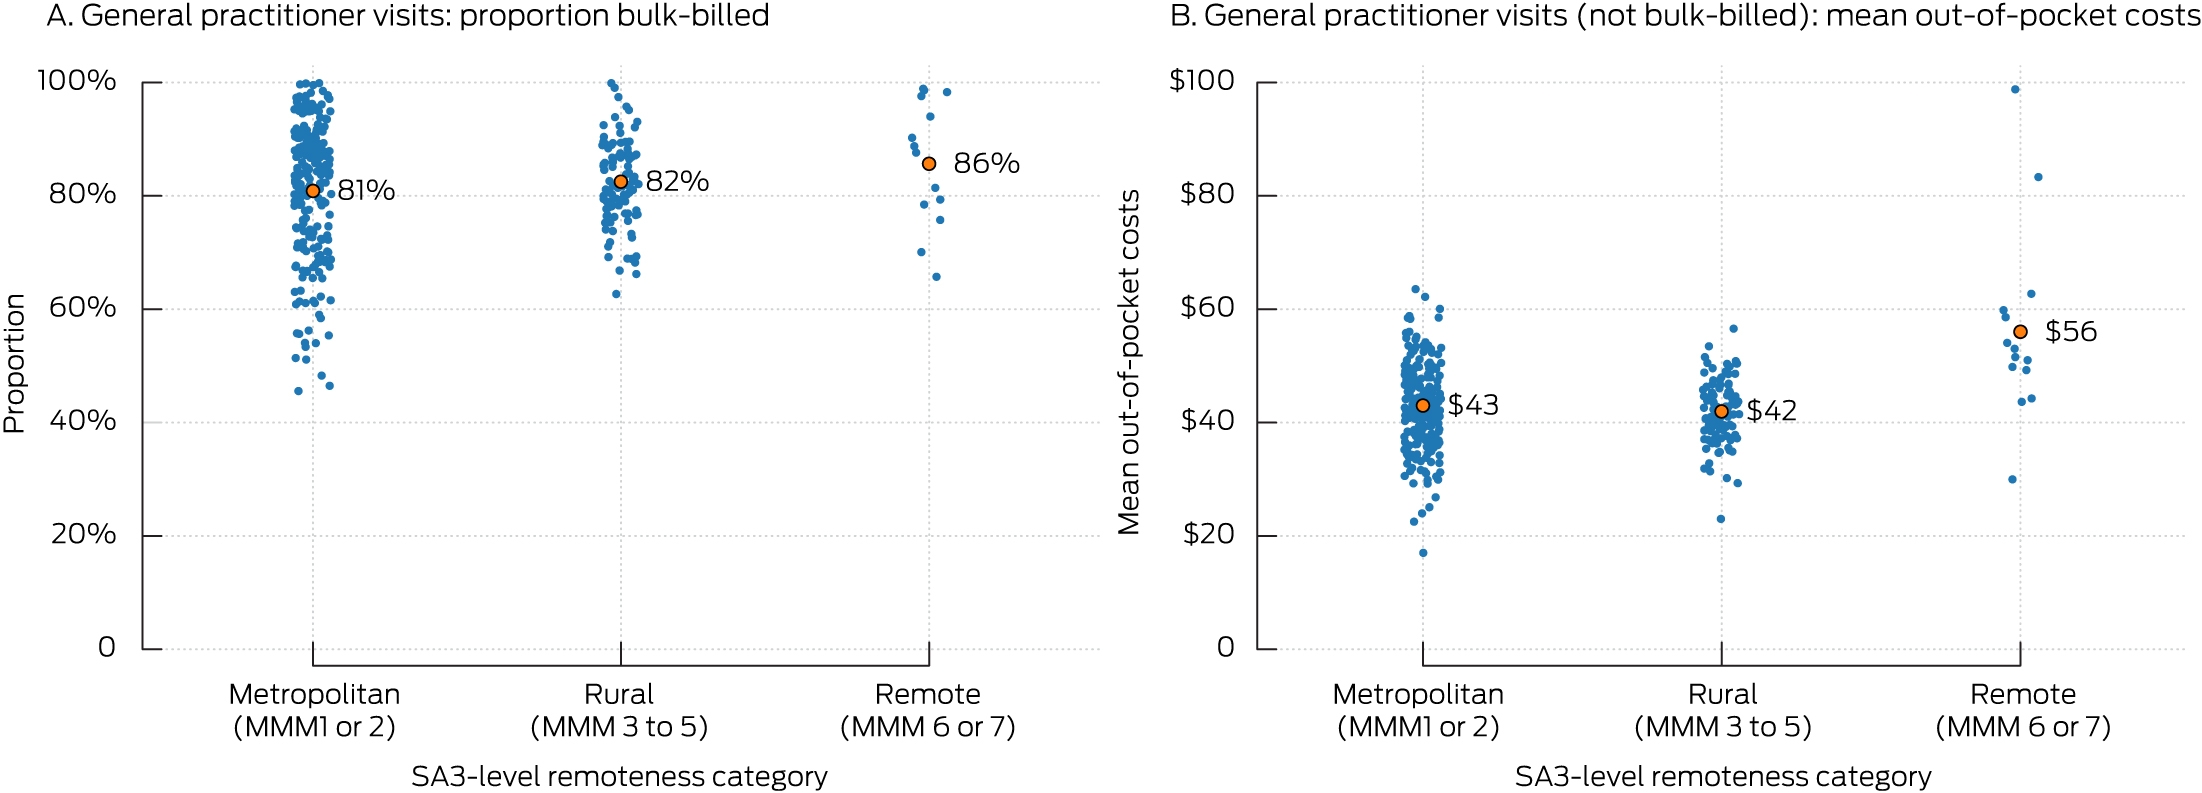
Bulk‐billing rates and out‐of‐pocket costs for non‐bulk‐billed general practitioner services by SA3‐level remoteness category are shown in Box 4. The mean bulk‐billing rate was not significantly different in remote (86%; 95% CI, 79–92%) and metropolitan regions (81%; 95% CI, 79–83%; mean difference, 5 [95% CI, −1 to 11] percentage points) (Supporting Information, table 4).
The mean out‐of‐pocket cost for non‐bulk‐billed general practitioner services was higher in remote regions ($56; 95% CI, $46–66) than in metropolitan regions ($43; 95% CI, $42–44; mean difference, $13.33; 95% CI, $9.14–17.51) (Supporting Information, table 4).
Discussion
We examined the distribution of bulk‐billing and out‐of‐pocket costs for general practitioner services in Australia by SA3 region. We found that bulk‐billing rates are generally high, but they differed considerably between regions. It is reassuring that mean bulk‐billing rates are higher in the most socio‐economically disadvantaged regions (86%) than in the least disadvantaged regions (73%). However, mean out‐of‐pocket costs for non‐bulk‐billed services are considerable, do not vary substantially by area‐level disadvantage, and are highest for people in remote areas.
Our findings have important policy implications. First, the substantial differences in out‐of‐pocket costs could indicate inequitable access to health care. In particular, our findings are concerning because Australians in rural and socio‐economically disadvantaged areas have poorer health outcomes, lower access to and use of primary health care, and higher rates of potentially preventable hospitalisations than other Australians.17 As we found that out‐of‐pocket costs for non‐bulk‐billed general practitioner services did not differ markedly by area‐level disadvantage, and that they are in fact higher in remote areas, our findings are consistent with other reports that people in remote and socio‐economically disadvantaged areas are likely to spend larger proportions of their income on out‐of‐pocket fees for health care than other people.2
To reduce out‐of‐pocket primary care costs for patients, the Australian Department of Health increased bulk‐billing incentives for general practitioners in rural and remote areas in January 2022,18 then tripled the incentive payments in November 2023.19 These incentives are explicitly for general practitioner care for Commonwealth concession card holders and children, and are 50–90% higher for general practitioners practising in rural regions than for those in metropolitan areas. For example, metropolitan general practitioners now receive a $20.65 bonus for bulk‐billing a concession card holder or child under 16 years of age; general practitioners in rural and remote areas receive $31.35 to $39.65. We found that people pay a mean $43 in out‐of‐pocket costs for non‐bulk‐billed general practitioner visits in Australia, more than the bonus for bulk‐billing. The current incentives are therefore unlikely to be sufficient for reducing out‐of‐pocket costs, particularly for people in metropolitan areas.
Further, given the large differences between regions in fees for general practice consultations, the 2023 incentive payments could have unintended consequences. In areas where the bonuses are higher than local fees, they could drive up fees and even lead to higher out‐of‐pocket costs for people not covered by the incentive program. As an alternative, the government could reduce bonus payments to the local fee level in rural and remote areas and redistribute the money saved to ensure that people with lower incomes and children receive free general practitioner care, regardless of where they live.20 As financial incentives for specific patient groups (instead of regions) reduce differences in primary health care use,21 they could also be used to help other priority groups, including Indigenous people and people living with disability or long term health conditions.22
Our findings also have a practical application. Based on whole‐of‐population claims data, our findings supplement and improve upon the spatial information provided by the Medical Costs Finder about the cost of general practitioner services.8 Decision makers can use our approach to monitor differences between regions and people can use our findings to inform themselves about local costs. However, price transparency tools have had mixed success with respect to reducing patient out‐of‐pocket costs.23 While people may alter their choice of health care provider to receive less expensive services, the uptake and use of these tools is generally low because the search effort required is too great.23 Nevertheless, reducing information asymmetry could create a better environment in which people could discuss costs with providers. Using administrative data to routinely provide this information is highly feasible, and could be updated as new claims data become available. Should such transparency tools be introduced, the efficacy of price transparency on out‐of‐pocket costs in Australia will need to be investigated.
Limitations
First, our analyses did not take care complexity or patient needs into account; for example, people in remote areas are likely to have more complex health problems, and general practitioners consequently charge higher fees in these area.24 The limited supply of general practitioners in these regions may also lead to higher fees.25 Second, our analysis did not examine bulk‐billing rates or out‐of‐pocket costs for different types of general practitioner services (eg, levels A–E) or specialist care. The fees charged by specialists are substantially higher than those of general practitioners and are much more variable.26 Finally, our analyses are based on the total number of all general practitioner visits, not the proportion of patients who are always bulk‐billed. Broader patient‐, provider‐, and system‐level factors that affect fees should be investigated, including personal income and other health conditions, practice costs and size, perceived competition, and practitioner experience and skill level.27,28 Nevertheless, the large differences between SA3 regions after adjustment for age and sex suggest that a proportion of the variation in fees is probably unwarranted. Robust patient‐, provider‐, and practice‐level information, including information about patient–general practitioner encounters, will be required to investigate this question.
Conclusion
Out‐of‐pocket costs are an important determinant of access to health care. Although most general practitioner services in Australia are bulk‐billed, out‐of‐pocket costs for non‐bulk‐billed services are relatively high, particularly in remote and socio‐economically disadvantaged areas. Recent Medicare strategies for increasing bulk‐billing rates are unlikely to reduce out‐of‐pocket costs for people living in metropolitan areas not already receiving bulk‐billed care.
Box 1 – General practice services bulk‐billing rate, Australia, 2022, mean values by Statistical Area level 3 (SA3)*
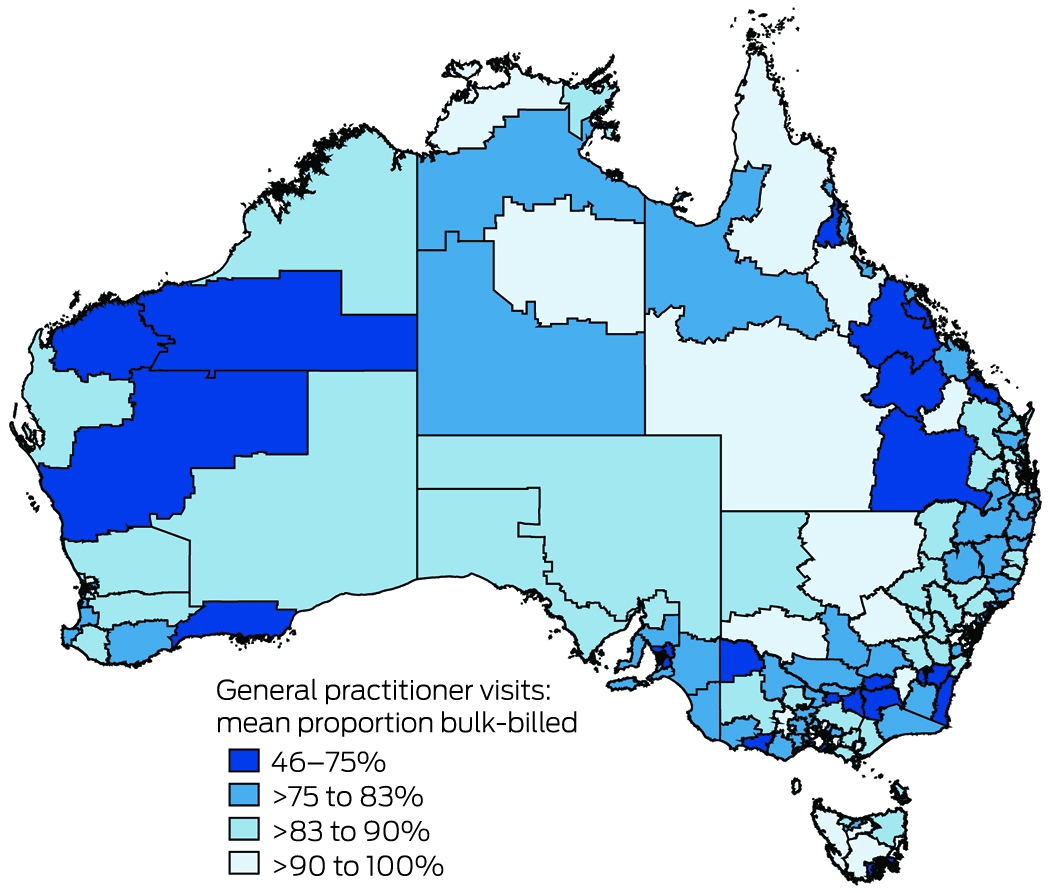
* By quartile, adjusted by age group (0–15, 16–40, 40–65, 65 years or older) and sex (male, female). Maps for the eight capital cities are included in the Supporting Information, figure 1.
Box 2 – Out‐of‐pocket costs for non‐bulk‐billed general practitioner services, Australia, 2022, mean values by Statistical Area level 3 (SA3)*
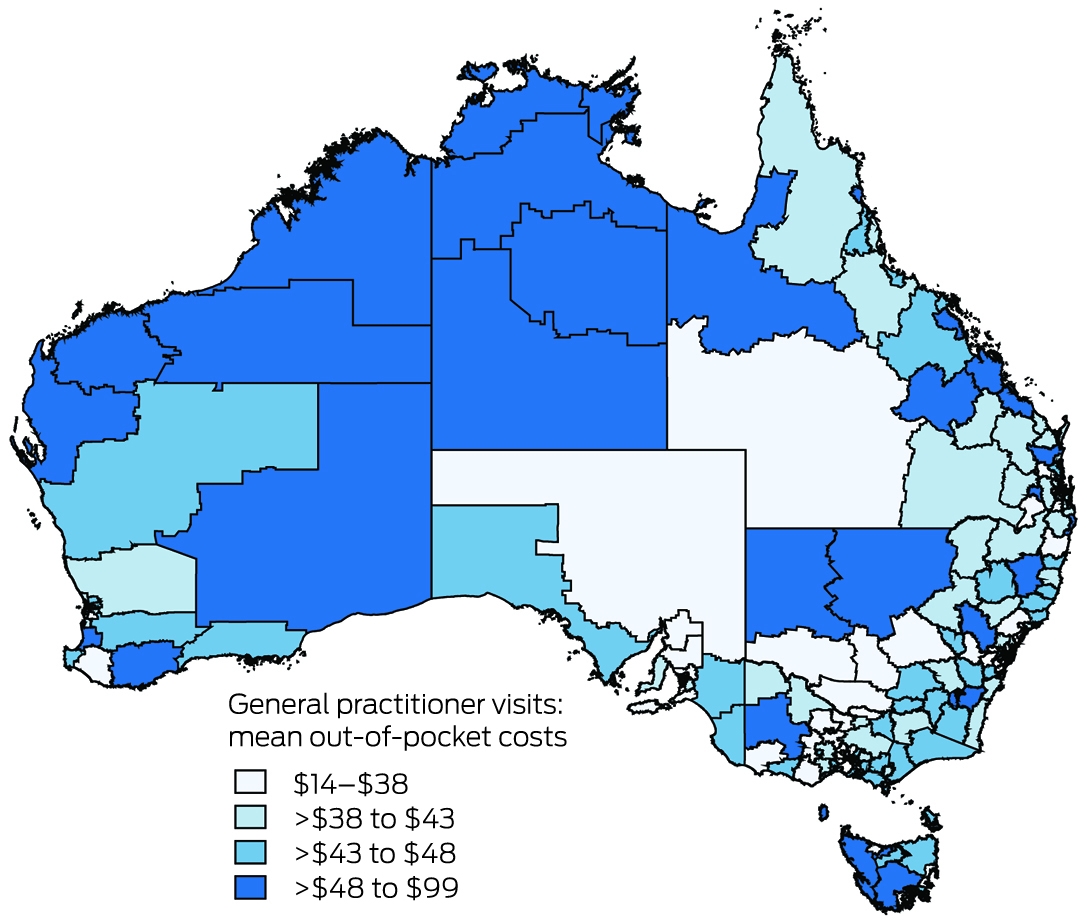
* By quartile, adjusted by age group (0–15, 16–40, 40–65, 65 years or older) and sex (male, female). Maps for the eight capital cities are included in the Supporting Information, figure 2. Costs are reported as 2024 dollars.
Box 3 – Bulk‐billing rates and out‐of‐pocket costs, Australia, 2022, by SA3‐level socio‐economic disadvantage quintile*
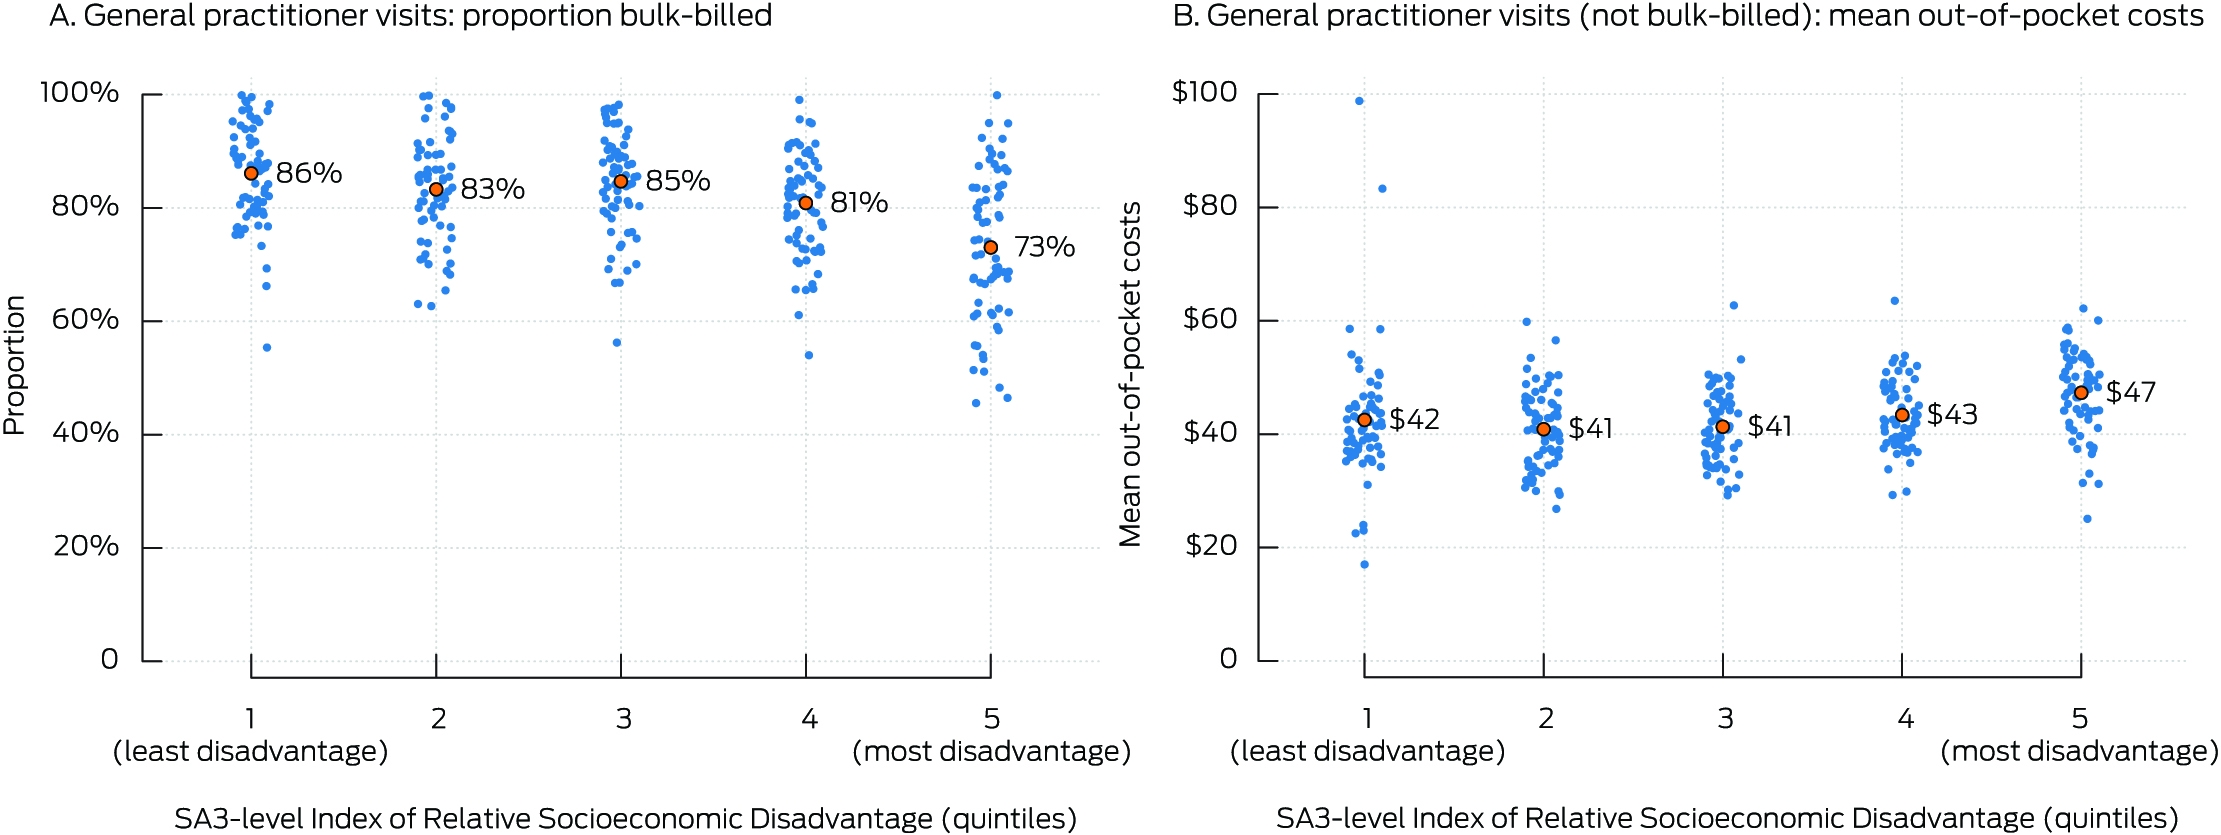
* Adjusted by age group (0–15, 16–40, 40–65, 65 years or older) and sex (male, female). Costs in panel B are reported as 2024 dollars. Red dot: mean value. [Correction added on 20 December 2024, after first online publication: Image in Box has been replaced.]
Competing interests
No relevant disclosures.
Acknowledgements
We thank the Australian Bureau of Statistics microdata team for their tireless vetting and assistance. We also thank Susan Mendez (Melbourne Institute, University of Melbourne), Dennis Petrie (Centre for Health Economics, Monash University), and the participants of the Medicare at 40 Event (Canberra. 19 February 2024) for useful feedback and suggestions. Yuting Zhang holds an Australian Research Council Australian Future Fellowship (FT200100630).
References
- Australian Department of Health and Aged Care. About Medicare. Updated 27 Sept 2023. https://www.servicesaustralia.gov.au/about‐medicare?context=60092 (viewed May 2024).
- Carpenter A, Islam MM, Yen L, McRae I. Affordability of out‐of‐pocket health care expenses among older Australians. Health Policy 2015; 119: 907–914.
- Van Doorslaer E, Clarke P, Savage E, Hall J. Horizontal inequities in Australia's mixed public/private health care system. Health Policy 2008; 86: 97–108.
- Liu D, Yu S, Webster SB, et al. Geographic variation in out‐of‐pocket costs for radiation oncology services. Med J Aust. 2023; 218: 315–319. https://www.mja.com.au/journal/2023/218/7/geographic‐variation‐out‐pocket‐costs‐radiation‐oncology‐services
- Young AF, Dobson AJ. The decline in bulk‐billing and increase in out‐of‐pocket costs for general practice consultations in rural areas of Australia, 1995–2001. Med J Aust 2003; 178: 122–126. https://www.mja.com.au/journal/2003/178/3/decline‐bulk‐billing‐and‐increase‐out‐pocket‐costs‐general‐practice
- Callander E, Larkins S, Corscadden L. Variations in out‐of‐pocket costs for primary care services across Australia: a regional analysis. Aust J Prim Health 2017; 23: 379–385.
- Ong GS, Lee SJ, Radeski D. Variation in outpatient consultant physician fees in Australia by specialty and state and territory. Med J Aust 2017; 207: 176–180. https://www.mja.com.au/journal/2017/206/4/variation‐outpatient‐consultant‐physician‐fees‐australia‐specialty‐and‐state‐and
- Australian Department of Health and Aged Care. Medical Costs Finder. Updated 1 May 2024. https://www.health.gov.au/resources/apps‐and‐tools/medical‐costs‐finder (viewed May 2024).
- Saxby K. Healthcare use in disadvantaged groups [thesis, Monash University]. 7 July 2023. https://bridges.monash.edu/articles/thesis/Healthcare_use_in_disadvantaged_groups/23640795 (viewed May 2024).
- Australian Bureau of Statistics. Person Level Integrated Data Asset (PLIDA). Undated. https://www.abs.gov.au/about/data‐services/data‐integration/integrated‐data/person‐level‐integrated‐data‐asset‐plida (viewed May 2024).
- Duckett S, Stobart A, Lin L. Not so universal: how to reduce out‐of‐pocket healthcare payments: Grattan Institute, 6 Mar 2022. https://grattan.edu.au/report/not‐so‐universal‐how‐to‐reduce‐out‐of‐pocket‐healthcare‐payments (viewed May 2024).
- Australian Bureau of Statistics. Consumer price index, Australia, March quarter 2024 (here: data downloads, tables 1 and 2). 24 Apr 2024. https://www.abs.gov.au/statistics/economy/price‐indexes‐and‐inflation/consumer‐price‐index‐australia/mar‐quarter‐2024#data‐downloads (viewed May 2024).
- Australian Bureau of Statistics. Australian Statistical Geography Standard (ASGS) edition 3, July 2021 – June 2026. 27 July 2021. https://www.abs.gov.au/statistics/standards/australian‐statistical‐geography‐standard‐asgs‐edition‐3/latest‐release (viewed May 2024).
- Australian Institute of Health and Welfare. Region types. Updated 1 Dec 2023. https://www.rific.gov.au/resources/region‐types(viewed May 2024).
- Department of Health and Aged Care. Modified Monash Model. Updated 4 Nov 2024. https://www.health.gov.au/topics/rural‐health‐workforce/classifications/mmm (viewed Nov 2024).
- Australian Bureau of Statistics. 2021. Index of Relative Socio‐economic Disadvantage (IRSD). In: Socio‐Economic Indexes for Areas (SEIFA), Australia, 2021. 27 Apr 2023. https://www.abs.gov.au/statistics/people/people‐and‐communities/socio‐economic‐indexes‐areas‐seifa‐australia/latest‐release#index‐of‐relative‐socio‐economic‐disadvantage‐irsd‐ (viewed May 2024).
- Phillips A. Health status differentials across rural and remote Australia. Aust J Rural Health 2009; 17: 2–9.
- Australian Department of Health and Aged Care. Rural bulk billing incentives. Updated 17 Dec 2021. https://www.health.gov.au/resources/publications/rural‐bulk‐billing‐incentives‐changes (viewed May 2024).
- Australian Department of Health and Aged Care. Increases to Bulk Billing Incentive Payments. Updated 6 Feb 2024. https://www.health.gov.au/our‐work/increases‐to‐bulk‐billing‐incentive‐payments (viewed May 2024).
- Zhang Y. How can the Australian government make primary care and private health insurance more affordable? Aust Econ Rev 2024; 57: 174–178.
- Saxby K, Byrnes J, de New SC, et al. Does affirmative action reduce disparities in healthcare use by Indigenous peoples? Evidence from Australia's Indigenous Practice Incentives Program. Health Econ 2023; 32: 853–872.
- Saxby K, Stephens M. Medicare and priority populations: structural and place‐based considerations for Aboriginal and Torres Strait Islander peoples and LGBTIQ+ Australians. Aust Econ Rev 2024; 57: 149–159.
- Zhang A, Prang KH, Devlin N, et al. The impact of price transparency on consumers and providers: a scoping review. Health Policy 2020; 124: 819–825.
- McRae I, Yen L, Jeon YH, et al. Multimorbidity is associated with higher out‐of‐pocket spending: a study of older Australians with multiple chronic conditions. Aust J Prim Health 2013; 19: 144–149.
- Gravelle H, Scott A, Sivey P, Yong J. Competition, prices and quality in the market for physician consultations. J Ind Econ 2016; 64: 135–169.
- Johar M, Mu C, Van Gool K, Wong CY. Bleeding hearts, profiteers, or both: specialist physician fees in an unregulated market. Health Econ 2017; 26: 528–535.
- O'Sullivan BG, Kippen R, Hickson H, Wallace G. Mandatory bulk billing policies may have differential rural effects: an exploration of Australian data. Rural Remote Health 2022; 22: 7138.
- Johar M. Do doctors charge high income patients more? Econ Lett 2012; 117: 596–599.
Medical Colleges Have an Obligation to Ensure Full Participation in Clinical Quality Registries
Thomas J. Hugh
Getting on the Same Page: Why Australia Needs a National Maternity Early Warning System (MEWS) Chart
Briony A. Cutts, Lucy Bowyer, Nisha Khot, Sandra Lowe, Stefan C. Kane
Data for Equity: Can Linked Administrative Data Inform Pathways to More Equitable Child Health?
Sarah Gray, Shuaijun Guo, Meredith O'Connor, Elodie O'Connor, Katrina Williams, Hannah Badland, Susan Woolfenden, Josie Dickerson, Gerry Redmond, Marnie Downes, Sharon R. Goldfeld
Specialty College Selection: Why Change is Critical to Support a Future Rural Workforce
Matthew R. McGrail, Jenny May AM, Katherine Logan
Differentiated and simplified oral HIV pre‐exposure prophylaxis (PrEP) models hold the key to virtually eliminating HIV transmission in Australia by 2030
Tyson Arapali, Sarah Warzywoda, Anthony K J Smith, Curtis Chan, Timothy R Broady, Erin Sullivan, Catherine MacPhail, Mohamed A Hammoud, Alexander Dowell‐Day, Benjamin R Bavinton
The number of cancer‐related deaths that could be attributable to spatial disparities in survival in Australia, 2010–2019: a retrospective population‐based cohort study
Charlotte K Bainomugisa, Jessica Cameron, Paramita Dasgupta, Peter Baade