


The known: Out‐of‐pocket treatment costs for patients have been investigated for people in individual states or with specific cancers. Little is known about variation in out‐of‐pocket costs by location.
The new: Although radiotherapy costs for most patients are moderate, particularly where bulk‐billing rates are strong, some incur very high out‐of‐pocket costs that vary markedly both between and within geographic areas.
The implications: Radiation oncology should be affordable for everyone who needs treatment.
Radiation oncology is a vital component of cancer treatment that improves clinical outcomes for many patients.1 Recent advances have improved the ability to image, target, and safely treat tumours, but at greater cost.1
The increasing cost of radiation oncology has drawn the attention of policy makers.2 A variety of factors are involved, but increases in service fees are a major determinant.3 Radiation oncology services in Australia are characterised by a mix of public and private financing and provision. The Australian government financially supports radiation oncology with Medicare Benefits Schedule (MBS) rebates, the Medicare safety net, and funding for radiation oncology treatment equipment. MBS‐subsidised services are reimbursed on a fee‐for‐service basis, but the fees charged by privately practising doctors are largely unregulated, including fees for services subsidised by the MBS with a fixed rebate per service.
As private health insurance does not cover the cost of out‐of‐hospital services (about 90% of radiation oncology episodes), patients must pay the gap between the provider fee and the MBS rebate (the out‐of‐pocket cost). A key protection against high out‐of‐pocket costs in Australia is the Extended Medicare Safety Net (EMSN), introduced in 2004. The EMSN covers 80% of out‐of‐pocket costs for Medicare services for general patients once an annual threshold is reached (January 2023: $2414 per calendar year).4
Increases in provider fees increase patient co‐payments as well as on government costs; for example, it has been reported that specialists raise their fees when they know that patients would recoup their costs via the EMSN.5 However, the magnitude of the impact on patient out‐of‐pocket costs has not been explored.
Australian studies have examined out‐of‐pocket costs for people in particular states or with specific cancers.6,7,8,9,10,11 A recent systematic review found that mean out‐of‐pocket costs for people with cancer diagnoses in Australia ranged from $977 for breast cancer to $11 077 for prostate cancer.12 Out‐of‐pocket costs, the financial burden, or both were higher for people under 65 years of age, Aboriginal and Torres Strait Islander people, residents of rural or remote areas, those with a low household income or unemployed, and people with private health insurance.12
Out‐of‐pocket costs often surprise patients because of poor disclosure of costs prior to treatment13 and variation in the extent to which they are made aware of no or low cost treatment options. This problem has led to increased attention by medical colleges to including financial information when obtaining consent for treatment, the development of government cost calculators,14 and voluntary standards of informed financial consent that help patients understand the costs of treatment.15
In this article, we describe our investigation of out‐of‐pocket costs incurred by patients for radiation oncology services and their variation by geographic location.
Method
We analysed data for the period 1 January 2006 – 31 December 2017 collected by the Sax Institute for their 45 and Up Study. The 267 357 New South Wales residents participating in this study, recruited from a random sample of the Medicare enrolment database and comprising about 19% of NSW residents aged 45 years or more in 2006, completed baseline questionnaires between 1 July 2005 and 31 December 2009.16 The survey collected detailed demographic data and information on the socio‐economic status and health of participants, including diagnosed conditions, medications used, and health behaviours. The NSW Centre for Health Record Linkage (CHeReL) used probabilistic linkage methods to link 45 and Up Study data with a variety of administrative claims datasets, including MBS data supplied to the Sax Institute by Services Australia. The linked data was made available only for use within the Secure Unified Research Environment (SURE, https://www.saxinstitute.org.au/solutions/sure).
We restricted our analysis to out‐of‐hospital radiotherapy and associated services subsidised by the MBS during 2006–2017. MBS data do not capture contributions by private health insurers for services received during inpatient hospital admissions. The unit of analysis was an episode of radiation oncology care. The start of the episode was defined by an index event (MBS radiotherapy planning item), and its duration includes follow‐up care during the following 90 days. Out‐of‐pocket costs were defined as the difference between fees charged by the provider during the episode of care and the amount covered by the MBS. We included all radiotherapy‐related MBS claims (planning, treatment, verification services) and consultations with radiation oncologists. For each of the included geographic areas, radiotherapy treatment comprised at least 97% of all services delivered during included episodes of care. All monetary values were indexed to the 2016–17 financial year using the Australian Bureau of Statistics consumer price index.17
Our analysis included 25 of 27 geographic areas in which radiation oncology services were provided in NSW during 2006–2017; two areas were excluded from our analysis because fewer than ten relevant episodes were recorded during the study period. Each geographic area was defined by the postcode of the treating centre; some postcodes included more than one treatment centre. Treating centre characteristics (location, public or private ownership) were obtained from the Department of Health and Aged Care website.18 The socio‐economic status of each postcode was defined according to the Socio‐Economic Indexes for Areas (SEIFA) Socioeconomic Index of Relative Socioeconomic Disadvantage (IRSD), by quintile (1, greatest socio‐economic disadvantage; 5, least socio‐economic disadvantage).19 Geographic remoteness was defined according to the Australian Standard Geographical Classification as major city or other.20 People who received care at multiple centres were assigned to the centre providing the first treatment service.
We categorised the mean out‐of‐pocket cost per episode for a geographic area as less than $1, $1 to $500, and more than $500. We calculated the proportion of radiotherapy episodes of care that were bulk‐billed and the mean out‐of‐pocket costs per episode for each year. Finally, we explored variation in out‐of‐pocket cost per episode by aggregating episode level data by postcode. All analyses were undertaken in Stata 17.
Ethics approval
The 45 and Up Study was approved by the University of New South Wales Human Research Ethics Committee (HC210602). Our study was approved by the University of Technology Sydney Human Research Ethics Committee (ETH18‐2507) and the New South Wales Population and Health Services Research Ethics Committee (2020/ETH02894: Value‐Based Payments in Healthcare).
Results
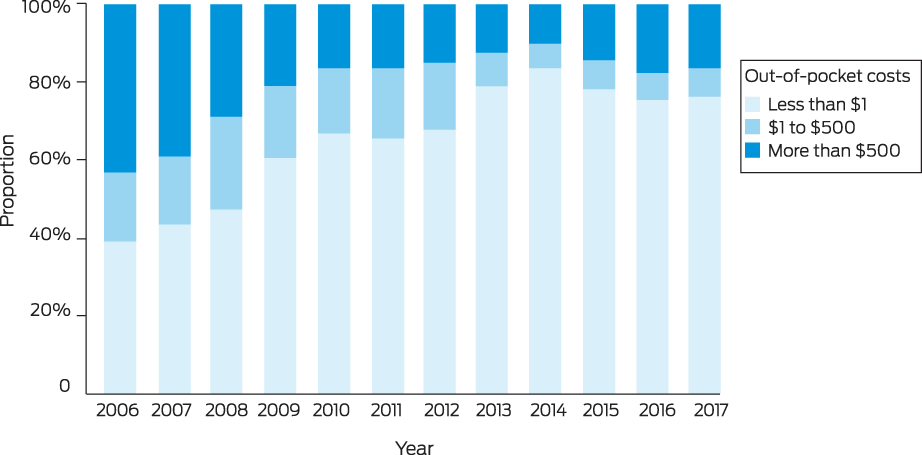
During 2006–2017, 12 724 people received 15 506 episodes of radiation oncology care in 25 postcode‐defined geographic areas of NSW. The proportion of episodes for which the out‐of‐pocket cost was less than $1 increased from 39% in 2006 to 76% in 2017; the proportion for which out‐of‐pocket costs exceeded $500 declined from 43% in 2006 to 10% in 2014, before rising to 17% in 2017 (Box 1).
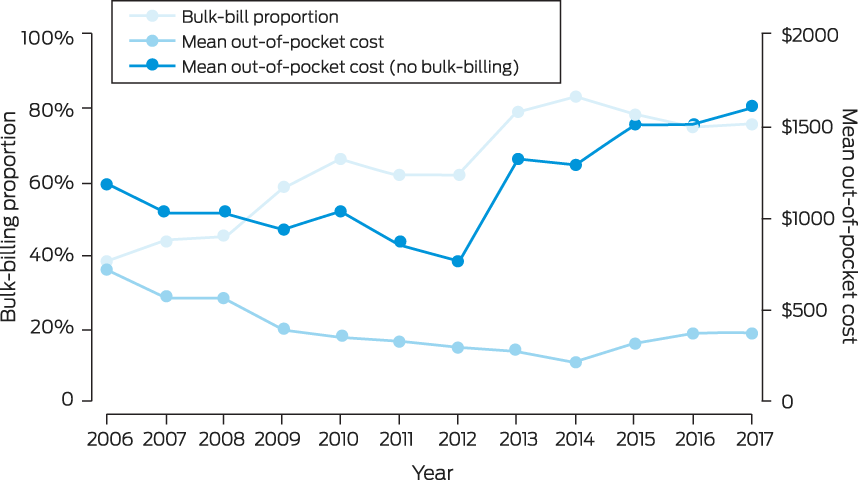
The proportion of care episodes that were bulk‐billed rose from 39% in 2006 to 76% in 2017. The mean out‐of‐pocket cost declined from $728 to $383 over the same period; excluding episodes without out‐of‐pocket costs, the mean out‐of‐pocket cost rose from $1186 to $1611 per episode (Box 2).
Only two areas were included in the lowest IRSD quintile (greatest socio‐economic disadvantage), five were in areas of least disadvantage (IRSD quintile 5); the mean out‐of‐pocket cost per episode was generally lower in areas of greater socio‐economic disadvantage. Sixteen of the 25 areas were within major cities. Radiology care was exclusively provided by private providers in eight areas, including the six where mean out‐of‐pocket costs per episode were highest (Box 3).
The fees charged for 67 492 of the 509 127 services subsidised by the MBS (13.3%) were within $1 of the MBS schedule fee; 2831 of 15 506 care episodes (18.3%) included at least one of these items. The MBS schedule fee, the reference price suggested by Medicare, is generally associated with a Medicare rebate of 85%; in our analysis, these episodes have not been treated as bulk‐billed services. The proportion of radiation oncology episodes bulk‐billed exceed 90% in nine areas (including three with 100% bulk‐billing); in seven areas, all with exclusively private provision of radiation oncology, it was 21% or smaller. Mean out‐of‐pocket costs were correspondingly lower in areas with high bulk‐billing rates than in those with low rates, where the mean out‐of‐pocket cost lay between $422 and $1777 per episode (Box 3).
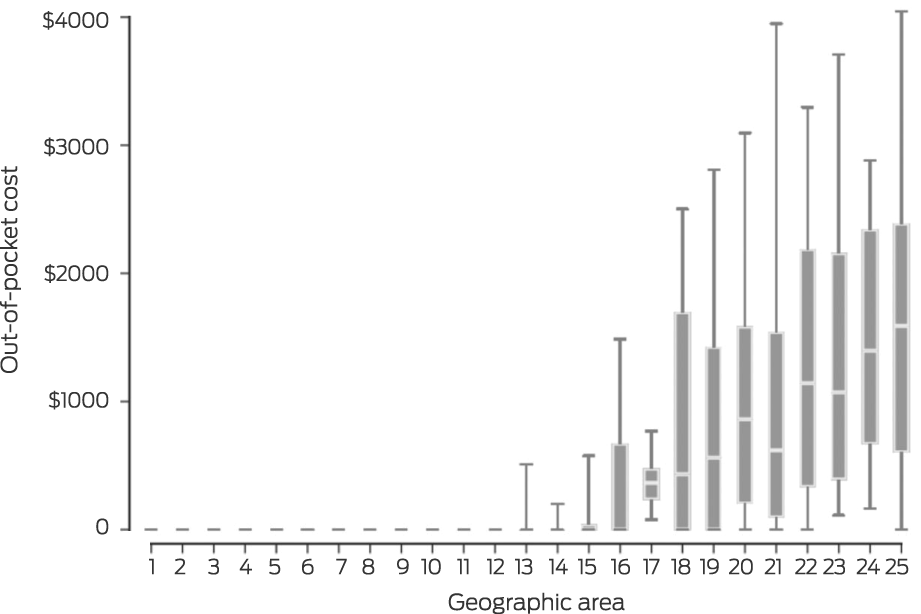
Within geographic areas, out‐of‐pocket costs for individual care episodes varied widely (Box 4). In fifteen areas, out‐of‐pocket costs for 90% of care episodes were low, but even in these centres could amount to $10 000 in individual cases (Box 3). In the other ten areas, the interquartile range ranged from $240 (area 17) to $1857 (area 22). The 90th percentile value exceeded $1000 in eight areas and $3000 in five areas (Box 4).
Discussion
We examined geographic variation in out‐of‐pocket costs, at the care episode level, associated with radiotherapy treatment. Our main finding is that, despite rising bulk‐billing rates and overall falls in out‐of‐pocket costs, radiotherapy costs vary substantially both between and within geographic areas. We found that bulk‐billing rates exceeded 90% in nine of 25 areas, but in seven it was 21% or less. Consequently, mean out‐of‐pocket costs by area ranged from zero to $1777, and the 90th percentile level exceeded $2000 in eight areas. The lowest bulk‐billing rates and the highest and broadest range of out‐of‐pocket costs were in areas where radiotherapy was provided only by private operators.
The increase in out‐of‐pocket costs for care episodes that involved out‐of‐pocket costs was partially attributable to several new private facilities opening in the past few years, increasing the proportion of care delivered by private providers, particularly in metropolitan areas.
Out‐of‐pocket costs are a major determinant of access to care, and the degree of geographic variation we found may help explain the barriers some patients face. While the impact of out‐of‐pocket costs in Australia is poorly understood, they can be a significant financial burden for some people. One Australian study noted that some people reported selling assets, using credit, or instigating fundraising activities to pay for treatment.12 The extent to which financial burden influences decisions to forgo treatment or to choose less effective treatment options is unknown.
Radiation therapy is underused in Australia. For example, it was estimated that 48% of people with new cancer diagnoses in NSW in 2006 should have received radiation therapy, but the actual proportion was 26%, resulting in an estimated extra 411 deaths.21 Earlier studies identified underuse of radiation oncology outside metropolitan areas and in areas of low socio‐economic status,22 potentially contributing to disparities in cancer outcomes reported for people in these areas. While not specific to radiation therapy, other research has found increasing disparities in NSW in the comparative risk of cancer death according to socio‐economic status after adjusting for cancer type and stage at diagnosis, suggesting that factors such as rising out‐of‐pocket costs differentially affect those with the least capacity to pay.23
Limitations
As we did not collect data on cancer type and stage, we could not take cancer‐specific pathways of care into account. Our findings can be generalised to other states, as out‐of‐hospital radiotherapy treatment is subsidised by Medicare across Australia, but our survey‐based sample limits the generalisability of our findings to younger people, for example.11 The mechanisms driving the pronounced variation in costs need to be better understood, including the degrees to which they reflect patient‐level factors, such as health need and capacity to pay, and provider behaviours, such as price discrimination and profit‐seeking behaviour.24 These contributors to the cost of care are the focus of ongoing research by our group.
Conclusion
Future research would benefit from recent improvements in data infrastructure, and could provide a national, population‐level analysis as well as examine the influence of health and economic policy on costs. The relationships between use of radiotherapy with curative intent, out‐of‐pocket costs, financial burden, and survival must be investigated, as well as how these factors affect the widening gap in cancer outcomes according to socio‐economic status and geographic location.
Box 1 – Distribution of mean out‐of‐pocket costs per episode of radiology care for 25 New South Wales postcode areas, 2006–2017
Box 2 – Proportion of episodes of radiology care for 25 New South Wales postcode areas, 2006–2017, that were bulk‐billed, and mean out‐of‐pocket costs per episode of care
Box 3 – Characteristics of the 25 New South Wales postcode areas delivering radiology care, 2006–2017
|
|
|
|
|
|
|
|
Out‐of‐pocket cost per episode |
||||||||
|
Area |
Public/private provision |
IRSD quintile |
Geographic remoteness* |
Episodes |
Patients |
Bulk billing rate |
Mean (SD) |
Maximum |
Patient‐billed cost, mean |
||||||
|
|
|||||||||||||||
|
1 |
Public |
1 |
2 |
206 |
185 |
100% |
$0 |
$0 |
— |
||||||
|
2 |
Public |
2 |
2 |
163 |
127 |
100% |
$0 |
$0 |
— |
||||||
|
3 |
Public |
2 |
1 |
31 |
28 |
100% |
$0 |
$0 |
— |
||||||
|
4 |
Public |
3 |
2 |
459 |
399 |
98% |
$1 ($12) |
$181 |
$58 |
||||||
|
5 |
Public |
2 |
2 |
458 |
363 |
95% |
$7 ($69) |
$1225 |
$139 |
||||||
|
6 |
Public |
2 |
1 |
2165 |
1618 |
96% |
$11 ($110) |
$2149 |
$282 |
||||||
|
7 |
Public |
4 |
1 |
910 |
762 |
90% |
$15 ($81) |
$1098 |
$144 |
||||||
|
8 |
Public |
5 |
1 |
402 |
344 |
92% |
$17 ($91) |
$1181 |
$198 |
||||||
|
9 |
Private |
5 |
1 |
988 |
790 |
81% |
$34 ($172) |
$2518 |
$180 |
||||||
|
10 |
Public |
2 |
2 |
911 |
663 |
93% |
$57 ($579) |
$8877 |
$798 |
||||||
|
11 |
Public |
2 |
2 |
608 |
517 |
83% |
$65 ($312) |
$4042 |
$392 |
||||||
|
12 |
Public |
3 |
2 |
925 |
743 |
94% |
$73 ($773) |
$10 864 |
$1133 |
||||||
|
13 |
Public |
3 |
1 |
831 |
710 |
78% |
$103 ($276) |
$2487 |
$470 |
||||||
|
14 |
Public |
1 |
1 |
450 |
379 |
80% |
$110 ($487) |
$7669 |
$543 |
||||||
|
15 |
Public/private |
3 |
1 |
567 |
490 |
68% |
$112 ($232) |
$1129 |
$353 |
||||||
|
16 |
Public |
4 |
1 |
764 |
660 |
53% |
$392 ($591) |
$2662 |
$824 |
||||||
|
17 |
Private |
3 |
2 |
638 |
530 |
3 |
$422 ($365) |
$2767 |
$436 |
||||||
|
18 |
Public/private |
3 |
2 |
874 |
731 |
34% |
$1011 ($1433) |
$11 623 |
$1542 |
||||||
|
19 |
Public |
5 |
1 |
1584 |
1328 |
25% |
$1067 ($1572) |
$16 866 |
$1425 |
||||||
|
20 |
Private |
5 |
1 |
29 |
26 |
17% |
$1151 ($1172) |
$4757 |
$1391 |
||||||
|
21 |
Private |
4 |
1 |
497 |
437 |
21% |
$1254 ($1754) |
$12 265 |
$1595 |
||||||
|
22 |
Private |
4 |
1 |
185 |
156 |
16% |
$1418 ($1217) |
$6147 |
$1692 |
||||||
|
23 |
Private |
4 |
1 |
208 |
184 |
6 |
$1476 ($1450) |
$8022 |
$1574 |
||||||
|
24 |
Private |
5 |
1 |
539 |
457 |
5 |
$1599 ($1437) |
$14 142 |
$1677 |
||||||
|
25 |
Private |
3 |
1 |
114 |
97 |
12% |
$1777 ($1490) |
$6461 |
$2025 |
||||||
|
Mean |
— |
— |
— |
620 |
509 |
62% |
$487 ($626) |
$5165 |
$858 |
||||||
|
|
|||||||||||||||
|
IRSD = Socio‐Economic Indexes for Areas (SEIFA) Socioeconomic Index of Relative Socioeconomic Disadvantage (IRSD), by quintile (1, greatest socio‐economic disadvantage; 5, least socio‐economic disadvantage);20 SD = standard deviation. * Australian Standard Geographical Classification (1, major city; 2, other). |
|||||||||||||||
Received 18 August 2022, accepted 15 February 2023
- Dan Liu1
- Serena Yu1
- Samuel BG Webster2
- Bahare Moradi3
- Philip Haywood1,4
- Jane Hall1
- Sanchia Aranda5,6
- Kees Gool1,2
- 1 University of Technology Sydney, Sydney, NSW
- 2 Independent Hospital Pricing Authority, Sydney, NSW
- 3 Royal North Shore Hospital, Sydney, NSW
- 4 Organisation for Economic Co‐operation and Development (OECD), Paris, France
- 5 The University of Melbourne, Melbourne, VIC
- 6 Peter MacCallum Cancer Centre, Melbourne, VIC
Open access
Open access publishing facilitated by University of Technology Sydney, as part of the Wiley ‐ University of Technology Sydney agreement via the Council of Australian University Librarians.
This study was supported by the National Health and Medical Research Council (NHMRC) Centre of Research Excellence in Value Based Cancer Care (1171749). The study is solely the responsibility of the authors and does not reflect the views of the NHMRC. We acknowledge the advisory group of the Centre of Research Excellence in Value Based Cancer Care for facilitating the study and the Centre of Research Excellence investigators for helpful suggestions. The 45 and Up Study is managed by the Sax Institute in collaboration with its major partner, Cancer Council NSW, and its other partners: the Heart Foundation, the NSW Ministry of Health, and Australian Red Cross Lifeblood. We thank the many thousands of people participating in the 45 and Up Study. We also acknowledge Services Australia for providing MBS data and Secure Unified Research Environment (SURE) for data access.
No relevant disclosures.
- 1. Paravati AJ, Boero IJ, Triplett DP, et al. Variation in the cost of radiation therapy among Medicare patients with cancer. J Oncol Pract 2015; 11: 403‐409.
- 2. Medicare Benefits Schedule Review Taskforce. Report from the Oncology Clinical Committee. 2018. https://www.health.gov.au/sites/default/files/documents/2021/05/taskforce‐endorsed‐report‐oncology‐clinical‐committee‐report‐from‐the‐oncology‐clinical‐committee.pdf (viewed Nov 2022).
- 3. Bates N, Callander E, Lindsay D, Watt K. CancerCostMod: a model of the healthcare expenditure, patient resource use, and patient co‐payment costs for Australian cancer patients. Health Econ Rev 2018; 8: 28.
- 4. Services Australia. What are the thresholds. Find the threshold amounts for Medicare Safety Nets. Updated 1 Jan 2023. https://www.servicesaustralia.gov.au/what‐are‐medicare‐safety‐nets‐thresholds?context=22001 (viewed Mar 2023).
- 5. Yu S, van Gool K, Hall J, Fiebig DG. Physician pricing behavior: evidence from an Australian experiment. J Econ Behav Organ 2019; 161: 20‐34.
- 6. Newton JC, Johnson CE, Hohnen H, et al. Out‐of‐pocket expenses experienced by rural Western Australians diagnosed with cancer. Support Care Cancer 2018; 26: 3543‐3552.
- 7. Boyages J, Xu Y, Kalfa S, et al. Financial cost of lymphedema borne by women with breast cancer. Psychooncology 2017; 26: 849‐855.
- 8. Thompson BS, Pandeya N, Olsen CM, et al. Keratinocyte cancer excisions in Australia: who performs them and associated costs. Australas J Dermatol 2019; 60: 294‐300.
- 9. Gordon LG, Tuffaha HW, James R, et al. Estimating the healthcare costs of treating prostate cancer in Australia: a Markov modelling analysis. Urol Oncol 2018; 36: 91.e7‐91.e15.
- 10. Slavova‐Azmanova NS, Newton JC, Saunders CM. Marked variation in out‐of‐pocket costs for cancer care in Western Australia. Med J Aust 2020; 212: 525‐526. https://www.mja.com.au/journal/2020/212/11/marked‐variation‐out‐pocket‐costs‐cancer‐care‐western‐australia
- 11. Johar M, Jones G, Savage E. Healthcare expenditure profile of older Australians: evidence from linked survey and health administrative data. Economic Papers 2012; 31: 451‐463.
- 12. Bygrave A, Whittaker K, Paul C, et al. Australian experiences of out‐of‐pocket costs and financial burden following a cancer diagnosis: a systematic review. Int J Environ Res Public Health 2021; 18: 2422.
- 13. Chalmers K, Elshaug AG, Larkin S. First steps towards price transparency: comparability of online out‐of‐pocket tools from Australian private health funds. Aust Health Rev 2020; 44: 347‐354.
- 14. Australian Department of Health and Age Care. Medical costs finder. Updated 20 Sept 2021. https://www.health.gov.au/resources/apps‐and‐tools/medical‐costs‐finder (viewed Mar 2023).
- 15. Breast Cancer Network Australia; Cancer Council; Canteen; Prostate Cancer Foundation of Australia. Standard for informed financial consent. 2019; reviewed Apr 2020. https://www.cancer.org.au/assets/pdf/standard_for_informed_financial_consent (viewed Nov 2022).
- 16. Bleicher K, Summerhayes R, Baynes S, et al. Cohort profile update: the 45 and Up Study. Int J Epidemiol 2023; 52: e92‐e101.
- 17. Australian Institute of Health and Welfare. Health expenditure Australia 2016–17 (Cat. no. HWE 74; Health and welfare expenditure series no. 64) Canberra: AIHW, 2018. https://www.aihw.gov.au/getmedia/e8d37b7d‐2b52‐4662‐a85f‐01eb176f6844/aihw‐hwe‐74.pdf.aspx?inline=true (viewed Mar 2023).
- 18. Australian Department of Health and Aged Care. Treatment facility locations, NSW. A list of radiotherapy treatment facilities and their locations in New South Wales. Updated 10 Mar 2022. Archived: https://web.archive.org/web/20221107005212/https://www1.health.gov.au/internet/main/publishing.nsf/Content/health‐roi‐radiother‐fac_nsw.htm (viewed Nov 2022).
- 19. Australian Bureau of Statistics. 2033.0.55.001. Census of population and housing: Socio‐economic indexes for areas (SEIFA), Australia, 2016. IRSD. 27 Mar 2018. https://www.abs.gov.au/ausstats/abs@.nsf/Lookup/by%20Subject/2033.0.55.001~2016~Main%20Features~IRSD~19 (viewed Nov 2022).
- 20. Australian Institute of Health and Welfare. Remoteness classification (ASGC‐RA) N. Updated 20 Sept 2022. https://meteor.aihw.gov.au/content/466873 (viewed Mar 2023).
- 21. Batumalai V, Shafiq J, Gabriel G, et al. Impact of radiotherapy underutilisation measured by survival shortfall years of potential life lost and disability‐adjusted life years lost in New South Wales, Australia. Radiother Oncol 2018; 129: 191‐195.
- 22. Merie R, Gabriel G, Shafiq J, et al. Radiotherapy underutilisation and its impact on local control and survival in New South Wales, Australia. Radiother Oncol 2019; 141: 41‐47.
- 23. Tervonan H, Aranda S, Roder D, et al. Cancer survival disparities worsening by socio‐economic disadvantage over the last 3 decades in New South Wales, Australia. BMC Public Health 2017; 17: 691.
- 24. Johar M, Mu C, van Gool K, Wong CY. Bleeding hearts, profiteers, or both: specialist physician fees in an unregulated market. Health Economics 2017; 26: 528‐535.
Abstract
Objectives: To examine out‐of‐pocket costs incurred by patients for radiation oncology services and their variation by geographic location.
Design: Analysis of patient‐level Medical Benefits Schedule (MBS) claims data linked with data from the Sax Institute 45 and Up Study.
Setting, participants: People who received Medicare‐subsidised radiation oncology services in New South Wales, 2006–2017.
Main outcome measure: Mean out‐of‐pocket costs for an episode of radiation oncology (during 90 days from start of radiotherapy planning service), by geographic location (postcode‐based), overall and after excluding episodes with no out‐of‐pocket costs (fully bulk‐billed).
Results: During 2006–2017, 12 724 people received 15 506 episodes of radiation oncology care in 25 postcode‐defined geographic areas. The proportion of episodes for which the out‐of‐pocket cost was less than $1 increased from 39% in 2006 to 76% in 2017; the proportion for which out‐of‐pocket costs exceeded $500 declined from 43% in 2006 to 10% in 2014, before increasing to 17% in 2017. For care episodes with non‐zero out‐of‐pocket costs, the mean amount rose from around $1186 to $1611 per episode of care during 2006–2017. The proportion of radiation oncology episodes bulk‐billed exceeded 90% in nine areas; in seven areas, all with exclusively private care provision of radiation oncology, it was 21% or smaller. Within geographic areas, out‐of‐pocket costs for individual care episodes varied widely; in ten areas with lower bulk‐billing rates, the interquartile range for costs ranged from $240 to $1857.
Conclusion: Out‐of‐pocket costs are an important determinant of access to care. Although radiotherapy costs for most people are moderate, some face very high costs, and these vary markedly by location. It is important to ensure that radiation oncology services remain affordable for all people who need treatment.