




Volume 215 - Issue 7
What price quality in aged care? Findings from a national survey of more than 6500 income taxpayers
Authors: Julie Ratcliffe, Jyoti Khadka, Sheela Kumaran and Billingsley Kaambwa
Med J Aust 2021; 215 (7): 307-310.e1. || doi: 10.5694/mja2.51242
Published online: 13 September 2021
Published online: 13 September 2021
Public willingness to pay higher taxes is an important signal, but additional financial pillars are needed
Public willingness to pay higher taxes is an important signal, but additional financial pillars are needed
Australia’s aged care sector represents a multibillion dollar industry, predominantly funded publicly through income tax contributions. The Royal Commission into Aged Care Quality and Safety is currently placing an international spotlight on system shortfalls. Before the coronavirus disease 2019 (COVID‐19) pandemic, the Australian Medical Association declared Australia’s aged care system to be in crisis, joining with the Australian Nursing and Midwifery Federation in urging the government to immediately guarantee quality and safety.1 COVID‐19 has further magnified cracks in the system, having recently been described as one that “is rife with substandard care”.2
In 2017–2018, almost one million older Australians accessed home care services, and over 230 000 were permanently living in residential care at a cost to government alone of over $18 billion.3 These estimates are expected to increase exponentially in the coming decades.3 Evidence from Australia and internationally indicates the inextricable links between aged care and health systems, with the delivery of high quality aged care strongly associated with cost‐effective containments in health system expenditures and improvements in older people’s quality of life.4,5
Coupled with the potential for sector‐wide efficiency improvements,6 the introduction of a hypothecated aged care levy, financed from additional income tax contributions, has recently been highlighted in the United Kingdom7 and Australia8 as a potential new source to assist in funding quality improvements and meeting the spiralling costs of aged care.
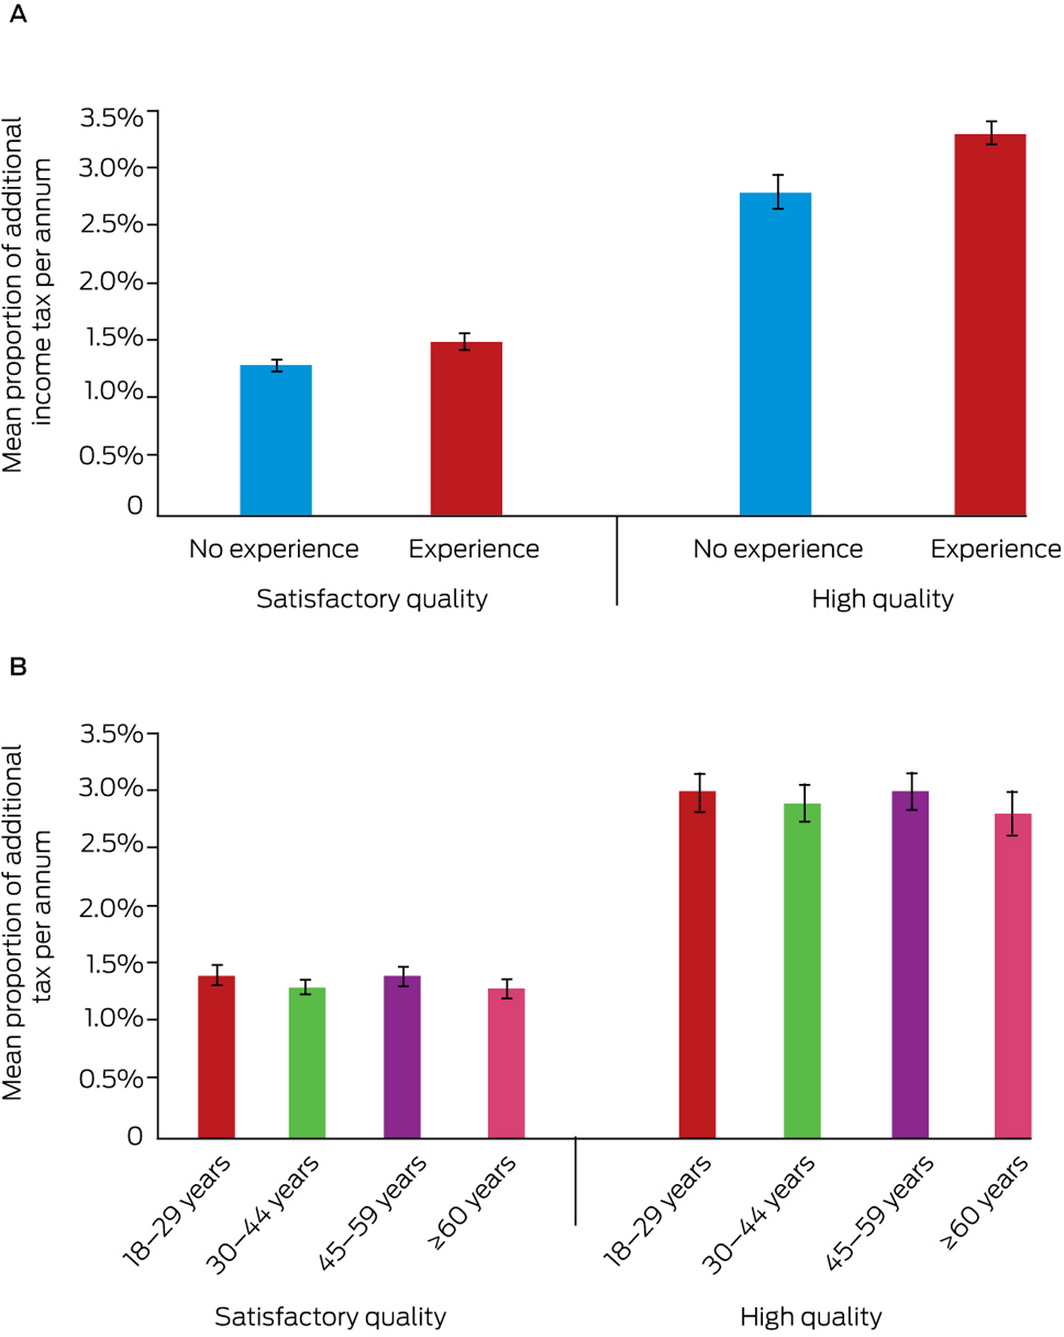
Our team recently designed and conducted an Australia‐wide survey commissioned by the Royal Commission into Aged Care Quality and Safety. The survey sample included over 10 000 respondents sourced from an online panel and representative of the June 2018 Australian population (aged ≥ 18 years) by age, sex, state/territory and household income. The sample included over 6500 current income taxpayers not currently receiving aged care services and hence potential future recipients of aged care.9 Using stated preference contingent valuation methods (see the Supporting Information for further discussion of this approach), we found that 61% of current income taxpayers would be willing to pay an additional 1.4% income tax per year to ensure universal access to a satisfactory level of aged care, and 55% of current income taxpayers would be willing to pay an additional 3% income tax per year to achieve high quality aged care. Respondents with experience of aged care through a close family member were willing to pay more to guarantee universal access to satisfactory or high quality care compared with those without experience (Box 1 and Box 2). Similarly, younger people were also willing to pay slightly more than older people to ensure universal access to satisfactory or high quality care (Box 3).
At present, 4% of Australia’s income tax contributions are allocated to aged care.9 Modelling by the Royal Commission into Aged Care Quality and Safety indicates that a doubling of this expenditure base may be required in the short to medium term to meet the needs of Australia’s rising numbers of older people, coupled with the need to implement substantial improvements in the quality and safety of aged care.8 An additional issue to consider for income tax contributions as an integral component of aged care financing is the ratio of the working population compared with our older population. This ratio is continuously declining from 101 people of working age for every person aged 85 years or older in 1978 to 33 in 2018. By 2058, it is predicted that there will only be 15 people of working age for every person aged 85 years or older.8 It is therefore clear that there will be an increasing need for additional pillars of financial support beyond the current system, comprising income tax contributions as the major financial pillar supplemented by means‐tested personal co‐contributions and voluntary self‐funded contributions for extra services or supports.
Other countries, including Germany and Japan, that are often highlighted as providing high quality aged care have compulsory social insurance schemes whereby contributions are made to a dedicated, pooled fund to finance the costs of aged care for members of society at the time of need.10 Other potential pillars of financial support include taxing superannuation earnings above a certain threshold, and private insurance.8
The current crisis facing aged care clearly demonstrates an urgent need for a national conversation. As a society, we need to take collective responsibility, building upon the foundations laid by our Australia‐wide survey to carefully consider all options for ensuring the quality, safety and sustainability of Australia’s aged care system for all Australians in need, now and into the future.
Box 1 – Willingness to pay additional income tax to support quality improvements, by aged care experience through a close family member (A) and age group (B)
Box 2 – Willingness to pay additional income tax to support quality improvements: descriptive statistics, by aged care experience through a close family member
|
Aged care quality |
Aged care experience |
Income group |
No. of respondents |
Additonal income tax proportion |
|||||||||||
|
Mean (SD) |
95% CI |
Median (IQR) |
|||||||||||||
|
|
|||||||||||||||
|
Satisfactory |
No |
All income levels |
2912 |
1.3% (1.1%) |
1.2–1.3% |
1.0% (0.5—1.5%) |
|||||||||
|
|
|
> $40 000 |
400 |
1.3% (1.1%) |
1.2–1.4% |
1.0% (0.5–2.0%) |
|||||||||
|
|
|
$40 000–$79 999 |
771 |
1.3% (1.0%) |
1.2–1.3% |
1.0% (0.5–1.5%) |
|||||||||
|
|
|
$80 000–$124 999 |
797 |
1.3% (1.2%) |
1.2–1.4% |
1.0% (0.5–1.5%) |
|||||||||
|
|
|
≥ $125 000 |
692 |
1.3% (1.2%) |
1.2–1.4% |
1.0% (0.5–1.5%) |
|||||||||
|
|
|
Income level not disclosed* |
252 |
1.2% (1.0%) |
1.1–1.3% |
1.0% (0.5–1.5%) |
|||||||||
|
|
Yes |
All income levels |
1099 |
1.5% (1.2%) |
1.4–1.6% |
1.5% (1.0–2.0%) |
|||||||||
|
|
|
> $40 000 |
162 |
1.6% (1.2%) |
1.4–1.8% |
1.5% (1.0–2.0%) |
|||||||||
|
|
|
$40 000–$79 999 |
274 |
1.5% (1.1%) |
1.4–1.6% |
1.5% (1.0–2.0%) |
|||||||||
|
|
|
$80 000–$124 999 |
329 |
1.4% (1.1%) |
1.3–1.6% |
1.0% (0.5–2.0%) |
|||||||||
|
|
|
≥ $125 000 |
279 |
1.5% (1.2%) |
1.4–2.7% |
1.0% (0.5–2.0%) |
|||||||||
|
|
|
Income level not disclosed* |
55 |
1.3% (1.0%) |
1.0–1.6% |
1.0% (0.5–1.5%) |
|||||||||
|
High |
No |
All income levels |
2558 |
2.8% (2.3%) |
2.7–2.8% |
2.0% (1.0–4.0%) |
|||||||||
|
|
|
> $40 000 |
346 |
2.9% (2.5%) |
2.7–3.2% |
2.5% (1.5–4.0%) |
|||||||||
|
|
|
$40 000–$79 999 |
682 |
2.7% (2.0%) |
2.6–2.9% |
2.5% (1.0–3.5%) |
|||||||||
|
|
|
$80 000–$124 999 |
710 |
2.9% (2.5%) |
2.7–3.0% |
2.0% (1.0–4.0%) |
|||||||||
|
|
|
≥ $125 000 |
609 |
2.8% (2.4%) |
2.6–3.0% |
2.0% (1.0–4.0%) |
|||||||||
|
|
|
Income level not disclosed* |
241 |
2.6% (2.1%) |
2.3–2.8% |
2.0% (1.0–3.5%) |
|||||||||
|
|
Yes |
All income levels |
1002 |
3.3% (2.4%) |
3.1–3.4% |
3.0% (1.5–4.5%) |
|||||||||
|
|
|
> $40 000 |
146 |
3.5% (2.6%) |
3.1–4.0% |
3.5% (2.0–4.5%) |
|||||||||
|
|
|
$40 000–$79 999 |
247 |
3.4% (2.4%) |
3.1–3.7% |
3.0% (2.0–4.5%) |
|||||||||
|
|
|
$80 000–$124 999 |
304 |
3.2% (2.3%) |
2.9–3.4% |
3.0% (1.5–4.5%) |
|||||||||
|
|
|
≥ $125 000 |
253 |
3.3% (2.6%) |
3.0–3.7% |
3.0% (1.5–4.5%) |
|||||||||
|
|
|
Income level not disclosed* |
52 |
2.8% (2.2%) |
2.2–3.4% |
2.3% (1.0–4.0%) |
|||||||||
|
|
|||||||||||||||
|
CI = confidence interval; IQR = interquartile range; SD = standard deviation. * Respondents who chose “prefer not to say” option for household income level categorisation survey question. |
|||||||||||||||
Box 3 – Willingness to pay additional income tax to support quality improvements: descriptive statistics, by age group
|
Aged care quality |
Age |
Income group |
No. of respondents |
Additonal income tax proportion |
|||||||||||
|
Mean (SD) |
95% CI |
Median (IQR) |
|||||||||||||
|
|
|||||||||||||||
|
Satisfactory |
18–29 years |
All income levels |
991 |
1.4% (1.1%) |
1.3–1.5% |
1.0% (0.5–2.0%) |
|||||||||
|
|
|
> $40 000 |
222 |
1.5% (1.2%) |
1.3–1.6% |
1.0% (0.5–2.0%) |
|||||||||
|
|
|
$40 000–$79 999 |
280 |
1.4% (1.1%) |
1.3–1.6% |
1.0% (0.5–2.0%) |
|||||||||
|
|
|
$80 000–$124 999 |
235 |
1.3% (0.9%) |
1.2–1.4% |
1.0% (0.5–1.5%) |
|||||||||
|
|
|
≥ $125 000 |
179 |
1.4% (1.3%) |
1.2–1.6% |
1.0% (0.5–2.0%) |
|||||||||
|
|
|
Income level not disclosed* |
75 |
1.4% (1.1%) |
1.1–1.6% |
1.0% (0.5–2.0%) |
|||||||||
|
|
30–44 years |
All income levels |
1336 |
1.3% (1.1%) |
1.3–1.4% |
1.0% (0.5–2.0%) |
|||||||||
|
|
|
> $40 000 |
120 |
1.4% (1.0%) |
1.3–1.6% |
1.5% (0.5–2.0%) |
|||||||||
|
|
|
$40 000–$79 999 |
305 |
1.3% (0.9%) |
1.2–1.4% |
1.0% (0.5–2.0%) |
|||||||||
|
|
|
$80 000–$124 999 |
447 |
1.4% (1.3%) |
1.3–1.5% |
1.0% (0.5–2.0%) |
|||||||||
|
|
|
≥ $125 000 |
373 |
1.3% (1.1%) |
1.2–1.4% |
1.0% (0.5–1.0%) |
|||||||||
|
|
|
Income level not disclosed* |
91 |
1.0% (0.5%) |
0.8–1.1% |
1.0% (0.5–1.0%) |
|||||||||
|
|
45–59 years |
All income levels |
1063 |
1.4% (1.2%) |
1.3–1.5% |
1.0% (0.5–2.0%) |
|||||||||
|
|
|
> $40 000 |
134 |
1.4% (1.3%) |
1.2–1.7% |
1.0% (0.5–2.0%) |
|||||||||
|
|
|
$40 000–$79 999 |
254 |
1.4% (1.2%) |
1.3–1.5% |
1.0% (0.5–2.0%) |
|||||||||
|
|
|
$80 000–$124 999 |
280 |
1.4% (1.1%) |
1.2–1.5% |
1.0% (0.5–2.0%) |
|||||||||
|
|
|
≥ $125 000 |
308 |
1.4% (1.2%) |
1.2–1.5% |
1.0% (0.5–2.0%) |
|||||||||
|
|
|
Income level not disclosed* |
87 |
1.3% (1.4%) |
1.2–1.6% |
1.0% (0.5–2.0%) |
|||||||||
|
|
≥ 60 years |
All income levels |
621 |
1.3% (1.0%) |
1.2–1.4% |
1.0% (0.5–1.5%) |
|||||||||
|
|
|
> $40 000 |
86 |
1.2% (0.7%) |
1.0–1.3% |
1.0% (0.5–1.5%) |
|||||||||
|
|
|
$40 000–$79 999 |
206 |
1.2% (0.8%) |
1.1–1.3% |
1.0% (0.5–1.5%) |
|||||||||
|
|
|
$80 000–$124 999 |
164 |
1.3% (1.0%) |
1.2–1.5% |
1.0% (0.5–2.0%) |
|||||||||
|
|
|
≥ $125 000 |
111 |
1.4% (1.5%) |
1.1–1.7% |
1.0% (0.5–2.0%) |
|||||||||
|
|
|
Income level not disclosed* |
54 |
1.3% (0.8%) |
1.1–1.5% |
1.0% (0.5–1.5%) |
|||||||||
|
High |
18–29 years |
All income levels |
939 |
3.0% (2.4%) |
2.8–3.1% |
2.5% (1.5–4.0%) |
|||||||||
|
|
|
> $40 000 |
218 |
3.2% (2.5%) |
2.8–3.5% |
2.5% (1.5–4.5%) |
|||||||||
|
|
|
$40 000–$79 999 |
260 |
3.0% (2.4%) |
2.7–3.3% |
2.5% (1.5–4.0%) |
|||||||||
|
|
|
$80 000–$124 999 |
224 |
2.7% (2.0%) |
2.4–3.0% |
2.3% (1.0–3.5%) |
|||||||||
|
|
|
≥ $125 000 |
165 |
3.1% (2.6%) |
2.7–3.5% |
2.5% (1.0–4.0%) |
|||||||||
|
|
|
Income level not disclosed* |
72 |
2.8% (2.4%) |
2.3–3.4% |
2.3% (1.0–4.0%) |
|||||||||
|
|
30–44 years |
All income levels |
1202 |
2.9% (2.4%) |
2.8–3.0% |
2.5% (1.0–4.0%) |
|||||||||
|
|
|
> $40 000 |
105 |
3.2% (2.5%) |
2.7–3.7% |
3.0% (1.5–4.0%) |
|||||||||
|
|
|
$40 000–$79 999 |
272 |
2.9% (2.1%) |
2.7–3.2% |
2.5% (1.5–4.0%) |
|||||||||
|
|
|
$80 000–$124 999 |
410 |
3.1% (2.7%) |
2.8–3.3% |
2.5% (1.5–4.0%) |
|||||||||
|
|
|
≥ $125 000 |
328 |
2.8% (2.3%) |
2.5–3.1% |
2.0% (1.0–4.0%) |
|||||||||
|
|
|
Income level not disclosed* |
87 |
2.1% (1.4%) |
1.8–2.4% |
1.5% (1.0–3.0%) |
|||||||||
|
|
45–59 years |
All income levels |
934 |
3.0% (2.5%) |
2.8–3.1% |
2.5% (1.5–4.0%) |
|||||||||
|
|
|
> $40 000 |
108 |
3.2% (2.8%) |
2.6–3.7% |
2.8% (1.5–4.0%) |
|||||||||
|
|
|
$40 000–$79 999 |
227 |
3.0% (2.3%) |
2.7–3.3% |
2.5% (1.0–4.0%) |
|||||||||
|
|
|
$80 000–$124 999 |
242 |
3.0% (2.4%) |
2.7–3.3% |
2.5% (1.5–4.0%) |
|||||||||
|
|
|
≥ $125 000 |
275 |
3.0% (2.5%) |
2.7–3.3% |
2.5% (1.5–4.0%) |
|||||||||
|
|
|
Income level not disclosed* |
82 |
2.8% (2.7%) |
2.2–3.4% |
2.0% (1.0–4.0%) |
|||||||||
|
|
≥ 60 years |
All income levels |
515 |
2.8% (2.0%) |
2.6–2.9% |
2.5% (1.5–4.0%) |
|||||||||
|
|
|
> $40 000 |
61 |
2.7% (1.7%) |
2.2–3.1% |
2.0% (1.5–3.5%) |
|||||||||
|
|
|
$40 000–$79 999 |
170 |
2.6% (1.8%) |
2.3–2.8% |
2.3% (1.0–3.0%) |
|||||||||
|
|
|
$80 000–$124 999 |
138 |
3.0% (1.9%) |
2.6–3.3% |
2.5% (1.5–4.0%) |
|||||||||
|
|
|
≥ $125 000 |
94 |
2.9% (2.7%) |
2.3–3.4% |
2.0% (1.0–4.0%) |
|||||||||
|
|
|
Income level not disclosed* |
52 |
2.8% (1.7%) |
2.3–3.2% |
2.5% (1.5–4.0%) |
|||||||||
|
|
|||||||||||||||
|
CI = confidence interval; IQR = interquartile range; SD = standard deviation. * Respondents who chose “prefer not to say” option for household income level categorisation survey question. |
|||||||||||||||
Competing interests
No relevant disclosures.
Acknowledgements
We gratefully acknowledge funding support from the Royal Commission into Aged Care Quality and Safety. The Royal Commission into Aged Care Quality and Safety was involved in the planning of the survey and in commissioning an online panel company to collect the survey data. The co‐authors undertook the final design, analysis and interpretation, and reporting independently of the Commission, and the views expressed in the article are not necessarily those of the Commissioners.
References
- Egan N. Doctors, nurses join calls for action on aged care now. Australian Ageing Agenda, 30 Sept 2019. https://www.australianageingagenda.com.au/executive/doctors‐nurses‐join‐calls‐for‐action‐on‐aged‐care‐now/ (viewed Aug 2021).
- Aged care in Australia falls short [editorial]. Lancet 2019; 394: 1686.
- Australian Institute of Health and Welfare. Older Australia at a glance (Cat. No. AGE 87). Canberra: AIHW, 2018. https://www.aihw.gov.au/reports/older‐people/older‐australia‐at‐a‐glance/contents/summary (viewed Aug 2021).
- Carey K, Zhao S, Snow AL, Hartmann CW. The relationship between nursing home quality and costs: evidence from the VA. PLoS One 2018; 13: e0203764.
- Dyer SM, Liu E, Gnanamanickam ES, et al. Clustered domestic residential aged care in Australia: fewer hospitalisations and better quality of life. Med J Aust 2018; 208: 433–438. https://www.mja.com.au/journal/2018/208/10/clustered‐domestic‐residential‐aged‐care‐australia‐fewer‐hospitalisations‐and
- Royal Commission into Aged Care Quality and Safety. The cost of residential aged care. Research Paper 9. Canberra: Commonwealth of Australia, 2020. https://agedcare.royalcommission.gov.au/publications/research‐paper‐9‐cost‐residential‐aged‐care (viewed Aug 2021).
- Campbell D. Over‐40s in UK to pay more tax under plans to fix social care crisis. The Guardian 2020; 27 July. https://www.theguardian.com/society/2020/jul/26/uk-ministers-looking-at-plans-to-raise-taxes-for-over-40s-to-pay-for-social-care (viewed July 2020).
- Royal Commission into Aged Care Quality and Safety. Financing aged care. Consultation Paper 2. Canberra: Commonwealth of Australia, 2020. https://agedcare.royalcommission.gov.au/publications/consultation-paper-2-financing-aged-care (viewed Aug 2021).
- Ratcliffe J, Chen G, Cleland J, et al. Australia’s aged care system: assessing the views and preferences of the general public for quality of care and future funding. Royal Commission into Aged Care Quality and Safety Research Paper 6. Canberra: Commonwealth of Australia, 2020. https://agedcare.royalcommission.gov.au/sites/default/files/2020-07/research_paper_6_-_australias_aged_care_system_-_assessing_the_views_an._.pdf (viewed Aug 2021).
- Dyer SM, Valeri M, Arora N, et al. Review of international systems for long‐term care of older people. Royal Commission into Aged Care Quality and Safety Research Paper 2. Canberra: Commonwealth of Australia, 2020. https://agedcare.royalcommission.gov.au/sites/default/files/2020-09/Research%20Paper%202%20-%20Review%20of%20international%20systems%20for%20long-term%20care%20of....pdf (viewed Aug 2021).
Linked content
-
InSight+: Most Aussies willing to pay more for quality aged care
Provenance: Not commissioned; externally peer reviewed.
Respiratory Syncytial Virus Disease Burden and Evidence Gaps in Australia Before Immunisation Introduction: A Retrospective Population-Based Study Using 2016–2019 Hospitalisation and 2023 Laboratory Surveillance Data
Chisato Imai-Boulter, Jean Li-Kim-Moy, Clayton Chiu, Sanjay Jayasinghe, Kristine Macartney
Multimorbidity Clusters Among People Aged 65 Years and Over in Australia: A Nationwide Cross-Sectional Data Linkage Study
Weisi Chen, Christine Y. Lu, Sarah N. Hilmer, Alice A. Gibson, Edwin C. K. Tan
Predictors of Ambulance Transport to Hospital for Older People Living in Tasmanian Aged Care Facilities: A Retrospective Cohort Study
Sharon Andrews, Pieter F. Fouche, Belinda Flanagan, Michael McDermott, Melanie Greenwood
Deprescribing in Older People: A Clinical Practice Guideline Summary
Stephen Tucker, John D. G. Watson, Donna Wellins, Tim Whitmore, Christopher Etherton-Beer, Amy T. Page
Emergency Department Presentations and Hospitalisations for Elder Abuse in People Accessing Aged Care Services in Australia: A Retrospective Cross-Sectional Study
Stephanie L. Harrison, Sahar Barmomanesh, Bryan Morden, Maria C. Inacio, Gillian E. Caughey, on behalf of the ROSA Consumer and Community Advisory Committee
A future for the hospital‐in‐the‐home (HITH) deteriorating patient: shifting the paradigm
Davide R Tomassoni, Iftah Amith