




Volume 223 - Issue 4
The prevalence of and variation in indicators of the quality and safety of long term aged care in Australia, 2019: a cross‐sectional population‐based study
Authors: Tesfahun C Eshetie, Gillian E Caughey, Catherine Lang, Olivia Ryan, Renuka Visvanathan, Craig Whitehead, Keith Evans, Janet K Sluggett, Jyoti Khadka, Carolyn Dawkins, Helena Williams, Miranda Starke, Sara Blunt, Anne Liddell, Megan Corlis, Anna Sheppeard, Penelope Lello, Marilyn Thien, Steven L Wesselingh and Maria C Inacio
Med J Aust 2025 || doi: 10.5694/mja2.52709
Published online: 4 August 2025
Published online: 4 August 2025
Our findings could be used to identify areas of aged care that could be targeted by quality improvement programs
Abstract
Objectives: To examine the prevalence of and variation in indicators of the quality and safety of care provided to older Australians who received subsidised long term care during 2019, by type of care (residential aged care or home care packages).
Study design: Cross‐sectional population‐based study; analysis of linked data from the Registry of Senior Australians (ROSA) National Historical Cohort (National Aged Care Data Clearinghouse, National Death Index, Medicare Benefits Schedule, Pharmaceutical Benefits Scheme databases; South Australian, New South Wales, Victorian, and Queensland hospital admissions and emergency department [ED] presentations databases).
Setting, participants: All people in the ROSA National Historical Cohort who received residential or home‐based aged care during the 2019 calendar year.
Main outcome measures: Risk‐adjusted prevalence estimates (with 95% confidence intervals, CIs) for quality and safety indicators of care (twelve for residential care, fifteen for home care packages); proportions by indicator of outlier residential facilities and home care services (outside 95% CI for mean value) as a measure of variation in quality of care.
Results: In 2019, 244754 people received residential aged care in 2746 facilities; 149104 people received home care packages through 2407 home care services. For residential aged care, indicator prevalence and variation were highest for antibiotic use (prevalence: 64.5% [95% CI, 64.3–64.7%]; 13.9% of facilities beyond upper 95% CI bound), high sedative load (prevalence: 45.2%, [95% CI, 45.0–45.4%]; 12.4% beyond upper 95% CI bound), and ED presentations (prevalence: 37.8% [95% CI, 37.6–38.0%]; 19.3% beyond upper 95% CI bound). For home care services, indicator prevalence and variation were highest for waiting time longer than six months (prevalence: 81.8% [95% CI, 81.4–82.1%]; 17.5% of services beyond upper 95% CI bound), ED presentations (prevalence: 43.2% [95% CI, 43.0–43.5%]; 14.7% beyond upper 95% CI bound), chronic disease management plans (prevalence: 43.2% [95% CI, 42.9–43.5%]; 12.9% below lower 95% CI bound), and home medicines reviews (prevalence: 3.2% [95% CI, 3.1–3.3%]; 28.9% below lower 95% CI bound). The proportions of home care recipients were larger than for facility residents for hospitalisations with delirium/dementia (home care, 10.5% [95% CI, 10.1–10.9%]; residents, 4.3% [95% CI, 4.2–4.4%]), weight loss/malnutrition (home care, 5.5% [95% CI, 5.3–5.6%]; residents, 2.5% [95% CI, 2.4–2.6%]), or medication‐related events (home care, 4.6% [95% CI, 4.5–4.7%]; residents, 2.4% [95% CI, 2.3–2.5%]).
Conclusions: The marked national variations by residential or home aged care provider in antibiotic use, ED presentations, high sedative load, longer waiting times for home care services, home medicines reviews, and chronic disease management plans suggest these areas could benefit from targeted quality improvement strategies.
The known: The Registry of Senior Australians (ROSA) outcome monitoring system is a pragmatic system for monitoring and benchmarking the quality and safety of long term aged care in Australia.
The new: In 2019, variations in the quality of aged care between residential facilities and between home care services were quite marked, particularly with respect to indicators such as emergency department presentations, antibiotic use, high sedative load, waiting time for home care services, home medicines reviews, and chronic disease management plans.
The implications: Our findings could be used to identify areas of aged care that could be targeted by quality improvement programs.
During 2022–23, more than 565000 people received government‐subsidised long term aged care in Australia: 250273 in residential aged care and 314971 who received home care packages.1 The need of our ageing population for high quality aged care services has long been unmet.2,3 Quality and safety monitoring programs are critical for ensuring consistent high quality long term care.4 The approach, maturity, and impact of programs for monitoring the quality and safety of long term care differ between countries.5 In a recent review (to be published elsewhere), we identified nineteen residential care and thirteen home care programs, for twenty of which public reports are available.
In Australia, the National Mandatory Aged Care Quality Indicator Program (NMAC QI program) for residential aged care was introduced in 2019, but it does not cover home care.6 The NMAC QI program requires providers to report to the Department of Health and Aged Care on fourteen quality indicators in eleven domains every three months. Its reports describe differences by state and remoteness category and annual changes in the indicators. Five of the NMAC QI program indicators are included in the public reporting Star Ratings program.6,7 We have raised concerns, however, about reporting only by aggregate facility level performance, not adjusting assessments for risk, and the provider reporting burden.8 Complementary programs for evaluating and informing the care of older people in long term care are needed.8 In the United States, at least five major organisations regularly monitor and report on the quality of hospital inpatient care, complementing the reports of the Centers for Medicare and Medicaid Services.9
In 2017, the Registry of Senior Australians (ROSA) was established to integrate population‐level health and aged care datasets from across Australia, facilitating the evaluation of the quality of aged care services. The ROSA outcome monitoring system, based on the ROSA data platform, is a pragmatic and low burden quality and safety monitoring and benchmarking system led by academics, clinicians, aged care providers, and aged care user representatives; it uses twelve risk‐adjusted quality and safety indicators for residential aged care, and fifteen for home care package services.10,11,12 The ROSA outcome monitoring system provides risk‐adjusted estimates that enable comparisons of care quality for aged care residential facilities and home care services, includes indicators that are not nationally monitored and indicator benchmarking information, and regularly assesses variation between providers in care quality. It can provide national evaluations of deidentified facilities and home care package services every two years (when new data are integrated) that can be used for population‐level evaluation of quality of care. In South Australia, annual facility and home care service reports are available to individual aged care providers.10 ROSA outcome monitoring system measures have been used by the Royal Commission into Aged Care Quality and Safety (2018–21)13,14,15,16,17 and in several national studies.18,19
In this study, we used the ROSA outcome monitoring system to examine the prevalence of and variation in indicators of the quality and safety of care provided to older Australians who received subsidised long term care during 2019, by type of care (residential aged care or home care packages).
Methods
We undertook a cross‐sectional population‐based study, analysing ROSA National Historical Cohort data.10 Briefly, the ROSA National Historical Cohort integrates deidentified data from national and state‐based aged care, health care, and social welfare datasets for older Australians who were assessed for subsidised aged care eligibility or who received aged care services during 1 January 2002 – 30 June 2020 (with data updates every two years). The included datasets are the Australian Institute of Health and Welfare National Aged Care Data Clearinghouse datasets, the National Death Index (NDI), the Australian Department of Social Services Data Over Multiple Individual Occurrences (DOMINO) database, the Australian Department of Health and Aged Care Medicare Benefits Schedule (MBS) and Pharmaceutical Benefits Scheme (PBS) databases, and South Australian, New South Wales, Victorian, and Queensland hospitalisations and emergency department (ED) presentations databases.10 For the study reported in this article, we analysed linked data from the National Aged Care Data Clearinghouse datasets and the NDI, MBS, PBS, and state‐level hospital and ED datasets.
Aged care services are subsidised by the Australian Department of Health and Aged Care. Residential aged care facilities provide accommodation, personal care, and nursing and general health care services.20 The Home Care Packages program provides a tailored, coordinated package of services to enable people to remain living at home.21
Study cohort
We analysed data for all people aged 65 years or older (Aboriginal or Torres Strait Islander people: 50 years or older) who received subsidised long term aged care during the 2019 calendar year. Seven of the ROSA indicators relied on the hospital use data available only for four states (residential care: 213446 people, 87.2% of people in cohort; home care: 129852 people, 87.1% of people in cohort). We did not include Department of Veterans’ Affairs concession card holders for MBS‐based quality indicators — home medicines review and chronic disease management plans — as their access to MBS‐subsidised services is different.
Outcomes
The twelve ROSA outcome monitoring system quality and safety indicators for residential and fifteen for home care include eight that are monitored in all states (antipsychotic use, chronic opioid use, high sedative load, antibiotic use, premature mortality; home care only: chronic disease management plan, home medicines review, waiting time for home care package services longer than six months) and seven that are monitored in the four states for which hospital use data are available (fall‐related hospitalisations, fractures, medication‐related hospitalisations, ED presentations, pressure injury‐related hospitalisations, weight loss or malnutrition‐related hospitalisations; people with dementia only: delirium or dementia‐related hospitalisations) (Supporting Information, tables 1 and 2).11,12,22 The three indicators for home care only were included following recommendations from the Royal Commission into Aged Care Quality and Safety.11
Statistical analyses
We summarise as descriptive statistics the care recipient characteristics by type of care (residential or home care) and the number of facilities and home care services during 2019, nationally and for the four states for which hospitalisation‐related indicators can be assessed. For each indicator, we report estimated risk‐adjusted prevalence or incidence with the 95% confidence interval (CI). All indicator estimates were adjusted for age, sex (female or male), and number of health conditions, as well as for indicator‐specific covariates (eg, dementia, osteoporosis).11,12,22 The probability of a specific event (expected rate) was estimated using logistic regression models that included the relevant covariates. The risk‐adjusted rate was the ratio of the observed to expected probability multiplied by the national rate.
We report quality variation by facility or home care service level, and the proportion of indicator outlier values (outside the 95% CI for the mean value; potentially indicating suboptimal care), by long term care type. For chronic disease management plans and home medicines review, we deemed performance below the lower bound of the 95% CI to potentially indicate suboptimal care.
Facility or home care service level quality variations for each indicator were examined using funnel plots, stratified by facility or provider ownership type (private, not‐for‐profit, government), as care quality varies significantly by ownership type.19 The expected variation in quality was shown by the 95% CI for the indicator mean for facilities or home care services; the Wilson method for binomially distributed estimates was used to estimate CIs. Only facilities or home care services including twenty or more people are displayed in funnel plots to limit identifiability. All analyses were performed using SAS 9.4. We report our study according to the Reporting of studies conducted using observational routinely collected health data (RECORD) reporting checklist.23
Ethics approval
The study was approved by the University of South Australia Human Research Ethics Committee (200489), the Australian Institute of Health and Welfare Ethics Committee (EO2022/4/1376), the South Australian Department for Health and Wellbeing Human Research Ethics Committee (HREC/18/SAH/90), and the New South Wales Population and Health Services Research Ethics Committee (2019/ETH12028).
Results
In 2019, 244754 people received residential aged care in 2746 facilities and 149104 people received home care packages from 833 providers through 2407 home care services. Among residential facility residents, 159758 (65.3%) were women, 135571 (55.4%) had diagnoses of dementia, and their median age was 86 years (interquartile range [IQR], 80–91 years). Among home care recipients, 96300 (64.6%) were women, 28026 (18.8%) had diagnoses of dementia, and the median age was 83 years (IQR, 77–88 years) (Box 1).
National indicators (eight indicators)
The national proportions of people with medication‐related indicators were larger for facility residents than home care recipients: antibiotic use (residents, 64.5% [95% CI, 64.3–64.7%]; home care, 57.3% [95% CI, 57.1–57.6%]), high sedative load (residents: 45.2% [95% CI, 45.0–45.4%]; home care: 29.8% [95% CI, 29.6–30.1%]), chronic opioid use (residents: 26.1% [95% CI, 25.9–26.3%]; home care: 15.4% [95% CI, 15.2–15.6%]), and antipsychotic use (residents: 21.4% [95% CI 21.3–21.6%]; home care: 7.0% [95% CI, 6.9–7.2%]). The national premature mortality proportion was also larger for aged care facility residents (0.7% [95% CI, 0.6–0.7%]) than for those who received home care (0.3% [95% CI, 0.2–0.3%]) (Box 2).
The proportions of outliers (beyond the upper 95% CI bound) were larger for residential facilities than home care services for antibiotic use (facilities, 368 of 2638 [13.9%]; services, 118 of 1507 [7.8%]), high sedative load (facilities, 322 of 2606 [12.4%]; services, 57 of 1488 [3.8%]), chronic opioid use (facilities, 272 of 2628 [10.4%]; services, 85 of 1492 [5.7%]), and antipsychotic use (facilities, 176 of 2617 [6.7%]; services, 13 of 1502 [0.9%]) (Box 3, Box 4).
For home care‐only indicators, 81.8% (95% CI, 81.4–82.1%) of people waited more than six months for services, 43.2% (95% CI, 42.9–43.5%) received chronic disease management plans, and 3.2% (95% CI, 3.1–3.3%) had home medicines reviews (Box 2). The estimated proportions of care services below the lower 95% CI bound were 179 of 1388 (12.9%) for chronic disease management plans and 427 of 1477 for home medicines reviews (28.9%) (Box 3).
State‐based indicators (seven indicators)
The proportions of home care recipients who received hospital care were larger than for facility residents for ED presentations (home care, 43.2% [95% CI, 43.0–43.5%]; residents, 37.8% [95% CI, 37.6–38.0%]) and hospitalisations with delirium/dementia (home care, 10.5% [95% CI, 10.1–10.9%]; residents, 4.3% [95% CI, 4.2–4.4%]), weight loss/malnutrition (home care, 5.5% [95% CI, 5.3–5.6%]; residents, 2.5% [95% CI, 2.4–2.5%]), or medication‐related events (home care, 4.6% [95% CI, 4.5–4.7%]; residents, 2.4% [95% CI, 2.3–2.5%]). The proportion of facility residents with fall‐related hospitalisations was larger than for home care recipients (residents, 13.6% [95% CI, 13.5–13.7%]; home care, 12.3% [95% CI, 12.1–12.5%]). The proportions of facility residents and home care recipients was similar for fractures (residents, 5.5% [95% CI, 5.4–5.6%]; home care, 5.4% [95% CI, 5.3–5.5%]) and pressure injury‐related hospitalisations (residents, 3.4% [95% CI, 3.3–3.5%]; home care, 3.5% [95% CI, 3.4–3.6%]) (Box 2).
The proportions of outliers (beyond the upper 95% CI bound) were larger for residential facilities than home care services for ED presentations (facilities, 442 of 2295 [19.3%]; services, 188 of 1276 [14.7%]), falls (facilities, 203 of 2290 [8.9%]; services, 60 of 1276 [4.7%]), pressure injury‐related hospitalisations (facilities, 79 of 2295 [3.4%]; services, 30 of 1276 [2.4%]), fractures (facilities, 42 of 2290 [1.8%]; services, 12 of 1276 [0.9%]), and delirium/dementia‐related hospitalisation (facilities, 29 of 1998 [1.5%]; services, two of 350 [0.6%]). The proportion of outliers (beyond upper 95% CI bound) was larger for home care services than for residential facilities for weight loss/malnutrition‐related hospitalisations (services, 41 of 1264 [3.2%]; facilities, 50 of 2287 [2.2%]) (Box 3, Box 4).
Discussion
In our analysis of integrated aged care and health care data, we found significant variation in the quality of care provided to long term care recipients in residential facilities or at home in Australia, with several low and high performing providers with respect to waiting time for services (home care only), ED presentations, antibiotic use, high sedative load, and home medicines reviews and chronic disease management plans (both home care only).
The prevalence of medication‐related indicators in facilities in 2019 was high: 21.4% of facility residents received antipsychotic medications, 45.2% had high sedative loads, 64.5% received antibiotics, and 26.1% had received opioid medications for longer periods. The estimated proportion of facility residents who received antipsychotics, based on population medication dispensing data, was consistent with NMAC QI program findings that about 20% of aged care facility residents in Australia received antipsychotics during July 2021 – December 2022,25 and was similar to the proportion reported for aged care facility residents in Canada (adjusted antipsychotic use without psychosis: 20.3%).13 In an earlier study, we found little change between 2014–2015 and 2018–2019 in the annual estimated national incidence of antibiotic, chronic opioid, or antipsychotic use or high sedative load among people in residential aged care.26 However, a recent United States study found that chronic opioid use by facility residents had declined from 14.1% in 2014 to 11.4% in 2018.27 While pain in aged care facility residents may often be missed or undertreated, with as many as 20% of people who experience pain not receiving analgesics,28 the prevalence of opioid prescribing is high; a systematic review found that at least 27% of aged care residents in Australia were dispensed at least one opioid for more than twelve months.28
The prevalence of medication‐related indicators among home care recipients in Australia was relatively stable during 2016–2019.11 Opioid (18% reduction, 2016‐17 to 2020‐2129) and antimicrobial medicines dispensing (9% reduction, 2013‐14 to 2016‐1730) declined among people of all ages living in the community while antipsychotic dispensing dropped by 11% among those aged 65 years and over) from 2016–17 to 2020–21.31 These changes contrast with our findings, suggesting differences in medication management and health care use between older Australians in general and those receiving residential or home‐based care.
We found that only 3.2% of home care recipients had government‐subsidised home medicines reviews and 43.2% received chronic disease management plans during 2019, two clinical interventions that can improve care and avert unnecessary hospitalisations.32,33,34,35 Our findings are consistent with earlier assessments of the use of these services by people receiving home care and other older people.30,36 However, national variation in the use of these services was quite substantial, suggesting that a nationally consistent and systematic approach to promoting them for people with home care packages is needed.36 The Department of Health and Aged Care has therefore announced changes to the chronic condition management plan (eg, a single general practitioner chronic condition management plan) to encourage regular reviews, which could reduce variation in quality of care.37
For the state‐based indicators, the estimated proportions of people in residential care admitted to hospital with pressure injuries (3.4%), falls (13.6%), or weight loss or malnutrition (2.5%) were smaller than those reported by the NMAC QI Program, whose estimates did not change markedly across the July 2021 – December 2022 reporting period: about 6% of residents had one or more pressure injuries, 2% falls with major injuries, and 9–11% had unplanned weight loss over three months.25 The prevalence of pressure injury‐related hospitalisation in our study was lower than reported by a study in eight European countries (6–13% within six months).13 The ROSA outcome monitoring system uses numbers of hospitalisations to measure these quality indicators, probably reflecting more severe events that require or are associated with hospitalisation. The estimated proportions of home care recipients admitted to hospital because of falls (12.3%) was lower than that reported for home care recipients in Canada (26.4%); for weight loss or malnutrition‐related hospitalisations our estimate (6%) was similar to that reported in Canada (7%).13 In our study, the proportions of home care recipients who presented to ED, were hospitalised because of weight loss or malnutrition, medication‐related events, or delirium and dementia were larger than for aged care facility residents. However, differences between care types in quality indicator performance should be interpreted cautiously, as differences in advanced care plans and care goals may contribute to variations in hospital use‐related indicators. Further, residual confounding after risk adjustment is possible, and understanding how care needs influence care quality outcome measures is important for improving individualised care.
We found considerable national variation in care quality among residential and home care providers in 2019. The three hospitalisation‐related indicators with the largest proportions of outlier facilities (upper 95% CI bound) were ED presentations, and falls‐ and pressure injury‐related hospitalisations. The variation in pressure injury‐related hospitalisations of facility residents was less marked than found by another Australian study,38 but the variation in ED presentations was similar to that reported in Ontario.39 Among the nationally assessable indicators, variability in the use of antibiotics and antipsychotics, and in high sedative load, is concerning; the proportion of outlier facilities with respect to antipsychotic and antibiotic use increased between 2016 and 2019, but those for high sedative load and chronic opioid use were stable.12 In contrast, a United States study found that variation in chronic opioid use in aged care homes increased by 16% between 2014 and 2018.27 Similar rates of antipsychotic prescribing variation in United States aged care facilities were reported in 2010.40 Significant variation in antibiotic use has also been reported in Europe and the United States.41
The marked national variations in antibiotic use, ED presentations, high sedative load, longer waiting times for home care services, home medicines reviews, and chronic disease management plans suggest these areas could benefit from targeted quality improvement strategies. Adherence to clinical care standards and clinical practice guidelines can promote high quality care and reduce care variation. For antibiotic use, adherence to antimicrobial stewardship guidelines can minimise inappropriate prescribing. Variation in high sedative load can be reduced by safe prescribing frameworks and adherence to appropriate psychotropic medicine use guidelines for aged care.42 For ED presentations, improving outreach and inreach multidisciplinary services, such as the 24‐hour on‐call services recommended by the Aged Care Royal Commission,4 could ensure timely care and urgent assessment and management.4 The new Support at Home program, which aims to reduce waiting time for services to less than three months and improve allied health and restorative care access, could help reduce variation in care quality.43
Limitations
Our study evaluated the prevalence of and variations in indicators of quality of aged care in 2019, prior to the coronavirus disease 2019 (COVID‐19) pandemic and the Royal Commission into Aged Care Quality and Safety (2018–21) and subsequent national reforms. Integrating aged care and health care data is time‐intensive, typically requiring two to three years to obtain fully linked datasets from the various custodians for analysis. Although our access to more recent data has improved considerably, with full data linkage obtained in 2023, the inherent delay in data linkage remains and national improvement is required. For the hospitalisation‐related indicators, data were available from only four states, however they accounted for 87% of hospitalisations of aged care recipients during 2019.10 Data for admissions to private hospitals in South Australia were not available. However, 92% of emergency hospital admissions in Australia during 2017–18 were to public hospitals44 and private hospitals accounted for only 4% of all non‐admitted events during 2016–17.45 We probably underestimated certain indicators that rely on hospital use data for ascertainment, as only more severe cases would be recorded during the hospitalisation (eg, with weight loss/malnutrition). Clinical indications for medication‐ and service‐related indicators were not available. Further, our approach to identifying outliers has methodological limitations; for example, it probably identifies more lower outliers than when using a continuity correction. However, it is a conservative approach and unlikely to incorrectly identify providers with higher than expected rates.
Conclusion
We found significant variations in quality measures of long term aged care for older people in Australia, particularly with regard to waiting time for home care services, ED presentations, antibiotic use, high sedative load, home medicines reviews, and chronic disease management plans. We also found differences in quality and variations in quality between residential and home‐based long term care. Our findings highlight national performance on key quality measures, and we have identified areas of long term aged care that could particularly benefit from targeted quality improvement strategies.
Box 1 – Characteristics of older Australians who received subsidised long term aged care services during the 2019 calendar year, by care type
|
Characteristics |
Residential care |
Home care |
|||||||||||||
|
|
|||||||||||||||
|
Number of people |
244754 |
149104 |
|||||||||||||
|
Number of facilities/services |
2746 |
2407 |
|||||||||||||
|
People per facility or service, median (IQR) |
79 (51–121) |
32 (11–75) |
|||||||||||||
|
Sex (women) |
159758 (65.3%) |
96300 (64.6%) |
|||||||||||||
|
Age (years), median (IQR) |
86 (80–91) |
83 (77–88) |
|||||||||||||
|
State |
|
|
|||||||||||||
|
New South Wales |
81126 (33.1%) |
50679 (34.0%) |
|||||||||||||
|
Victoria |
64777 (26.5%) |
37965 (25.5%) |
|||||||||||||
|
Queensland |
46381 (19.0%) |
30604 (20.5%) |
|||||||||||||
|
South Australia |
21456 (8.8%) |
10604 (7.1%) |
|||||||||||||
|
Other |
31014 (12.7%) |
19252 (12.9%) |
|||||||||||||
|
Health conditions, median (IQR) |
5 (3–7) |
5 (3–7) |
|||||||||||||
|
Dementia |
135571 (55.4%) |
28026 (18.8%) |
|||||||||||||
|
Remoteness24 |
|
|
|||||||||||||
|
Major cities |
170959 (69.8%) |
102677 (68.9%) |
|||||||||||||
|
Inner regional |
53352 (21.8%) |
35552 (23.8%) |
|||||||||||||
|
Outer regional |
18441 (7.5%) |
9419 (6.3%) |
|||||||||||||
|
Remote or very remote |
2002 (0.9%) |
1400 (0.9%) |
|||||||||||||
|
Missing data |
0 |
56 (<0.1%) |
|||||||||||||
|
Facility/service ownership |
|
|
|||||||||||||
|
Government |
9757 (4.0%) |
9603 (6.4%) |
|||||||||||||
|
Not‐for‐profit |
138386 (56.5%) |
105768 (70.9%) |
|||||||||||||
|
Private |
96611 (39.5%) |
33733 (22.6%) |
|||||||||||||
|
|
|||||||||||||||
|
IQR = interquartile range. |
|||||||||||||||
Box 2 – Registry of Senior Australians outcome monitoring system quality and safety indicators, 2019: adjusted prevalence* (with 95% confidence intervals) by long term aged care type†
|
|
Residential care |
Home care |
|||||||||||||
|
Indicator |
Denominator |
Numerator |
Adjusted proportion |
Denominator |
Numerator |
Adjusted proportion |
|||||||||
|
|
|||||||||||||||
|
Australia |
|
|
|
|
|
|
|||||||||
|
Number of people |
|
|
244419‡ |
|
|
149104 |
|||||||||
|
Antibiotics |
244419 |
157672 |
64.5% (64.3–64.7%) |
149104 |
85502 |
57.3% (57.1–57.6%) |
|||||||||
|
High sedative load |
224622§ |
101616 |
45.2% (45.0–45.4%) |
142 590§ |
42530 |
29.8% (29.6–30.1%) |
|||||||||
|
Chronic opioid use |
236989§ |
61884 |
26.1% (25.9–26.3%) |
144 442§ |
22293 |
15.4% (15.2–15.6%) |
|||||||||
|
Antipsychotics |
231862§ |
49731 |
21.4% (21.3–21.6%) |
147 224§ |
10358 |
7.0% (6.9–7.2%) |
|||||||||
|
Premature mortality |
244419 |
1639 |
0.7% (0.6–0.7%) |
149104 |
373 |
0.3% (0.2–0.3%) |
|||||||||
|
Waiting time longer than six months for home care package services¶ |
|
|
— |
45544§ |
37233 |
81.8% (81.4–82.1%) |
|||||||||
|
Chronic disease management plan¶ |
|
|
— |
123 405§ |
53291 |
43.2% (42.9–43.5%) |
|||||||||
|
Home medicines review¶ |
|
|
— |
141 749§ |
4526 |
3.2% (3.1–3.3%) |
|||||||||
|
New South Wales, Victoria, Queensland, South Australia |
|
|
|
|
|
|
|||||||||
|
Number of people |
|
|
213446‡ |
|
|
129852 |
|||||||||
|
Emergency department presentations |
213446 |
15009 |
37.8% (37.6–38.0%) |
129852 |
56155 |
43.2% (43.0–43.5%) |
|||||||||
|
Delirium or dementia‐related hospitalisations |
117472§ |
5010 |
4.3% (4.2–4.4%) |
23833§ |
2502 |
10.5% (10.1–10.9%) |
|||||||||
|
Weight loss or malnutrition‐related hospitalisations |
206975§ |
5129 |
2.5% (2.4–2.5%) |
125808§ |
6861 |
5.5% (5.3–5.6%) |
|||||||||
|
Medication‐related hospitalisations |
213446 |
5117 |
2.4% (2.3–2.5%) |
129852 |
5997 |
4.6% (4.5–4.7%) |
|||||||||
|
Pressure injury‐related hospitalisations |
213446 |
7308 |
3.4% (3.3–3.5%) |
129852 |
4582 |
3.5% (3.4–3.6%) |
|||||||||
|
Fall‐related hospitalisations |
213446 |
28962 |
13.6% (13.5–13.7%) |
129852 |
15982 |
12.3% (12.1–12.5%) |
|||||||||
|
Fractures |
213446 |
11782 |
5.5% (5.4–5.6%) |
129852 |
7003 |
5.4% (5.3–5.5%) |
|||||||||
|
|
|||||||||||||||
|
* Adjusted for covariates listed in the Supporting Information, tables 1 and 2. † The adjusted prevalence of indicators by care type and state are included in the Supporting Information, table 3. ‡ Multiple residential aged care episodes for the same resident and facility are combined. § After indicator‐specific exclusions (Supporting Information, tables 1 and 2). ¶ Home care only indicators. |
|||||||||||||||
Box 3 – Number and proportions of aged care residential facilities or home care services (used by twenty or more people in the ROSA National Historical Cohort) with indicator values outside the 95% confidence interval for the indicator, 2019, by type of long term care†
|
Indicator |
Residential care |
Home care |
|||||||||||||
|
Facilities |
Beyond upper 95% CI bound |
Below lower 95% CI bound |
Services |
Beyond upper 95% CI bound |
Below lower 95% CI bound |
||||||||||
|
|
|||||||||||||||
|
National |
|
|
|
|
|
|
|||||||||
|
Total number of facilities/services |
2746 |
— |
— |
2407 |
— |
— |
|||||||||
|
Antibiotics |
2638 |
368 (13.9%) |
311 (11.8%) |
1507 |
118 (7.8%) |
109 (7.2%) |
|||||||||
|
High sedative load |
2606 |
322 (12.4%) |
424 (16.3%) |
1488 |
57 (3.8%) |
139 (9.3%) |
|||||||||
|
Chronic opioid use |
2628 |
272 (10.4%) |
413 (15.7%) |
1492 |
85 (5.7%) |
219 (14.7%) |
|||||||||
|
Antipsychotics |
2617 |
176 (6.7%) |
372 (14.2%) |
1502 |
13 (0.9%) |
161 (10.7%) |
|||||||||
|
Premature mortality |
2638 |
3 (0.1%) |
1517 (57.5%) |
1507 |
1 (0.1%) |
1234 (81.9%) |
|||||||||
|
Waiting time for home care services‡ |
— |
— |
— |
687 |
120 (17.5%) |
67 (9.8%) |
|||||||||
|
Chronic disease management plan‡ |
— |
— |
— |
1388 |
140 (10.1%) |
179 (12.9%) |
|||||||||
|
Home medicines review‡ |
— |
— |
— |
1477 |
21 (1.4%) |
427 (28.9%) |
|||||||||
|
New South Wales, Victoria, Queensland, South Australia |
|
|
|
|
|
|
|||||||||
|
Total number of facilities/services |
2690 |
— |
— |
2030 |
— |
— |
|||||||||
|
Emergency department presentations |
2295 |
442 (19.3%) |
518 (22.6%) |
1276 |
188 (14.7%) |
188 (14.7%) |
|||||||||
|
Delirium or dementia‐related hospitalisations |
1998 |
29 (1.5%) |
472 (23.6%) |
350 |
2 (0.6%) |
42 (12.0%) |
|||||||||
|
Weight loss or malnutrition‐related hospitalisations |
2287 |
50 (2.2%) |
694 (30.3%) |
1264 |
41 (3.2%) |
250 (19.8%) |
|||||||||
|
Medication‐related hospitalisations |
2295 |
35 (1.5%) |
607 (26.4%) |
1276 |
20 (1.6%) |
231 (18.1%) |
|||||||||
|
Pressure injury‐related hospitalisations |
2295 |
79 (3.4%) |
592 (25.8%) |
1276 |
30 (2.4%) |
319 (25.0%) |
|||||||||
|
Fall‐related hospitalisations |
2290 |
203 (8.9%) |
462 (20.2%) |
1276 |
60 (4.7%) |
172 (13.5%) |
|||||||||
|
Fractures |
2290 |
42 (1.8%) |
320 (14.0%) |
1276 |
12 (0.9%) |
176 (13.8%) |
|||||||||
|
|
|||||||||||||||
|
CI = confidence interval. † The numbers and proportions of outliers by care type and state are included in the Supporting Information, table 4. ‡ Home care only indicators. |
|||||||||||||||
Box 4 – Distribution of adjusted antipsychotic use and emergency department presentation indicators* among aged care residential facilities and home care services (used by twenty people or more in the Registry of Senior Australians (ROSA) National Historical Cohort), 2019, by ownership type†
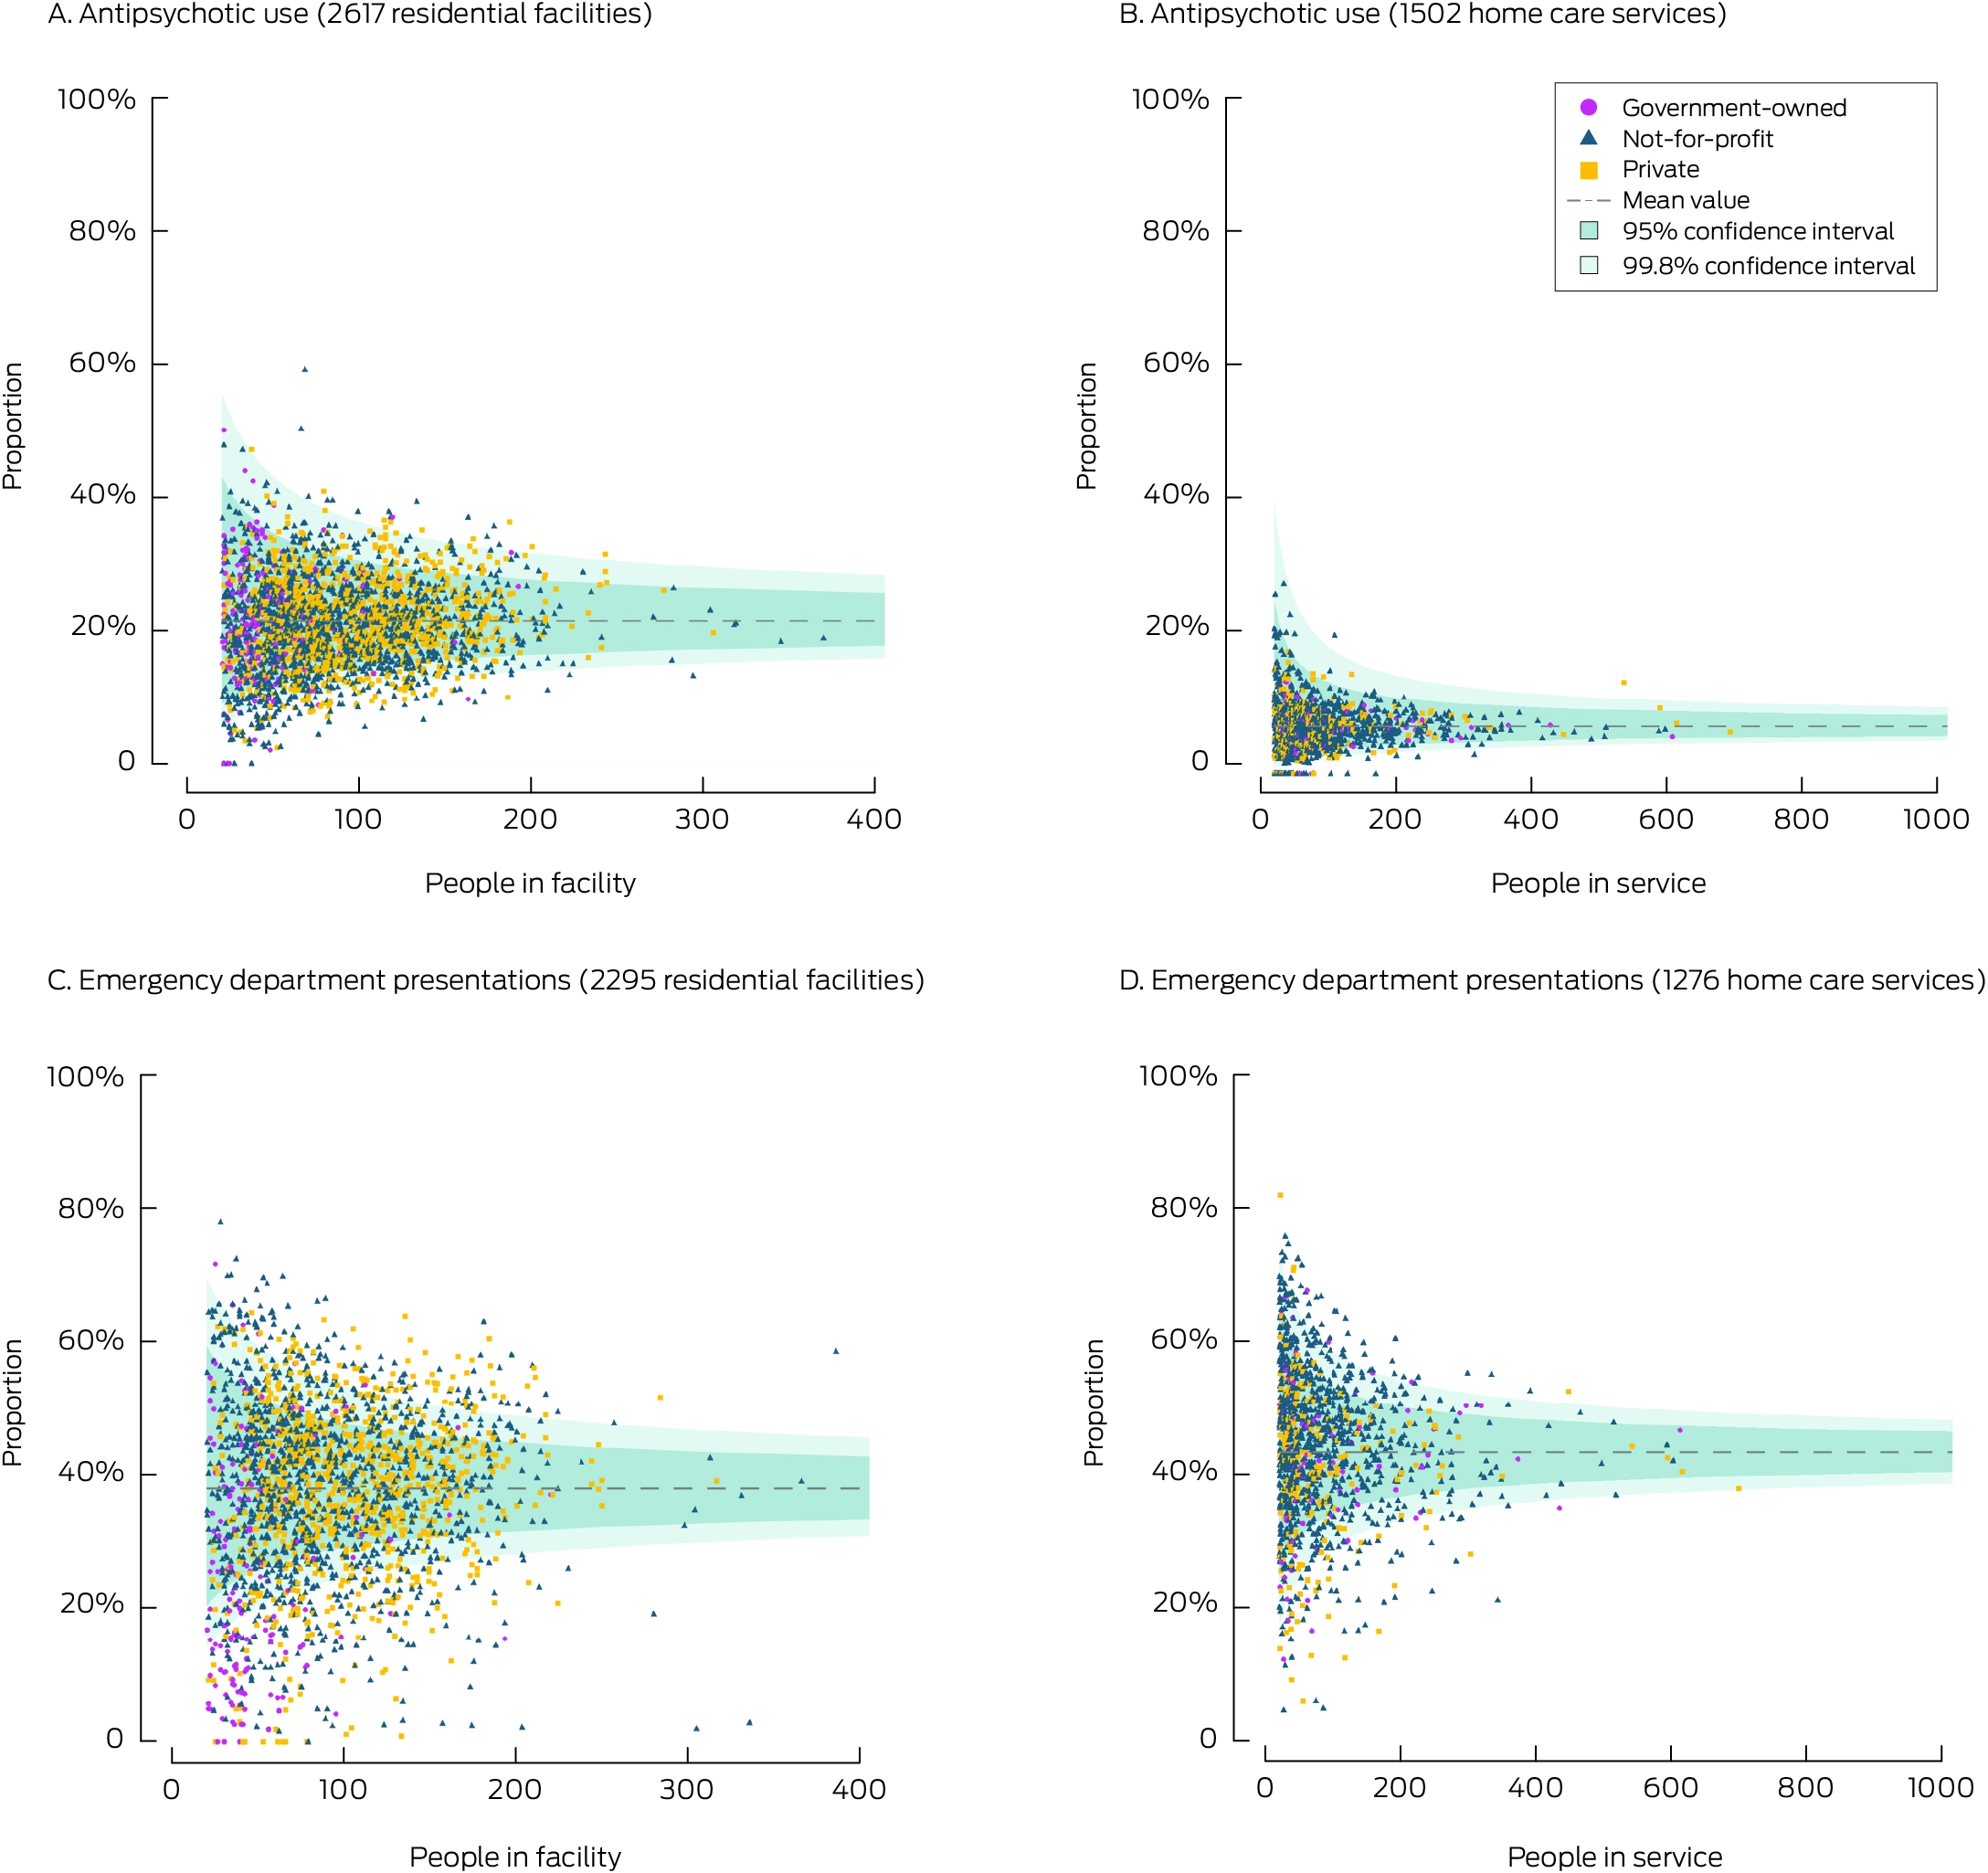
* Adjusted for covariates listed in the Supporting Information, tables 1 and 2.† We selected one indicator each from the medication‐related and hospitalisation‐related indicators for this figure. The funnel plots for the indicators not shown here are included in the Supporting Information, figures 1 and 2.
Competing interests
Janet K Sluggett is a non‐executive director of Southern Cross Care SA, NT, VIC, and is a pharmacist accredited to perform comprehensive medication reviews.
Acknowledgements
We acknowledge the Registry of Senior Australians’ (ROSA) Steering Committee, the Consumer and Community Advisory Committee, the Aboriginal and Torres Strait Islander Advisory Committee, the ROSA Research Centre team based at the South Australian Health and Medical Research Institute (SAHMRI), and the Caring Futures Institute, College of Nursing and Health Sciences at Flinders University for ensuring the success of the ROSA and supporting this study. We also acknowledge the South Australian Department for Innovation and Skills (2017–2021), which provided support for establishing ROSA; the Australian Medical Research Future Fund (2021–2024: PHRDI000009; 2024–2029: NCRI000109), and ROSA collaborating partners (SAHMRI, ECH Inc, Silver Chain, Bolton Clarke) for ongoing support; the Australian Institute of Health and Welfare for the linkage and construction of input data; SA Health, the New South Wales Ministry of Health, the Victorian Department of Health, and Queensland Health for providing the state‐based hospital admissions and emergency department data used in the ROSA, with linkage by the AIHW, the Centre for Health Record Linkage (CHeReL), the Centre for Victorian Data Linkage (Victorian Department of Health), SA‐NT DataLink, and the Queensland Health Statistical Services Branch. We acknowledge Marjorie Schulze, the ROSA consumer representative and Tesfahun C Eshetie's consumer mentor for comments on the study findings. The funders played no role in the study design, data collection and analysis, decision to publish, or preparation of the manuscript.
References
- Australian Department of Health and Aged Care. 2022–23 report on the operation of the Aged Care Act 1997. https://www.gen‐agedcaredata.gov.au/getmedia/360dc871‐b22d‐4c10‐b66b‐e9d914afe70c/Health‐and‐Aged‐Care‐ROACA‐2022‐23_Web.pdf (viewed Jan 2024).
- Royal Commission into Aged Care Quality and Safety. Final report. Volume 2: the current system. 1 Mar 2021. https://www.royalcommission.gov.au/system/files/2021‐03/final‐report‐volume‐2.pdf (viewed Mar 2025).
- Royal Commission into Aged Care Quality and Safety. A history of aged care reviews [briefing paper]. 28 Oct 2019. https://apo.org.au/sites/default/files/resource‐files/2019‐10/apo‐nid265806.pdf (viewed Mar 2025).
- Royal Commission into Aged care Quality and Safety. Final report. Volume 1: Summary and recommendations. 1 Mar 2021. https://www.royalcommission.gov.au/aged‐care/final‐report (viewed Jan 2025).
- Australian Consortium for Aged Care. ACAC Quality Indicator Repository overview: first release (version 1.0.0). Mar 2025. https://agedcareconsortium.com.au/resources/common/ACAC‐Quality‐Indicator‐Repository‐Overview‐FINAL‐WEBSITE_V1.0.0_March25.pdf (viewed June 2025).
- Australian Department of Health and Aged Care. National aged care mandatory quality indicator program manual 3.0 and 4.0: part A. 8 Nov 2023. https://www.health.gov.au/resources/publications/national‐aged‐care‐mandatory‐quality‐indicator‐program‐manual‐30‐part‐a?language=en (viewed Jan 2025).
- Australian Department of Health and Aged Care. Star Ratings provider manual 2.3. Updated 6 Mar 2025. https://www.health.gov.au/sites/default/files/2025‐03/star‐ratings‐provider‐manual.pdf (viewed Mar 2024).
- Inacio MC, Eshetie TC, Caughey GE, et al. Quality and safety in residential aged care: an evaluation of a national quality indicator programme. Intern Med J 2023; 53: 2073‐2078.
- Agency for Healthcare Research and Quality. Major hospital quality measurement sets. Updated Feb 2023. https://www.ahrq.gov/talkingquality/measures/setting/hospitals/measurement‐sets.html (viewed Jan 2024).
- Inacio MC, Caughey GE, Wesselingh S; ROSA Research Team and Steering Committee Members. Registry of Senior Australians (ROSA): integrating cross‐sectoral information to evaluate quality and safety of care provided to older people. BMJ Open 2022; 12: e066390.
- Caughey GE, Lang CE, Bray SCE, et al. Quality and safety indicators for home care recipients in Australia: development and cross‐sectional analyses. BMJ Open 2022; 12: e063152.
- Inacio MC, Lang C, Caughey GE, et al. The Registry of Senior Australians outcome monitoring system: quality and safety indicators for residential aged care. Int J Qual Health Care 2020; 32: 502‐510.
- Caughey G, Lang C, Bray S, et al. International and national quality and safety indicators for aged care. Report prepared for the Royal Commission into Aged Care Quality and Safety [research paper 8]. Aug 2020. Archived: https://nla.gov.au/nla.obj‐2924408596/view (viewed Mar 2024).
- Royal Commission into Aged Care Quality and Safety. The cost of residential aged care [research paper 9]. Aug 2020. Archived: https://nla.gov.au/nla.obj‐2924408652/view (viewed Mar 2024).
- Royal Commission into Aged Care Quality and Safety. Residential care quality indicator profile [research paper 15]. Nov 2020. Archived: https://trove.nla.gov.au/work/246455657 (viewed Mar 2024).
- Royal Commission into Aged Care Quality and Safety. Hospitalisations in Australian aged care: 2014/15 to 2018/19 [research paper 21]. Feb 2021. Archived: https://nla.gov.au/nla.obj‐2924408762/view (viewed Mar 2024).
- Royal Commission into Aged Care Quality and Safety. Does the quality of residential aged care vary with residents’ financial means? [research paper 19]. Feb 2021. Archived: https://nla.gov.au/nla.obj‐2924408770/view (viewed Mar 2024).
- Ma N, Sutton N, Yang JS, et al. The quality effects of agency staffing in residential aged care. Australas J Ageing 2023; 42: 195‐203.
- Yong J, Yang O, Zhang Y, Scott A. Ownership, quality and prices of nursing homes in Australia: why greater private sector participation did not improve performance. Health Policy 2021; 125: 1475‐1481.
- Australian Department of Health and Aged Care. Residential aged care program. Updated 2 Apr 2025. https://www.health.gov.au/our‐work/residential‐aged‐care (viewed Apr 2025).
- Australian Department of Health and Aged Care. Home care packages program. Updated 7 Mar 2025. https://www.health.gov.au/our‐work/home‐care‐packages‐program (viewed Mar 2025).
- Registry of Senior Australians. Registry of Senior Australians (ROSA) Research Centre. In: Registry of Senior Australians (ROSA) Research Centre. Undated. https://sahmri.org.au/research/programs/registry‐centre/groups/rosa/rosa‐oms (viewed Mar 2024).
- Benchimol EI, Smeeth L, Guttmann A, et al. RECORD Working Committee. The REporting of studies Conducted using Observational Routinely‐collected health Data (RECORD) statement. PLoS Med 2015; 12: e1001885.
- Australian Bureau of Statistics. Australian Statistical Geography Standard (ASGS), volume 5: remoteness structure, July 2016 (1270.0.55.005). 16 Mar 2018. https://www.abs.gov.au/ausstats/abs@.nsf/mf/1270.0.55.005 (viewed June 2025).
- Australian Institute of Health and Welfare. Measuring quality in aged care: what is known now and what data are coming. In: Australia's welfare 2023; data insights; pp. 215‐250. 7 Sept 2023. https://www.aihw.gov.au/getmedia/f897ee10‐7d55‐4d05‐b8c3‐97a75547063f/aihw‐aus‐246_Chapter_8.pdf (viewed Mar 2024).
- Caughey GE, Sluggett JK, Lang C, et al. National monitoring of medication‐related quality of care in residential aged care: is Australia making progress? J Am Med Dir Assoc 2022; 23: 2034‐2035.
- Mehta HB, Kuo Y‐F, Raji MA, et al. State variation in chronic opioid use in long‐term care nursing home residents. J Am Med Dir Assoc 2021; 22: 2593‐2599.
- Dowd LA, Reynolds L, Cross AJ, et al. A systematic review of opioid prevalence in Australian residential aged care facilities. Australas J Ageing 2022; 41: 501‐512.
- Australian Commission on Safety and Quality in Health Care. Opioid medicines dispensing, all ages, from 2016–17 to 2020–21. 2022. https://www.safetyandquality.gov.au/our‐work/healthcare‐variation/opioid‐medicines‐dispensing‐all‐ages‐2016‐17‐2020‐21 (viewed June 2025).
- Australian Commission on Safety and Quality in Health Care. The third Australian atlas of healthcare variation. 2018. https://www.safetyandquality.gov.au/sites/default/files/migrated/The‐Third‐Australian‐Atlas‐of‐Healthcare‐Variation‐2018.pdf (viewed Mar 2024).
- Australian Commission on Safety and Quality in Health Care. Antipsychotic medicines dispensing, 65 years and over, from 2016–17 to 2020–21. 2002. https://www.safetyandquality.gov.au/our‐work/healthcare‐variation/antipsychotic‐medicines‐dispensing‐65‐years‐and‐over‐2016‐17‐2020‐21 (viewed June 2025).
- Sluggett JK, Caughey GE, Air T, et al. Provision of a comprehensive medicines review is associated with lower mortality risk for residents of aged care facilities: a retrospective cohort study. Age Ageing 2022; 51: afac149.
- Andrew NE, Ung D, Olaiya MT, et al. The population effect of a national policy to incentivize chronic disease management in primary care in stroke: a population‐based cohort study using an emulated target trial approach. Lancet Reg Health West Pac 2023; 34: 100723.
- Vitry AI, Roughead EE, Ramsay EN, et al. Chronic disease management: does the disease affect likelihood of care planning? Aust Health Rev 2012; 36: 419‐423.
- Sluggett JK, Caughey GE, Air T, et al. Medicines use before and after comprehensive medicines review among residents of long‐term care facilities: a retrospective cohort study. BMC Geriatr 2022; 22: 493.
- Sluggett JK, Bell JS, Lang C, et al. Variation in provision of collaborative medication reviews on entry to long‐term care facilities. J Am Med Dir Assoc 2021; 22: 148‐155.
- Australian Department of Health, Disability and Ageing. Upcoming changes to MBS chronic disease management arrangements. Updated 26 Sept 2024. https://www.health.gov.au/our‐work/upcoming‐changes‐to‐mbs‐chronic‐disease‐management‐arrangements (viewed May 2025).
- Jorgensen M, Siette J, Georgiou A, Westbrook JI. Longitudinal variation in pressure injury incidence among long‐term aged care facilities. Int J Qual Health Care 2018; 30: 684‐691.
- Gruneir A, Bronskill SE, Newman A, et al. Variation in emergency department transfer rates from nursing homes in Ontario, Canada. Healthc Policy 2016; 12: 76‐88.
- Chen Y, Briesacher BA, Field TS, et al. Unexplained variation across US nursing homes in antipsychotic prescribing rates. Arch Intern Med 2010; 170: 89‐95.
- Zanichelli V, Monnier AA, Gyssens IC, et al. Variation in antibiotic use among and within different settings: a systematic review. J Antimicrob Chemother 2018; 73: vi17‐vi29.
- Bell S, Bhat R, Brennan S, et al. Clinical practice guidelines for the appropriate use of psychotropic medications in people living with dementia and in residential aged care: summary of recommendations and good practice statements. Apr 2023. https://www.monash.edu/__data/assets/pdf_file/0005/3458417/Clinical‐Practice‐Guideline‐for‐the‐Appropriate‐Use‐of‐Psychotropic‐Medications‐in‐People‐Living‐with‐dementia‐and‐in‐Residential‐Aged‐Care.pdf (viewed Jan 2025).
- Australian Department of Health and Aged Care. Support at Home program handbook. Program details for 1 July 2025. Dec 2024. https://www.health.gov.au/sites/default/files/2025‐02/support‐at‐home‐program‐handbook.pdf (viewed May 2025)
- Australian Institute of Health Welfare. Admitted patient care 2017–18 (HSE 225). 23 May 2019. https://www.aihw.gov.au/reports/hospitals/admitted‐patient‐care‐2017‐18/data (viewed Mar 2024).
- Australian Bureau of Statistics. Hospital output measures in the Australian national accounts: experimental estimates, 2004–05 to 2017–18. 28 Sept 2020. https://www.abs.gov.au/statistics/research/hospital‐output‐measures‐australian‐national‐accounts‐experimental‐estimates‐2004‐05‐2017‐18 (viewed Mar 2024).
Medical Colleges Have an Obligation to Ensure Full Participation in Clinical Quality Registries
Thomas J. Hugh
Getting on the Same Page: Why Australia Needs a National Maternity Early Warning System (MEWS) Chart
Briony A. Cutts, Lucy Bowyer, Nisha Khot, Sandra Lowe, Stefan C. Kane
Data for Equity: Can Linked Administrative Data Inform Pathways to More Equitable Child Health?
Sarah Gray, Shuaijun Guo, Meredith O'Connor, Elodie O'Connor, Katrina Williams, Hannah Badland, Susan Woolfenden, Josie Dickerson, Gerry Redmond, Marnie Downes, Sharon R. Goldfeld
Specialty College Selection: Why Change is Critical to Support a Future Rural Workforce
Matthew R. McGrail, Jenny May AM, Katherine Logan
Differentiated and simplified oral HIV pre‐exposure prophylaxis (PrEP) models hold the key to virtually eliminating HIV transmission in Australia by 2030
Tyson Arapali, Sarah Warzywoda, Anthony K J Smith, Curtis Chan, Timothy R Broady, Erin Sullivan, Catherine MacPhail, Mohamed A Hammoud, Alexander Dowell‐Day, Benjamin R Bavinton
The number of cancer‐related deaths that could be attributable to spatial disparities in survival in Australia, 2010–2019: a retrospective population‐based cohort study
Charlotte K Bainomugisa, Jessica Cameron, Paramita Dasgupta, Peter Baade