




Volume 223 - Issue 4
Estimated carbon emissions for PBS‐subsidised prescription respiratory inhalers, Australia, 2019–2023: a descriptive analysis
Authors: Luise Kazda, Alexandra L Barratt, Sean Docking, Kristen Pickles, Darlene Cox, Ross S Bailie, Kate Wylie and Katy JL Bell
Med J Aust 2025; 223 (4): 214-217. || doi: 10.5694/mja2.52715
Published online: 18 August 2025
Published online: 18 August 2025
Reducing the use of high emissions inhalers is a high priority for decarbonising health care in Australia
The Australian National Health and Climate Strategy1 identifies reducing the use of pressurised, metered dose inhalers as a high priority for decarbonising health care. These high emissions inhalers contain potent greenhouse gases as propellants, producing ten to thirty times as much in carbon dioxide equivalent (CO2e) emissions as low emissions inhalers (dry powder and soft mist inhalers), which are often clinically equivalent.
To investigate the carbon footprint of inhalers dispensed in Australia and subsidised by the Pharmaceutical Benefits Scheme (PBS), we analysed aggregate‐level PBS dispensing data for the period 1 January 2019 – 30 November 2023, based on United Kingdom estimates of emissions per inhaler.2 We aggregated the estimated emissions for all inhalers dispensed by year and type, and summarised age‐standardised population rates of inhaler dispensing. We then conducted time series analyses of monthly values, adjusted for autocorrelation, to derive regression trend lines; we estimated mean monthly percentage changes (MMPCs) using joinpoint regression analysis. For short‐acting β2 agonist inhalers, we assumed that a mean 1.5 inhalers were dispensed per script; in a sensitivity analysis, we assumed a mean of one inhaler was dispensed per script (further details: Supporting Information, part 1). The University of Canberra human research ethics committee exempted the study from formal ethics review (HREC 2024/14042). Access to the data and approval for the publication of findings based on the data were granted by Services Australia as data custodian.
The number of PBS‐subsidised inhalers dispensed increased from 14.4 million in the 2019 calendar year to 15.5 million in 2023 (MMPC, 0.32%; 95% confidence interval [CI], 0.12–0.52%); estimated emissions increased from 217510t to 246934t CO2e (MMPC, 0.46%; 95% CI, 0.22–0.71%). The increased dispensing of inhalers was primarily caused by the increased dispensing of high emissions inhalers, from 8.2 million to 9.2 million (MMPC, 0.43%; 95% CI, 0.22–0.65%); the dispensing of low emissions inhaler increased from 6.2 million to 6.3 million (MMPC, 0.15%; 95% CI, 0.01–0.29%). In 2019, 56.9% of dispensed PBS‐subsidised inhalers were high emission inhalers, and 59.5% in 2023; in each year, they accounted for about 98% of total estimated PBS‐subsidised inhaler‐related emissions (Box 1; Box 2). The sensitivity analysis yielded similar results (Supporting Information, table 2).
Estimated emissions were greatest for short‐acting β2 agonist inhalers (4.8–5.5 million dispensed per year; 2023: 98% in high emissions inhalers; 140558t CO2e, 57% of all inhaler‐related emissions) and combined inhaled corticosteroid/long‐acting β2 agonist inhalers (5.6–6.4 million dispensed per year; 2023: 49% in high emissions inhalers; 83491t CO2e, 34% of all inhaler‐related emissions) (Supporting Information, table 3 and figure 1).
PBS‐subsidised inhaler dispensing rates were higher in non‐metropolitan (2023: 704 per 1000 population) than in metropolitan areas (2023: 450 per 1000 population), but estimated total emissions were higher in metropolitan areas because of the larger numbers of inhalers dispensed (2023: metropolitan, 155878t CO2e; non‐metropolitan: 91010t CO2e). Estimated emissions increased in non‐metropolitan areas during 2019–2023 for both low emissions inhalers (MMPC, 0.29%; 95% CI, 0.17–0.41%) and high emissions inhalers (MMPC, 0.53%; 95% CI, 0.34–0.73%); in metropolitan areas, they increased for high emissions inhalers only (MMPC, 0.43%; 95% CI, 0.16–0.72%) (Supporting Information, table 3).
PBS‐subsidised inhaler dispensing rates were highest in Tasmania (2023: 693 per 1000 population) and South Australia (2023: 632 per 1000 population) and lowest in the Northern Territory (355 per 1000 population) and Western Australia (383 per 1000 population). The proportions of high emissions inhalers dispensed were largest in South Australia (63–65%) and the Northern Territory (59–64%) and smallest in the Australian Capital Territory (53–57%) and Western Australia (52–56%). Total estimated emissions were highest in New South Wales (2023: 78500t CO2e) and Victoria (2023: 62622t CO2e). Emissions increased in all states and territories between 2019 and 2023, primarily because of the increased dispensing of high emissions inhalers; MMPCs ranged from 0.31 (95% CI, 0.04–0.58%) in New South Wales to 0.64 (95% CI, 0.35–0.93%) in Victoria (Supporting Information, table 3).
In 2023, the PBS‐subsidised inhaler dispensing rate was 195 per 1000 people aged 0–19 years (high emissions inhalers, 92%) and 2054 per 1000 people aged 80 years or older (high emissions inhalers, 50%) (Box 3). The age group dispensed the largest proportion of PBS‐subsidised inhalers were people aged 60–79 years (6.4–7.1 million/year; 43–45% of all PBS‐subsidised inhalers dispensed; high emissions inhalers, 50–54%), contributing 100 688t CO2e in 2023 (about 41% of all emissions). Increases in PBS‐subsidised high emissions inhaler dispensing rates (MMPC, 0.34%; 95% CI, 0.03–0.66%) and emissions (MMPC, 0.61%; 95% CI, 0.30–0.91%) were greatest for people aged 80 years or older. PBS‐subsidised dispensing numbers and rates were higher for female than male users (2023: 549 v 462 per 1000 population); the proportions of high emissions inhalers dispensed were larger for female than male users (58–60% v 55–58%), and the increase in high emissions inhaler‐related emissions was greater (MMPC, 0.50%; 95% CI, 0.23–0.78% v 0.44%; 95% CI, 0.19–0.69%) (Supporting Information, table 3).
Limitations to our study include the omission of over‐the‐counter sales from our detailed analysis, some missing data, and the use of United Kingdom data2 for emission estimates. Based on the findings of another study,4 we estimate that total emissions from both over‐the‐counter short‐acting β2 agonist inhalers and all dispensed PBS‐subsidised prescription inhalers in Australia in 2019 were 437867t CO2e, or 17.3kg CO2e per person (details: Supporting Information, part 1). In Great Britain, 61.1 million inhalers contributed 20.4kg CO2e per person in 2021,5 in Sweden 4.8 million inhalers (in 2017)6 contributed 2.5kg CO2e emissions per person per year (in 2018–19).7
In the first comprehensive estimate of carbon emissions for PBS‐subsidised inhalers in Australia, we found differences in dispensing according to the demographic characteristics of inhaler users. To better support efforts to reduce respiratory inhaler emissions as part of Australian health care decarbonisation plans,1 we recommend routine collecting and reporting of over‐the‐counter inhaler sales data, and that these data are made freely available to complement PBS‐subsidised dispensing data. Our findings could inform targeted interventions for reducing the use of high emission inhalers in Australia and updates to clinical practice guidelines.
Box 1 – Pharmaceutical Benefits Scheme‐subsidised dispensing of respiratory inhalers and estimated associated carbon emissions, Australia, 2019–2023, by year
Low emissions inhalers* |
High emissions inhalers† |
All inhalers | |||||||||||||
Year |
Inhalers dispensed |
Inhalers/1000 population‡ |
CO2e (t) |
Inhalers dispensed |
Inhalers/1000 population‡ |
CO2e (t) |
Inhalers dispensed |
Inhalers/1000 population‡ |
CO2e (t) | ||||||
2019 |
6217094 (43.1%) |
213 |
4681 (2.2%) |
8222259 (56.9%) |
301 |
212830 (97.8%) |
14439353 |
514 |
217510 |
||||||
2020 |
6642484 (41.8%) |
222 |
5090 (2.1%) |
9242574 (58.2%) |
331 |
242270 (97.9%) |
15885058 |
553 |
247360 |
||||||
2021 |
6325195 (42.4%) |
207 |
4854 (2.1%) |
8582617 (57.6%) |
303 |
225880 (97.9%) |
14907812 |
510 |
230734 |
||||||
2022 |
6670531 (40.8%) |
215 |
5266 (2.0%) |
9676555 (59.2%) |
338 |
255227 (98.0%) |
16347086 |
553 |
260493 |
||||||
2023§ |
6290153 (40.5%) |
198 |
4881 (2.0%) |
9241921 (59.5%) |
312 |
242053 (98.0%) |
15532073 |
509 |
246934 |
||||||
MMPC, 2019–2023 (95% CI)¶ |
0.15% (0.01 to 0.29%) |
–0.02% (–0.17 to 0.13%) |
0.21% (0.05 to 0.36%) |
0.43% (0.22 to 0.65%) |
0.27%. (0.05 to 0.49%) |
0.46% (0.24 to 0.67%) |
0.32% (0.12 to 0.52%) |
0.17% (–0.05 to 0.38%) |
0.46% (0.22 to 0.71%) |
||||||
CI = confidence interval; CO2e = carbon dioxide equivalent; MMPC = mean monthly percentage change. * Dry powder inhalers and soft mist inhalers. † Pressurised metered dose inhalers and breath‐actuated inhalers. ‡ Age‐standardised to the Australian standard population (2010).3 § Data available for January to November; totals and rates were multiplied by 1.099 to provide estimate for year. ¶ Data for March 2020 were replaced by mean data for March 2019 and March 2021 to reduce the influence of coronavirus disease 2019 (COVID‐19) pandemic on the estimates. | |||||||||||||||
Box 2 – Pharmaceutical Benefits Scheme (PBS)‐subsidised dispensing of respiratory inhalers and estimated carbon emissions, Australia, 2019–2023, by inhaler type and month*
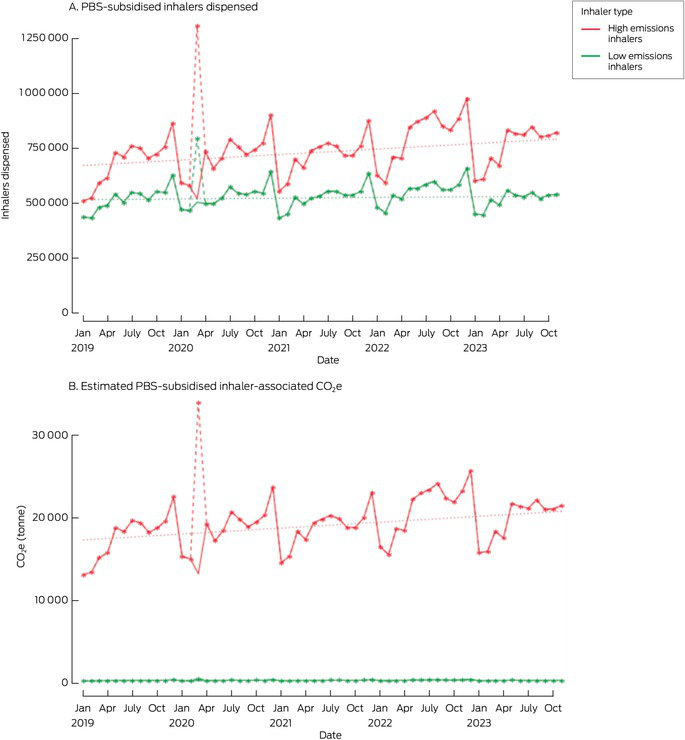
CO2e = carbon dioxide equivalent.* Solid line: raw data; dotted line: linear trend, 2019–2023; dashed line (March 2020: coronavirus disease 2019‐related divergence from normal dispensing): unadjusted raw data that were replaced by mean of values for March 2019 and March 2021.
Box 3 – Pharmaceutical Benefits Scheme‐subsidised dispensing of respiratory inhalers, Australia, 2019, 2021, and 2023: dispensing rates (per 1000 population) by demographic characteristics*
2019 |
2021 |
2023† | |||||||||||||
Characteristic |
Low emissions inhalers‡ |
High emissions inhalers§ |
Low emissions inhalers‡ |
High emissions inhalers§ |
Low emissions inhalers‡ |
High emissions inhalers§ | |||||||||
All people |
213 |
301 |
207 |
303 |
198 |
312 |
|||||||||
Area |
|||||||||||||||
Metropolitan |
176 |
259 |
172 |
260 |
171 |
279 |
|||||||||
Non‐metropolitan |
259 |
361 |
280 |
401 |
282 |
422 |
|||||||||
State/territory |
|||||||||||||||
Australian Capital Territory |
199 |
245 |
206 |
254 |
211 |
245 |
|||||||||
New South Wales |
227 |
322 |
212 |
311 |
200 |
313 |
|||||||||
Northern Territory |
149 |
198 |
148 |
218 |
133 |
222 |
|||||||||
Queensland |
222 |
303 |
220 |
307 |
207 |
312 |
|||||||||
South Australia |
209 |
416 |
208 |
406 |
199 |
432 |
|||||||||
Tasmania |
264 |
399 |
260 |
427 |
249 |
445 |
|||||||||
Victoria |
203 |
281 |
200 |
292 |
195 |
313 |
|||||||||
Western Australia |
180 |
202 |
177 |
221 |
167 |
216 |
|||||||||
Age group (years) |
|||||||||||||||
0–19 |
15 |
198 |
13 |
180 |
16 |
179 |
|||||||||
20–39 |
65 |
132 |
67 |
143 |
65 |
136 |
|||||||||
40–59 |
201 |
294 |
202 |
319 |
197 |
323 |
|||||||||
60–79 |
747 |
735 |
703 |
717 |
658 |
774 |
|||||||||
80 or older |
1133 |
954 |
1098 |
945 |
1036 |
1017 |
|||||||||
Gender |
|||||||||||||||
Female |
221 |
329 |
215 |
331 |
208 |
341 |
|||||||||
Male |
205 |
268 |
197 |
272 |
185 |
277 |
|||||||||
Inhaler class |
|||||||||||||||
Inhaled corticosteroid |
7 |
32 |
6 |
30 |
9 |
26 |
|||||||||
Inhaled corticosteroid/long‐acting β2 agonist |
113 |
88 |
109 |
94 |
102 |
99 |
|||||||||
Inhaled corticosteroid/long‐acting muscarinic antagonist/long‐acting β2 agonist |
10 |
— |
17 |
1 |
25 |
9 |
|||||||||
Long‐acting β2 agonist |
63 |
— |
52 |
— |
41 |
— |
|||||||||
Long‐acting muscarinic antagonist/long‐acting β2 agonist |
21 |
— |
21 |
— |
18 |
— |
|||||||||
Short‐acting β2 agonist |
— |
176 |
1 |
172 |
3 |
170 |
|||||||||
Short‐acting muscarinic antagonist |
— |
6 |
— |
7 |
— |
8 |
|||||||||
* Rates are age‐standardised to the Australian standard population (2010).3 For space reasons, data for three years are included here; the dispensing rates for all five years are included in the Supporting Information, table 3. † Data available for January to November; totals and rates were multiplied by 1.099 to provide estimate for year. ‡ Dry powder inhalers and soft mist inhalers. § Pressurised metered dose inhalers and breath‐actuated inhalers. | |||||||||||||||
Competing interests
Luise Kazda was reimbursed by Asthma Australia for travel expenses to attend a round table meeting on sustainable asthma care.
Acknowledgements
This project was funded by a National Health and Medical Research Council (NHMRC) Healthy Environments and Lives Network (HEAL) Network Innovation Fund Grant. Luise Kazda is supported by the NHMRC Special Initiative in Human Health and Environmental Change (2008937). Katy Bell is supported by NHMRC Investigator grants (2019/GNT1174523, 2023/GNT202594). The funding source had no role in the study planning, design, or implementation.
We acknowledge the contributions of Mellissa Batger (pharmacist, Royal North Shore Hospital, Sydney) and Joseph Duncan (University Centre for Rural Health, Lismore) to the grouping of inhalers into types and classes. We also acknowledge the contribution by Angela Cartwright (Asthma Australia) to the grant application and general feedback on Asthma Australia priorities, and Scott McAlister for his contribution to verifying the reliability of the inhaler carbon estimates. They received no financial compensation for their help with this project.
References
- Australian Department of Health and Aged Care. National health and climate strategy. Dec 2023. https://www.health.gov.au/sites/default/files/2023‐12/national‐health‐and‐climate‐strategy.pdf (viewed Feb 2025).
- PrescQIPP Community Interest Company. Inhaler carbon footprint (bulletin 295). Attachment 1: inhaler carbon footprint data, Updated 27 Nov 2024. https://www.prescqipp.info/media/5tsdrgha/attachment‐1‐inhaler‐carbon‐footprint‐data‐235.xlsx (viewed Feb 2025).
- Australian Bureau of Statistics. Which population to use for age standardisation? In: Australian Demographic Statistics, Mar 2013 (3101.0). 26 Sept 2013. https://www.abs.gov.au/ausstats/abs@.nsf/Lookup/3101.0Feature+Article1Mar%202013 (viewed Aug 2024).
- Alzaabi A, Bell JP, Montero‐Arias F, et al. Greenhouse gas emissions from respiratory treatments: results from the SABA CARBON international study. Adv Ther 2023; 40: 4836‐4856.
- PrescQIPP Community Interest Company. Inhaler carbon footprint (bulletin 295). Recommendations. Oct 2021. https://www.prescqipp.info/media/5719/295‐inhaler‐carbon‐footprint‐22.pdf (viewed Feb 2025).
- Janson C, Henderson R, Löfdahl M, et al. Carbon footprint impact of the choice of inhalers for asthma and COPD. Thorax 2020; 75: 82‐84.
- Janson C, Maslova E, Wilkinson A, et al. The carbon footprint of respiratory treatments in Europe and Canada: an observational study from the CARBON programme. Eur Respir J 2022; 60: 2102760.
Barriers and Facilitators to Timely Detection and Optimal Management of Chronic Wet Cough in Aboriginal Children Across Australia From the Perspectives of Carers of Aboriginal Children: A Qualitative Study
Gloria T. Y. Lau, Pam Laird, Robyn Aitken, Melanie Barwick, Liam Bedford, Emily R. Bowden, Jamie Everingham, Angela Fuery, Reece Griffin, Neha Jain, Mina Kinghorn, Renae Knapp, Gabrielle B. McCallum, Peter Morris, Richard Norman, Peter C. Richmond, Aarti Saiganesh, Slade Sibosado, Cameron Taylor, Maree Toombs, Roz Walker, Joan Wilson, Anne B. Chang, André Schultz
Barriers and Facilitators to Timely Detection and Optimal Management of Chronic Wet Cough in Aboriginal Children Across Australia From the Perspective of Health Care Providers: A Qualitative Study
Gloria T. Y. Lau, Pamela Laird, Robyn Aitken, Melanie Barwick, Liam Bedford, Emily R. Bowden, Corey Dalton, Jamie Everingham, Angela Fuery, Reece Griffin, Neha Jain, Mina Kinghorn, Renae Knapp, Gabrielle B. McCallum, Peter Morris, Richard Norman, Peter C. Richmond, Aarti Saiganesh, Slade Sibosado, Maree Toombs, Roz Walker, Joan Wilson, Anne B. Chang, André Schultz
Respiratory Syncytial Virus Disease Burden and Evidence Gaps in Australia Before Immunisation Introduction: A Retrospective Population-Based Study Using 2016–2019 Hospitalisation and 2023 Laboratory Surveillance Data
Chisato Imai-Boulter, Jean Li-Kim-Moy, Clayton Chiu, Sanjay Jayasinghe, Kristine Macartney
Not Gone but Often Forgotten: Action Needed to Address Tuberculosis in Aboriginal and Torres Strait Islander Communities
Nikkita Joshua, Emma L. Smith, Eunice (Cheeky) Love, Christopher P. Lowbridge, Nicole Tukana, Amy Bowden, Megan A. Campbell, Dawn Casey, James Ward
Uneven Ground: Survival Differences Among Victorian Lung Cancer Patients by Location of Residence (2011–2023): A Retrospective Cohort Study
Evangeline Samuel, Eldho Paul, Mike Lloyd, Sanuki Tissera, Craig Underhill, Sagun Parakh, Phillip Parente, Inger Olesen, Javier Torres, Katharine See, Gavin M. Wright, David Langton, Thomas John, Matthew Conron, James Bartlett, Nicola Atkin, Nikolajs Zeps, Susan V. Harden, Wasek Faisal, John R. Zalcberg, Rob G. Stirling
Treatment and Survival Outcomes for Indigenous and Non-Indigenous Australians Within the Victorian Lung Cancer Registry: A Retrospective Cross-Sectional Cohort Study
Melanie Wong, Mike Lloyd, Jessie Zeng, Sanuki Tissera, Kalinda E. Griffiths, Justine Clark, Jonathan Gillies, Lisa Briggs, Jacqueline Lesage, Tom Wood, Craig Underhill, Sagun Parakh, Louis B. Irving, Wasek Faisal, Rob Blum, Gary E. Richardson, Phillip Parente, Michelle Caldecott, Inger Olesen, Javier Torres, Evangeline Samuel, Christopher Lyne, Katharine See, David Langton, Thomas John, Gavin Wright, Matthew Conron, James Bartlett, Golsa Adabi, Maggie Moore, Susan Harden, Zoe K. McQuilten, John R. Zalcberg, Rob Stirling