


Humanity is now in a climate clearly beyond contemporary experience. Driven by record‐high concentrations of greenhouse gases in our atmosphere, global (land and ocean) mean near‐surface air temperature in 2023 was by far the warmest on record, topping a decade (2014–2023) that was also the warmest on record and included nine of the ten warmest years on record.1 The extraordinarily high temperatures continued in 2024 with month after month of record‐high temperatures.2 The ocean water temperature was also the warmest on record in 2023 and global sea level reached a new high, rising 11 cm in the past 30 years (1993–2023).1
Internationally, the gravity of the climate change threat to human health3 is increasingly understood, and urgent and appropriate responses are starting to be prioritised. “Responding to climate change” is the first of the six strategic objectives of the World Health Organization's General Programme of Work over the coming four years (2025–2028).4 Health was prominent at the 28th UN Climate Change Conference (COP28) in Dubai, November–December 2023. COP28 included a day focused on health, the first in COP's history, and produced the COP28 UAE Declaration on Climate and Health. The Declaration commits the 151 signatories (which include Australia and New Zealand) to, for example, pursuing better integration of health considerations into their climate policy processes, and climate considerations across their health policy agendas.5,6
As the disease and death toll from climate change grows,7 the actions (or inactions) of individual countries are coming under scrutiny. For example, in April 2024, the European Court of Human Rights found that the European Convention on Human Rights “encompasses a right to effective protection by the State authorities from the serious adverse effects of climate change on lives, health, well‐being and quality of life” and that the Swiss Confederation had failed to comply with its duties under the Convention concerning climate change.8 This landmark ruling emphasises the potential importance of evaluation of climate adaptation and mitigation policies and their implementation in future litigation on climate change.9
The Lancet Countdown is a flagship international academic collaboration that brings together nearly 300 expert researchers from around the world to track both the health impacts of climate change and the health opportunities of climate action, engaging policy makers and health professionals with the evidence to inform a thriving future. With support from the Wellcome Trust, the Lancet Countdown has embarked on a new phase (2024–2029) of increased ambition and new capacity, with an expanding network of Lancet Countdown regional centres. The Lancet Countdown Oceania Regional Centre10 continues the MJA–Lancet Countdown annual indicator reports.11,12,13,14,15,16
The 2024 MJA–Lancet Countdown report presents the work of a collaboration of 25 experts from 15 institutions (eleven from Australia, one from New Zealand, one from the United Kingdom, and two from the United States), brought together by an established partnership between The Lancet and the Medical Journal of Australia.17,18 The collaboration tracks the links between public health and climate change across five domains: health hazards, exposures and impacts; adaptation, planning and resilience for health; mitigation actions and health co‐benefits; economics and finance; and public and political engagement.
In this, the seventh report of the MJA–Lancet Countdown, we track progress on an extensive suite of indicators across these five domains, accessing, assessing and presenting the latest data and further refining and developing our analyses.
Methods
We tracked progress on health and climate change in Australia across 25 indicators within the five broad domains (Box 1). Where possible, we adopted the methods used by the Lancet Countdown, including those used in its 2024 global report.19 Where more appropriate for an Australia‐focused assessment, or where it was possible to refine or improve on the original method as more precise and comprehensive data or methods were available at the national level, the method for the Australian indicator was modified or an alternative method was used. As an annual report, it is necessary for the indicators to be based on data that are produced annually and that are available to the authorship team by May each year (preferably for the previous year), such that the required analysis can be completed and the annual manuscript can be written ready for submission to the MJA by the end of September.
In recognition that the law is an important arena for action on health and climate change,20,21,22,23 Section 5 introduces an important new indicator, “Health and climate change litigation in Australia” (indicator 5.5). We also include two new text boxes this year. The first discusses the nursing response to health and climate change in Australia, and the second explores digital health care for climate change mitigation and adaptation in Australia. Building on our profiles of New Zealand in our 2022 and 2023 reports13,14 and continuing our transition to an Oceania regional focus, we include a section that discusses health and climate change in New Zealand, which, for the first time, presents several of our indicators for this country.
Full details of our methods, data and caveats are provided for each indicator in the Supporting Information and are numbered accordingly. We also briefly summarise the method for each indicator within the text here.
Section 1: Health hazards, exposures and impacts
Climate change affects human health in many ways. Of all climate‐related hazards, high temperatures are the best described and remain the major focus of this section. Heatwaves, which are periods of extremely high temperatures, are especially relevant to population health. Also, bushfires and drought are long term concerns in Australia. They have been features of the continent for millennia, but their extent and severity are amplified by climate change. Temperature is one of the key factors, but changes in precipitation, river flows and soil moisture also influence the incidence of events such as floods and their impacts on health.
1.1 Exposure of vulnerable populations to heatwaves
In recent years, multiple studies have demonstrated excess ambulance demand, emergency department presentations, hospital admissions, and mortality due to heatwaves in several sites across Australia.24 This indicator tracks change in a measure of heatwave intensity — the excess heat factor — as it applies to human health. The excess heat factor is based on comparison of three‐day‐averaged daily mean temperatures at a location against the long term climate of that location, with exceedances of the 95th percentile deemed to be heatwave conditions.25,26 Box 2 shows the Australian averaged accumulated excess heat factor over the past 20 heatwave seasons (November–March).
Calculating two trends through these data enables an assessment of long term change (a 50‐year trend extending from 1974–1975 to 2023–2024), which demonstrates a 34% increase in excess heat factor over this 20‐year period, as well as an understanding of the slightly accelerated rate of shorter term change, with a 37% rise seen over just the past 20 heatwave seasons presented (2004–2005 to 2023–2024). Weighting the accumulated excess heat factor according to the population density produces a different result, with the 50‐year heatwave season accumulated excess heat factor having a 26% rise while the 20‐year trend has a fall of 8% (Supporting Information, 1.1). The 20‐year trend changes are smaller than those reported in the MJA–Lancet Countdown's 2021, 2022 and 2023 reports,12,13,14 in part because the three summers 2020–2021 to 2022–2023 were noticeably cooler than the 2019–2020 summer.
1.2 Heat and physical activity
Physical activity promotes increased physical and mental health. However, heat stress can reduce willingness to participate in physical activity and increase health risks for those exercising outdoors.27 This indicator uses ambient temperature, humidity, and solar radiation to estimate annual hours per person during which light (walking) and moderate (jogging) outdoor physical activity presents a risk of heat stress (Supporting Information, 1.2).28
In 2023, Australians were exposed to 132.1, 66.8 and 8.0 annual hours where ambient conditions posed a moderate, high and extreme heat stress risk during light physical activity, respectively (Supporting Information, figure A1A). For moderate physical activity, the annual hours of moderate, high and extreme heat stress risk were 175.8, 96.9 and 24.7 respectively (Supporting Information, figure A1B). In 2014–2023, the average annual hours of at least moderate heat stress risk during light and moderate physical activity were 30 (+16.2%) and 48 (+18.3%) hours above the 1990–1999 annual average, respectively.
1.3 Bushfires
Although an integral component of the Earth system, bushfires can have substantial direct and indirect impacts on human health,29 with plenty of evidence available for short term (hours, days or weeks) effects in relation to a diverse range of health outcomes. Fewer studies are available for medium to long term effects (months to years). Box 3 presents the bushfires indicator for the period 2003–2023 for Australia, represented by two subindicators:19 bushfire exposure (ie, the annual exposure to active bushfires), measured in total person‐days; and bushfire risk (ie, the annual population‐weighted number of days exposed to very high or extremely high bushfire risk). Both subindicators were calculated based on satellite data (Supporting Information, 1.3), and large urban areas with a population density of ≥ 400 persons/km2 were excluded. Box 3 shows a high interannual variability for both subindicators, with an increasing trend in the case of bushfire exposure and a relatively stable trend in the case of bushfire risk. An increasing interannual variability over time suggests that more extreme values could be expected in the future.
1.4 Drought
Drought is defined here using the Standardised Precipitation Evapotranspiration Index (SPEI) calculated on a six‐month timescale.30 The excess occurrence of drought was calculated by comparing each year's number of months in each drought category with the average level of drought occurrences measured at each location over the baseline climate years 1950–2005 (Supporting Information, 1.4).31 The indicator shows that in 2023, about 20% of land in Australia had excess levels of exceptional drought (Supporting Information, figure A2). Australian Bureau of Meteorology data show that the August 2023 to October 2023 period was Australia's driest three‐month period since 1900 (Supporting Information, figure A3).32 Furthermore, Perth, the capital city of Western Australia, had the driest six months since rainfall data were first recorded almost 150 years ago,33 raising concerns that the long term drying trend that is already known to have occurred in that region since the 1970s will now be exacerbated by the recent exceptional droughts, placing unprecedented pressure on water supplies for human needs and ecological integrity.
Summary
The results shown here underline the importance of long term tracking of climate hazards and exposures in Australia. Since the mid‐1970s, the frequency of health‐damaging heat has increased substantially. Taking into account population exposures (which weights the location of high temperatures in proportion to the population density), this long term trend shows a 26% rise in excess heat factor in the most recent 20 years. Year‐to‐year variability tests the capacity of health and other services to protect populations from climate risk, and the findings for bushfire exposure (indicator 1.3) are a particular concern. The long term trend to reduced rainfall in parts of Australia has been noted previously; indicator 1.4 Drought reports that effects on vulnerable locations (eg, the city of Perth) may be magnified by extraordinary short term dry spells.
Section 2: Adaptation, planning and resilience for health
Most of the drivers of population health that are affected by climate change occur outside health services and the health care system. Therefore, effective planning for climate change must consider the broader environmental, social and economic context and take a multisectoral approach. Although various states and territories have had health‐related or health‐adjacent plans in place for some years, nationally, Australia is a relative newcomer in its bid to conduct a whole‐of‐government risk assessment and undertake comprehensive planning to protect population health and produce a health strategy for climate change. Australia's multiple levels of government (federal, state, local) display both complexity and benefit for responding to climate change, with differing and sometimes shared responsibilities pertinent to health and health care sitting across jurisdictions.34,35 Relevant to health, for example, the Australian Government is responsible for regulating aged care, general practice, and medicines; each of the states manage public hospitals and emergency services including ambulances (while funding of public hospitals is shared with the Australian Government); and local councils look after town planning and waste management as well as local environmental sustainability initiatives. In addition to the four indicators that we continue to track in this section, we provide a discussion of the nursing response to health and climate change in Australia in recognition of the important role the nursing profession can play in addressing the challenges and harnessing the opportunities of this issue (Box 4).
2.1 Health adaptation plans and assessments
This indicator tracks the development of climate change and health adaptation plans and assessments in Australia nationally and at the state level (Supporting Information, 2.1). Adaptation is recognised as a critical component of the Australian Government's response to climate change. The Australian Government released its first National Health and Climate Strategy in December 2023,51 setting out a whole‐of‐government plan for addressing the health and wellbeing impacts of climate change. The Strategy encompasses public and preventive health, primary and secondary health care, and aged care.
The Australian Government also allocated $27.4 million over two years to deliver the first National Climate Risk Assessment and National Adaptation Plan,51 which will inform decisions on how Australia should adapt to climate risks across all systems, including health and social support. The first pass of the National Climate Risk Assessment identified eleven priority risks facing Australia, including risks to health and wellbeing from climate impacts.52 The National Adaptation Plan will establish a comprehensive framework for adapting to these nationally significant climate risks, such as higher temperatures, bushfires, storms and floods. Once the National Adaptation Plan is finalised, it will replace the National Climate Resilience and Adaptation Strategy (2021–2025).
Australian states and territories are also developing climate change and health adaptation plans. For example, the Northern Territory Government (NT Health) launched its Sustainability and Climate Adaptation Strategy 2024–2030 at the end of 2024, which sets out its commitment to urgent and integrated action on climate change in support of its vision of great health for all Territorians.53 Western Australia's Climate Adaptation Strategy was published in 2023, recognising that adaptation research is required in a range of disciplines including society, environment, health, built environment, and traditional knowledge.54 Some WA Government entities, such as the Department of Health and the State Emergency Management Committee, are developing sectoral adaptation plans in partnership with the wider community. Although state governments have implemented various adaptation strategies, these plans must be further developed to yield concrete outcomes.55
2.2 Detection, preparedness and response to health emergencies
The International Health Regulations (2005)56 (IHRs) are an instrument of international law designed to prevent, protect against, control and provide a public health response to potential public health emergencies and the international spread of infectious diseases. With weather and climate causing or contributing to many public health emergencies and the spread of many infectious diseases, the IHRs serve as an important indicator of national climate change and health adaptive capacity. Countries report to the World Health Assembly on the implementation of the IHRs across 15 capacities. The score for each capacity is expressed as a percentage (0–100%), with 100% indicating full implementation, such as policies and strategies to support and facilitate the development and implementation of the capacity are in place at the national, intermediate and local levels by all relevant sectors and are revised and updated on a regular basis.57
For this indicator, we track Australia's reported implementation58 of the health emergency management capacity from 2018 to 2023. Australia's score for this capacity remained at 80% in 2023, having dropped to this level in 2021, the first drop since it was introduced by the WHO in 2018 (Supporting Information, figure A4). For continuity with previous MJA–Lancet Countdown reports,11,12,14 we also report Australia's health surveillance and human resources capacities. While the latter remained at 80% in 2023, the former remained at 100% following its rise to this level in 2022. We also highlight that Australia's zoonotic diseases capacity has been well below 100% over this period, and that the current 60% is below the global average. However, Australia's health services provision capacity remained at 100% in 2023 (Supporting Information, 2.2).
2.3 Migration and displacement
Climate change impacts contribute to population displacement, migration and relocation, with consequences for health.59 This indicator tracks population exposure to future sea level rise of one metre and displacement of people due to weather‐related disaster (Supporting Information, 2.3).
In 2023, 170 701 people in Australia were living less than one metre above sea level, an increase of almost 3000 compared with our previous annual report.14 Coastal adaptation responses include protection (eg, seawalls), accommodation of risk (eg, flood proofing), attack (eg, land reclamation), and retreat (eg, planned relocation); retreat of low‐lying coastal settlements is an increasingly urgent, albeit last resort, adaptation response.60
In Australia, weather‐related disasters (floods, storms, bushfires) displaced 17 287 people in 2022 and 4674 people in 2023.61 From 2008 to 2023, there was an upward trajectory in disaster displacement, adjusting for population increase, but with substantial annual variation (Box 5). Climate‐related displacement can have adverse health consequences, including for mental health, communicable diseases, nutrition, and health care access.59 With more frequent and intense extreme weather events, globally and in Australia,63 climate change will increasingly cause forced displacement of people with associated risks to health and wellbeing.
2.4 Bushfire adaptation
As highlighted elsewhere in this report (eg, indicator 1.3 Bushfires) and in our 2020 report that focused on Australia's 2019–20 Black Summer,16 bushfires are a major climate‐related extreme event with direct and indirect consequences for human health. To track progress on two aspects of bushfire adaptation in Australia,55 we analyse aerial and terrestrial firefighting capacity (Box 6). Although National Aerial Firefighting Centre aircraft services have increased since 2007–08, from just over 30 to the current 161, the number of volunteer firefighters and support staff in Australia has decreased since 2015–16 and is currently at its lowest point since the Productivity Commission started reporting on this area of government services in 2009–10 (Supporting Information, 2.4). This decrease in the number of firefighters has implications not only for Australia's capacity to fight bushfires, but also for its ability to reduce the likelihood of fires occurring, given the important role these volunteers have in risk management programs to reduce bushfire hazards and reduce fire ignitions.65
Summary
Australia is playing catch‐up in its national response to climate change, with two major advances recently: the first pass all‐sector National Climate Risk Assessment,66 and the National Health and Climate Strategy.51 Importantly, the latter recognises that many major influences on population health happen outside its own more traditional scope of the health system. Each of the states and territories now have an opportunity to build on this national approach, to develop more comprehensive state level health adaptation plans that are complementary to the national Strategy. Alongside the demonstrable advances in Australia's national adaptation planning, it is worrisome that a key component of Australia's capacity to respond to bushfires, its number of firefighting volunteers, is in decline.
Section 3: Mitigation actions and health co‐benefits
This section focuses on mitigation actions across various sectors (including energy, transport, agriculture, and health care) to reduce greenhouse gas emissions and address public health challenges such as air pollution, diet‐related illnesses, and the health impacts of climate change. Findings show a lack of systemic changes. Australia's energy system still shows minimal progress in decarbonisation, and dependence on fossil fuels persists despite growth in renewable energy. Electric vehicle adoption is increasing, but Australia lags behind global leaders. The reduction in emissions from livestock remains a critical challenge, as do diet improvements. Air pollution in cities, despite generally declining, is exceeding international guidelines, and Australia has a notably higher contribution from fire smoke than other regions globally. Health care sector emissions are rising. These findings highlight the urgent need for substantial and coordinated decarbonisation action across sectors to mitigate climate change while improving public health outcomes.
3.1 Energy systems and health
Energy systems are the dominant source of greenhouse gas emissions globally, which means that they have a critical role in driving climate change while also being a major cause of air pollution and posing significant public health risks.19 As in previous reports, we define the carbon intensity of the energy system as “the tonnes of CO2 [carbon dioxide] emitted for each unit of primary energy supplied”.12 The latest available data now extend to 2022 for Australia, Brazil, Germany, the United States, India and China (Supporting Information, 3.1). Our previous report showed a rebound of emissions after a decrease in the carbon intensity of total primary energy supply due to the coronavirus disease 2019 (COVID‐19) pandemic.
In 2022, global CO2 emissions from fuel combustion experienced a 1.3% increase and have been pushing emissions beyond the levels recorded before the COVID‐19 pandemic, which means that the temporary reductions achieved during the global economic slowdown have been reversed.67 For individual countries, the new data reveal varied trends (Supporting Information, figure A5). Australia's carbon intensity of its total primary energy supply sits at 66.6 tCO2/TJ in 2022,67 which means that there has overall been minimal progress in decarbonisation. Most countries have experienced stagnation after the COVID‐19 pandemic, with no country reporting substantial decarbonisation. Australia, however, continues to exhibit the highest carbon intensity among the analysed countries alongside China, underscoring the urgency for more aggressive decarbonisation efforts.
Although the proportion of electricity generated from low‐carbon sources is steadily increasing (Box 7), fossil fuels (especially coal) continue to play a major part. Overall, Australia's total energy supply remains highly dependent on fossil fuels, with coal, oil and natural gas having a dominant role in domestic production and exports (Box 8). Further accelerating the transition to renewables is necessary if Australia is to meet its climate commitments and reduce the carbon intensity of its energy system. For Australia to achieve net zero emissions by 2050, the country will require a much more substantial policy roadmap with specific milestones across different sectors.70,71 Australia faces substantial challenges, including rising domestic energy prices and inflation, coal retirements, grid integration, and renewable energy deployment. By 2030, renewable energy is expected to contribute 82% of the national electricity mix; however, a just and inclusive energy transition will require much more substantial infrastructure developments and investments as well as community engagement and workforce reskilling.71
3.2 Clean household energy
This indicator tracks the transition to clean household energy in Australia (Supporting Information, 3.2). In recent years, the use of renewable energy sources in Australia has grown substantially (Box 7). In 2023, 39.4% of Australia's electricity came from renewable sources,72 which is continuing the upward trend observed in previous years (from 20% in 2019 to over 30% in 2021 and to 35.9% in 2022). This growth has been fuelled by an increase in both large‐ and small‐scale renewable capacity, including utility‐scale projects and residential solar installations.72
In 2023, close to 338 000 new rooftop solar systems were installed across Australia, up from around 310 000 in 2022, as documented in the 2023 MJA–Lancet Countdown report.14 Australia is the world leader in rooftop solar, with more rooftop solar panels per person than anywhere else in the world.73 Rooftop solar adds up to 23 GW of energy capacity — about a quarter of all electricity generation capacity nationally.74,75 In addition, battery systems have seen further expansion and included 56 000 new household storage systems that were installed in 2023,72 up from around 50 000 in 2022 as documented in the 2023 MJA–Lancet Countdown report.14 Despite these advancements, a lack of data persists on energy access in remote and Indigenous communities, which limits insights into clean energy adoption in these areas.
3.3 Exposure to particulate matter air pollution in cities
Exposure to air pollution increases the risk of chronic respiratory and cardiovascular diseases, cancers and other adverse health outcomes.19,76 Because fossil fuel combustion produces both air pollutants and greenhouse gases, mitigation of climate change will have health co‐benefits through decreased air pollution. This indicator uses monthly and annually averaged concentrations of fine particulate matter (PM2.5) air pollution from the largest urban areas in each state and territory of Australia from 2000 to 2023 (Supporting Information, 3.3). These data show a general decline in PM2.5 levels; however, substantial fluctuations occur due to bushfires, dust storms and seasonal factors (Supporting Information, figure A6). Figure A6 in the Supporting Information shows that, over the recent years, Australian cities in certain regions experienced elevated air pollution levels more than others, stemming from both the occurrence of extreme bushfire events with some jurisdictions in specific years (eg, the eastern states in 2019 and 2020) and some places regularly affected by human activities such as using wood heaters for warmth (eg, Tasmania and the Australian Capital Territory77). In the Northern Territory, there is a regular climatic cycle between the wet season and dry season which sees an increase in PM2.5 due to fires in the savannah, and in Western Australia, there are elevated air pollution levels due to the proximity of populations to arid rangelands, which can be sources of fine particulate emissions.
Although PM2.5 air pollution levels in Australian cities are markedly lower than those in some countries, they nevertheless exceed international guidelines (despite falling within national standards). For example, in 2022, five of the eight states and territories exceeded the latest WHO annual air quality guideline of 5 μg/m3 for PM2.5 (Supporting Information, figure A6).78 Modelling studies of the sources of PM2.5 exist and have shown that Australia had a notably higher contribution from fire smoke than for other regions globally.79 The remainder in Australian cities’ PM2.5 air pollution was dominated by industrial emissions, traffic and secondary inorganic aerosols, which are produced by fossil fuel emissions that then undergo various chemical interactions in the atmosphere.79
3.4 Sustainable and healthy transport
This indicator tracks the transition to sustainable and healthy transport in Australia (Supporting Information, 3.4). Although fossil fuels continue to have a substantial role in the transport sector, the use of electricity has steadily increased over the past decade (Box 9).80 The purchase and use of electric vehicles (EVs) continue to grow, with about 180 000 EVs now across Australia.81 Although Australia set a new record for total vehicle sales in 2023, the sale of EVs also reached an all‐time high of 98 436 vehicles, accounting for 8.47% of all new vehicle sales; more than doubling the figure from 2022 (Box 10). However, Australia still lags behind the global average of 18%82 and leading countries such as Norway, where 91.5% of new cars are electric.83 Australia faces several hurdles in advancing EV adoption. First, the country's vast territory and low population density make it challenging to build an extensive network of charging stations, exacerbating the so‐called range anxiety for potential EV buyers. Second, although most states and territories have offered rebates and incentives for EVs, there is still a lack of federal support in terms of regulations and incentive programs for purchasing an EV. Finally, the introduction of new (and less expensive) EV models in Australia has been slow in comparison to other nations. There is an increased urgency for Australia to invest in EV infrastructure, rebates, national fuel efficiency standards, and other proactive policies to accelerate the transition to EVs. Increasing the number of EVs is important, but not sufficient on its own to achieve climate and health targets.84 Australia must also accelerate the promotion of other modes of transport that are non‐polluting and health promoting, such as active travel (walking and cycling) and electrified public transport.
3.5 Emissions from agricultural production and consumption
Reducing greenhouse gas emissions from agricultural production is central to Australia's mitigation plans and could have co‐benefits from reducing disease from excessive red meat consumption (see indicator 3.6 Diet and health co‐benefits). Agricultural production accounts for just under 17% of the national total emissions.85 This indicator tracks production and consumption emissions across a wide range of food products (Supporting Information, 3.5). The data show that total production emissions stood at 79 megatonnes of carbon dioxide equivalent (MtCO2e) in 2021, with beef accounting for the largest proportion (46%), due mainly to methane production from cattle (Box 11).
Due to the substantial quantity of red meat and other food exports, Australia's domestic consumption emissions account for only 42% of total production emissions. The agricultural sector accounts for 2.2% of Australia's jobs.86 Efforts to curtail emissions in this sector are not only essential to meeting Australia's climate commitments, but also deeply linked to Australia's current economy.
3.6 Diet and health co‐benefits
What and how much we eat matters for human health and that of the planet. From 2015 to 2021, total diet‐related deaths in Australia increased by 20%, from 32 842 to 39 545 (Box 12). Excessive red and processed meat consumption significantly contributes to this, as does insufficient consumption of whole grains, fruits, vegetables and legumes (Supporting Information, 3.6). Many lives could be saved in Australia each year by lowering population‐level meat consumption and increasing fruit, vegetable and legume consumption.
Recent analysis showed that switching between similar food and beverage products may reduce greenhouse gas emissions.87 About 31 million tonnes of emissions were attributable to products consumed at home in 2019, the three highest contributors being meat and meat products (49%), dairy (17%), and non‐alcoholic beverages (16%). Switching higher emission products for very similar lower emission products could reduce total emissions by 26%.
3.7 Health care sector emissions
Health care, while critical for human health and wellbeing, is a major contributor to greenhouse gases. From 2010 to 2021, absolute and per capita greenhouse gas emissions from Australia's health care sector rose by 113% and 81% respectively, hitting an unprecedented peak in 2021 (Box 13) (Supporting Information, 3.7). COVID‐19 pandemic‐related shifts in patterns of health care demand are likely to have contributed to the large increase in emissions from 2020 to 2021.19 Studies have shown that emissions from health care primarily result from use of electricity and energy embodied in goods and services that the health care sector needs for running its operations.88,89,90
Acknowledging that greenhouse gas emissions result in climate change that directly affects the health and wellbeing of the Australian population, and the need for the health care sector to reduce emissions associated with delivery of care, the Australian Government launched the National Health and Climate Strategy in December 2023. This is a step in the right direction, with the Strategy outlining actions for the next five years to transition to a net zero health care. It will be important for this transition to address all health care sector‐related greenhouse gas emissions, both direct and indirect.91,92 Digital solutions will be part of this transition, and Box 14 provides a snapshot of digital health care opportunities for climate change mitigation and adaptation in Australia.
Finally, in October 2024, three national bodies — the Australian Commission on Safety and Quality in Health Care, the interim Australian Centre for Disease Control, and the Council of Presidents of Medical Colleges — produced a joint statement on working together to achieve sustainable high quality health care in a changing climate. The joint statement sets out three principles of sustainable health care and an agreement to work together on a framework for action focusing on low emissions models of care and mobilising and supporting the health workforce.112
Summary
The intersection of climate change mitigation and public health represents an opportunity for transformative actions that benefit both the environment and human wellbeing. However, the findings in this section demonstrate that efforts need to be accelerated in Australia, given that fossil fuel dependence remains high and the country is likely to face substantial challenges in meeting its net‐zero target. Coordinated and multisectoral action will be essential for achieving both climate and health goals.
Section 4: Economics and finance
This section reports economic losses from climate‐related extreme events and investigates financial and economic mechanisms that have been implemented to protect human health from the impacts of climate change. The methods used for these indicators in previous reports have been adopted again this year. We examine inflation‐adjusted total insured losses from disaster events in Australia as provided by the Insurance Council of Australia. We also focus on recent developments with regards to the renewable transition of the electricity sector and the mitigation of carbon emissions. Indicators measure investment into coal and clean energy generation, employment in the renewable energy sector and high‐carbon industries, funds divested from assets involved in the extraction of fossil fuels, as well as progress in reducing electricity generation from coal‐fired power stations. We also report recent developments on carbon pricing and estimated fossil fuel subsidies in Australia.
4.1 Economic losses due to climate‐related extreme events
This indicator tracks the total insured economic losses from disaster events and is based on numbers provided by the Insurance Council of Australia (Supporting Information, 4.1).113 Box 15 plots inflation‐adjusted (base year 2019) cumulative annual insured losses arising from bushfires, cyclones, flooding, hailstorms, storm flooding, and tornadoes. For 2023, major losses were attributed to a hailstorm in Newcastle in May; tropical cyclone Jasper in December; and severe storms in Queensland, New South Wales and Victoria between 23 and 26 December. Total annual insured losses from catastrophes in Australia were $0.923 billion — the lowest amount since 2012 and an 86% decrease from 2022. Despite this drop, the average inflation‐adjusted annual insured loss over the past five years was the highest on record at $3.479 billion.
4.2 Clean energy investment
This indicator reports investment in new coal and renewable zero‐carbon energy based on generation capacity in the Australian National Electricity Market (NEM) (Supporting Information, 4.2). According to the latest report of the Australian Government Australian Energy Regulator114 and the Australian Energy Market Operator (AEMO),115 currently there is no planned investment into new coal‐fired generation, while generation from renewables keeps increasing. In the financial year 2022–23, 2400 MW of additional renewable electricity generation capacity entered the market, while 1500 MW of coal‐fired generation and 120 MW of gas‐fired generation were removed (Box 16). For the period 2023–2027, committed generation investment includes over 2700 MW in solar energy, over 5200 MW in wind energy, and 4500 MW in batteries. At the same time, in May 2024 the NSW Government decided to extend the operational life of the major coal‐fired power station in Eraring from mid‐2025 to August 2027. In December 2024, CSIRO released its draft GenCost 2024–25 report, an annual assessment of Australia's future electricity generation costs. For the seventh year in a row, it found that renewables have the lowest cost of any new‐build electricity generation technology.116,117
4.3 Employment in low‐carbon and high‐carbon industries
This indicator reports full‐time equivalent (FTE) employment in low‐carbon and high‐carbon industries (Supporting Information, 4.3). Unfortunately, there has been no update for direct FTE employment in renewable energy activities in Australia by the Australian Bureau of Statistics since 2020. The latest estimate is available for the 2018–19 financial year, suggesting an FTE employment of 26 850.118
Employment in the mining sector was chosen as a key representative for employment in high‐carbon industries. FTE employment in mining operations has increased by 8.9% to about 220 000 for the 2022–23 financial year.119 The June 2024 release of the quarterly Australian Labour Account120 suggests that this number has further increased to 238 500 over the 2023–24 financial year. These figures indicate that FTE employment in the mining sector in Australia has been growing and is substantially higher than FTE employment in the renewable energy sector.
4.4 Funds divested from fossil fuels
Shifting finance away from fossil fuels is an effective way to drive the transition to renewables.19 We provide two indicators for tracking divestment from fossil fuels in Australia (Supporting Information, 4.4). The first indicator tracks the number of companies and organisations that have partially or entirely committed to divest themselves of assets involved in the extraction of fossil fuels and generation of energy from fossil fuels. Data from the Global Fossil Fuel Divestment Commitments Database121 suggest 214 divesting institutions in Australia, indicating no additional commitments as of December 2024 compared with that reported in our previous report.14 Only two of the 214 are health care institutions.
The second indicator measures the withdrawal of capacity from coal‐fired emission intensive generation. Since 2013, over 3000 MW of black coal and 3100 MW of brown coal generation assets have been removed from the market.114 According to AEMO,122,123 in the most likely scenario, around 90% of the NEM's 21 GW of coal capacity are projected to retire before 2035, and the entire fleet before 2040. This suggests further substantial divestment from fossil fuels will occur in the Australian energy sector over the next decade.
4.5 Net value of fossil fuel subsidies and carbon prices
This indicator reports the net value of fossil fuel subsidies and carbon prices in Australia (Supporting Information, 4.5). The Organisation for Economic Co‐operation and Development reported that Australia's total fossil fuel subsidies were $13.89 billion in 2022.124 A recent report from the Australia Institute suggests that the total assistance to fossil fuel producers and major users from Australian federal and state governments was $14.5 billion in 2023–24.125 In 2023, the total carbon price revenues were reported to be zero.126
The total emissions of CO2 were reported to be 433 Mt for 2022.127 The calculation of the subsidy per tonne of CO2 (subsidy/emissions) therefore equals $32.1 per tonne of CO2, with a carbon price per tonne of CO2 of zero. The net carbon price (the carbon price less the subsidy) equals ‐$32.1 per tonne of CO2.
Australia does not currently have an explicit carbon price. In 2023, the Australian Government announced the implementation of the Safeguard Mechanism that came into effect on 1 July 2023. It requires large carbon emitters, which are defined as facilities that emit more than 100 000 tonnes of CO2 per year, to offset excess emissions above an assigned baseline by purchasing and surrendering Safeguard Mechanism Credits or Australian Carbon Credit Units.128 Under this scheme, facilities can purchase carbon credits at a set price of $75. In addition to this scheme, the Australian Energy Market Commission129 announced the value of emissions reduction, which measures the dollar value per tonne of avoided emissions. The value is set at $70 per tonne in 2024, increasing every year and expected to reach $420 per tonne by 2050. This price estimates the cost of avoiding greenhouse gas emissions to meet Australia's emission reduction target.
Summary
This section highlights the losses from climate‐related hazards as well as efforts aimed at reducing the impacts of climate change on human health from an economic and finance perspective. Although economic losses from climate‐related extreme events in 2023 were lower than in the previous three years, the indicator illustrates a trend of rising losses from climate hazards for Australia based on a five‐year rolling window period. The indicators also show continued substantial investment into generation capacity from renewables, while there is no planned investment into new coal‐fired generation assets. However, the NSW Government decided to extend the operational life of the Eraring coal‐fired power station by two years to tackle concerns about reliability of electricity supply. The indicators also show that employment in the high‐emitting mining sector has further increased at an annual rate of about 8–9% between 2022 and 2024. The indicators also evidence plans of a substantial divestment from coal‐fired generation in the Australian energy sector, projecting the retirement of 90% of coal capacity before 2035. However, there has been no growth in companies committed to divest themselves of assets involved in the fossil fuel industry. Finally, despite the introduction in 2023 of the Safeguard Mechanism that requires large carbon‐emitting industry facilities to offset excess emissions above an assigned baseline level, Australia still does not have an explicit carbon price. Moreover, Australian energy ministers have agreed to determine a continuously increasing value of emissions reduction in dollars per tonne and have set this value at $70 for 2024.
Section 5: Public and political engagement
The engagement of communities and elected representatives is an essential prerequisite for action on health and climate change — for efforts to ameliorate health impacts of climate change that are now unavoidable, and for efforts to reduce greenhouse gas emissions and mitigate future health impacts of climate change. The indicators reported in this section track engagement in health and climate change in media stories, scientific publications, research funding, and parliaments. For the first time, this section also reports on our new indicator on health and climate change litigation in Australia. This new indicator is based on records in the Australian and Pacific Climate Change Litigation database (https://law.app.unimelb.edu.au/climate‐change). The methods used in previous reports for all other indicators have again been adopted.
5.1 Media coverage of health and climate change
This indicator monitors media coverage of health and climate change topics in Australia. We used the Factiva media database (https://about.proquest.com/en/products‐services/factiva) to analyse content from 13 major Australian national and regional newspapers, along with Australian Broadcasting Corporation (ABC) online news and transcripts (Supporting Information, 5.1). In 2023, the total number of media articles on health and climate change (260) decreased by 15% compared with 2022 (306), a year marked by the federal election (Box 17). This reduction is slightly higher than the global decline of 10% during the same period.19 However, compared with ten years ago, the number of relevant media articles has nearly tripled in Australia. ABC's online coverage on health and climate change in 2023 also saw a 33% decrease from 2022. The most prominent climate change risks discussed were high temperatures and extreme weather events. The most frequently covered health issues were communicable diseases (9%), including pandemics, followed by non‐communicable diseases (6%) and mental health (6%). There was minimal focus on Aboriginal and Torres Strait Islander health or refugee health. Furthermore, there is a notable lack of coverage on adaptations and actions that the public can take to protect their health from climate change.
5.2 Scientific engagement in health and climate change
This indicator has tracked scientific publications on health and climate change in Australia from 2008 to 2023. We used the same methods as in the 2023 MJA–Lancet Countdown report to search for relevant publications in Scopus (Supporting Information, 5.2).14 In 2023, we identified 525 new scientific publications for Australia, marking a 29% increase from 2022 (407) and a 31‐fold increase since 2008 (Box 18). Although the growth rate was slower than the 75% observed in 2022, it was significantly higher than the global increase of 7% during the same period.19 Original research articles comprised 60% of the total publications. Most studies focused on health impact assessments, with very few evaluating the effectiveness of adaptation strategies. Temperature (15%) and bushfires (6%) remained the most studied exposures, associated with increased risks of mortality and both communicable and non‐communicable diseases, particularly in the eastern regions. A very small proportion (2%) of the publications focused on the traditional knowledge of Aboriginal and Torres Strait Islander populations.
5.3 Health and climate change research funding
Research on health and climate change in Australia is fundamental to Australia's understanding of and response to this critical issue. This indicator tracks the annual number of funded and not‐funded National Health and Medical Research Council (NHMRC) health and climate change grant applications from 2000 to 2023 (Box 19). The year 2023 saw a considerable increase in health and climate change grant applications — more than double that in the previous year, and the second highest number in this 24‐year period, with a total of 31 applications. However, compared with 2022, the success rate in 2023 decreased slightly, to 6%, the sixth lowest in this 24‐year period, meaning that just two of the 31 applications were funded (Supporting Information, 5.3).
5.4 Government engagement in health and climate change
Government engagement on health and climate change is an indication of the importance placed on the issue by decision makers. This indicator reports on government engagement by tracking bills, legislation, committees and inquiries in the parliaments of the Commonwealth of Australia and all eight states and territories (Supporting Information, 5.4). In 2023, the Parliament of Australia showed some engagement on the issues of climate change and health; however, the issues remain largely siloed (Supporting Information, table A1). An exception was the introduction of the Climate Change Amendment (Duty of Care and Intergenerational Climate Equity) Bill 2023 by independent Senator David Pocock. The Bill seeks to amend the Climate Change Act 2022 to “require decision‐makers to consider the health and wellbeing of children in Australia when making significant decisions,” but the Senate Standing Committee has recommended that the Bill not be passed into law.130 In addition, although not listed in the Terms of Reference, the final report of the inquiry into food security in Australia131 places great emphasis on the health issues of climate change and the impacts of climate change on Australia's food security and nutrition, and makes a number of recommendations regarding environmental sustainability. There was more engagement on climate and health in the state and territory parliaments, primarily being led by more left‐leaning governments. Fifteen Bills were introduced and 37 inquiries were held across the jurisdictions on topics discussing climate health issues (Supporting Information, tables A2 and A3).
5.5 Health and climate change litigation in Australia
Australia is a hotspot for climate litigation, with the second highest number of such cases globally.132,133 In its most recent Global Climate Litigation Report, the United Nations Environment Programme concluded that “litigation is central to efforts to compel governments and corporate actors to undertake more ambitious climate change mitigation and adaptation goals”.133 The health impacts of climate change “make litigation an important means of pursuing justice and strategically challenging legal systems”.22 Given the great importance and significance of health and climate change related litigation,20,21 it is valuable to know if such cases are occurring in Australia and, if so, to quantify, track and characterise such cases.
Relevant case records over the past decade (2014–2023) were located using the Australian and Pacific Climate Change Litigation database (Supporting Information, 5.5). A keyword search for health‐related terms was performed using the database's general search function. Some of the database case records included more than one decision, for instance, if there were prior procedural rulings in a case or if the original decision was appealed to a higher court. In these instances of a linked series of litigation, each was treated as a single case record. The full text judgments of court decisions or orders in each case record were read and analysed to determine the nature and significance of the health arguments made. Cases where references to health or related terms were merely incidental rather than indicating any meaningful engagement with health issues in the case were removed.
Health was raised as an issue in eleven Australian climate cases from 2014 to 2023 (Box 20). Health issues have been raised in three categories: (i) planning applications for developments that may exacerbate climate‐related health impacts (eg, heat stress, threats to life from bushfires and increased flooding); (ii) cases challenging coal mines or coal‐fired power stations on grounds including their impact on communities’ health; and (iii) cases arguing that the health effects of carbon‐intensive activities such as coal mines on vulnerable populations create a duty of care for decision makers or unjustifiably limit human rights. In category three cases, courts have extensively considered expert evidence concerning the primary, secondary and tertiary health impacts of climate change and the vulnerability of different populations to such impacts. In one of these cases, Sharma by her litigation representative Sister Marie Brigid Arthur v Minister for Environment, it is important to note that both the plaintiffs and respondents in this case did not dispute the accuracy of the evidence presented. Thus, they all agreed on the evidence concerning the health impacts. This is a legally significant acceptance, by government, of the science concerning the health impacts of climate change.
Summary
In 2023, there was less Australian media attention to health and climate change than there was in 2022, as measured by the number of articles on this topic in major newspapers and in ABC online content. This change might have resulted from a temporary uplift in 2022 during the federal election campaign. There was a 29% increase in scientific publications about health and climate change in Australia in 2023 compared with 2022. Temperature and bushfires remained the most studied health risks. In comparison with 2022, there were more than twice as many health and climate change grant applications to NHMRC in 2023, but the success rate was only 6% (two of 31 applications). State and territory parliaments continued to engage with climate change as a health issue in 2023, with 15 Bills introduced and 27 inquiries held on topics dealing with climate health issues. The national Parliament showed some engagement in 2023 as well. The new indicator of health and climate change litigation in Australia showed that health was raised as an issue in eleven climate cases from 2014 to 2023.
Aotearoa New Zealand
Research on health and climate change in Aotearoa New Zealand has grown steadily from 2008 to 2023 (more than a tenfold increase over this period), although the sharp increase in publications since 2018 seen in Australian research has not occurred for New Zealand publications (Box 18). The effects of high temperatures have received increasing attention in New Zealand. In the past, heat and human health has not been closely studied. But this is changing. In 2022, a study reported the hottest days of the year have warmed by more than 0.5°C since 2000 in much of New Zealand, and while the highest temperatures are typically recorded on the east coast, lower levels of temperature increase in northern population centres will dominate the risks of heat in the future.134 In 2023–2024, studies have included estimates of heat mortality (showing similar increases from 1990 to 2019 in heatwave‐attributable mortality in New Zealand cities to those observed in Australia),135 and child hospitalisations (higher rates of hospital admissions occur when local temperatures rise above about 24°C).136 Peaks in both temperature and rainfall have been linked to notifications of toxin‐producing Escherichia coli infections.137 The effect of heavy rainfall on the risk of enteric infections is a particular concern in New Zealand, given the occurrence of serious outbreaks in the past, poorly protected water supplies, and mounting evidence of vulnerabilities.138
Another notable development in New Zealand is the elaboration and dissemination of Indigenous (Māori) approaches to climate change. For example, research from New Zealand explores how Māori ways of knowing can broaden and deepen understandings of climate impacts and help shape responses to climate change.139 Further, a study published in 2024 presents an Indigenous climate change justice policy tool.140
More local opportunities for “win‐win” interventions have been reported. These include articles that analyse climate‐friendly health promoting diets141,142 and put numbers on the savings to climate and health that may be achieved by reducing the use of motor vehicles and increasing active transport.143 After almost two decades during which New Zealand greenhouse gas emissions remained more or less constant, since 2020, there have been welcome signs that overall emissions, including those from agriculture, the biggest single contributor, have declined144 (Box 21). Whether this trend will be sustained, given the deletion of many climate policies by the coalition government elected in 2023, is not known.
Attention to adaptation has increased following unprecedented and highly damaging floods in 2023 (Box 22 and Box 23).146 Among the many exposures and vulnerabilities to be addressed will be the 47 443 New Zealanders who (in 2023) live within one metre of sea level. Health researchers have reported on new ways of ensuring community voices are included in planning for adaptation,147 and have also outlined steps that may be taken by the health sector to reduce harm caused by climate change.148 Nevertheless, the New Zealand Climate Change Commission, which has a statutory duty to review adaptation readiness, has concluded that not enough is being done, and where there is action, it proceeds too slowly.149
Conclusion: the MJA–Lancet Countdown in 2024
Our analyses show that the exposure to heatwaves is growing in Australia, increasing the risk of heat stress and other health threats such as bushfires and drought. Our analyses also highlight continuing deficiencies in Australia's response to the health and climate change threat. A key component of Australia's capacity to respond to bushfires, its number of firefighting volunteers, is in decline, dropping by 38 442 people (17%) in just seven years. Australia's total energy supply remains dominated by fossil fuels (coal, oil and natural gas), and although energy from coal decreased from 2021 to 2023, that from oil increased, and transport energy from petrol jumped substantially in 2021–22 (the most recent year for which data are available). Greenhouse gas emissions from Australia's health care sector in 2021 jumped to their highest level since 2010.
In other areas, some progress is being made. The Australian Government completed the first pass of the National Climate Risk Assessment, which included health and social support as one of the eleven priority risks, based in part on the assessed severity of impact. Renewable sources such as wind and solar energy now provide almost 40% of Australia's electricity, with growth in both large‐scale and small‐scale (eg, household) renewable generation and battery storage systems. The sale of electric vehicles reached an all‐time high in 2023 of 98 436, accounting for 8.47% of all new vehicle sales.
While Australia had a reprieve from major catastrophic climate events in 2023, New Zealand experienced cyclone Gabrielle and unprecedented floods which contributed to, by far, the highest displacement of people and insured economic losses over the period of our analyses (ie, since the year 2010 and 2000 respectively). Key findings from this report are presented in Box 24.
Nationally, regionally and globally, the next five years are pivotal in reducing greenhouse gas emissions and transitioning energy production to renewables. Australia is now making progress in this direction. This progress must continue and accelerate, and the remaining deficiencies in Australia's response to the health and climate change threat must be addressed. There are strong signs that Australians are increasingly engaged and acting on health and climate change, and our new indicator on health and climate change litigation in Australia demonstrates the legal system is active on this issue in this country. Our 2022 and 2023 reports signalled our intentions to introduce indicators on Aboriginal and Torres Strait Islander health and climate change, and mental health and climate change in Australia. Although the development of appropriate indicators is challenging, these are key areas, and we expect our monitoring of them will commence in our next report.
Box 1 – The five sections and 25 indicators of the 2024 MJA–Lancet Countdown report
|
Section |
Indicator |
||||||||||||||
|
|
|||||||||||||||
|
1 Health hazards, exposures and impacts |
1.1 Exposure of vulnerable populations to heatwaves |
||||||||||||||
|
1.2 Heat and physical activity |
|||||||||||||||
|
1.3 Bushfires |
|||||||||||||||
|
1.4 Drought |
|||||||||||||||
|
2 Adaptation, planning and resilience for health |
2.1 Health adaptation plans and assessments |
||||||||||||||
|
2.2 Detection, preparedness and response to health emergencies |
|||||||||||||||
|
2.3 Migration and displacement |
|||||||||||||||
|
2.4 Bushfire adaptation |
|||||||||||||||
|
3 Mitigation actions and health co‐benefits |
3.1 Energy systems and health |
||||||||||||||
|
3.2 Clean household energy |
|||||||||||||||
|
3.3 Exposure to particulate matter air pollution in cities |
|||||||||||||||
|
3.4 Sustainable and healthy transport |
|||||||||||||||
|
3.5 Emissions from agricultural production and consumption |
|||||||||||||||
|
3.6 Diet and health co‐benefits |
|||||||||||||||
|
3.7 Health care sector emissions |
|||||||||||||||
|
4 Economics and finance |
4.1 Economic losses due to climate‐related extreme events |
||||||||||||||
|
4.2 Clean energy investment |
|||||||||||||||
|
4.3 Employment in low‐carbon and high‐carbon industries |
|||||||||||||||
|
4.4 Funds divested from fossil fuels |
|||||||||||||||
|
4.5 Net value of fossil fuel subsidies and carbon prices |
|||||||||||||||
|
5 Public and political engagement |
5.1 Media coverage of health and climate change |
||||||||||||||
|
5.2 Scientific engagement in health and climate change |
|||||||||||||||
|
5.3 Health and climate change research funding |
|||||||||||||||
|
5.4 Government engagement in health and climate change |
|||||||||||||||
|
5.5 Health and climate change litigation in Australia |
|||||||||||||||
|
|
|||||||||||||||
|
|
|||||||||||||||
Box 2 – Nationally averaged Australian heatwave season (November–March) accumulated excess heat factor (EHF) for the past 20 heatwave seasons (2004–2005 to 2023–2024) (blue)*
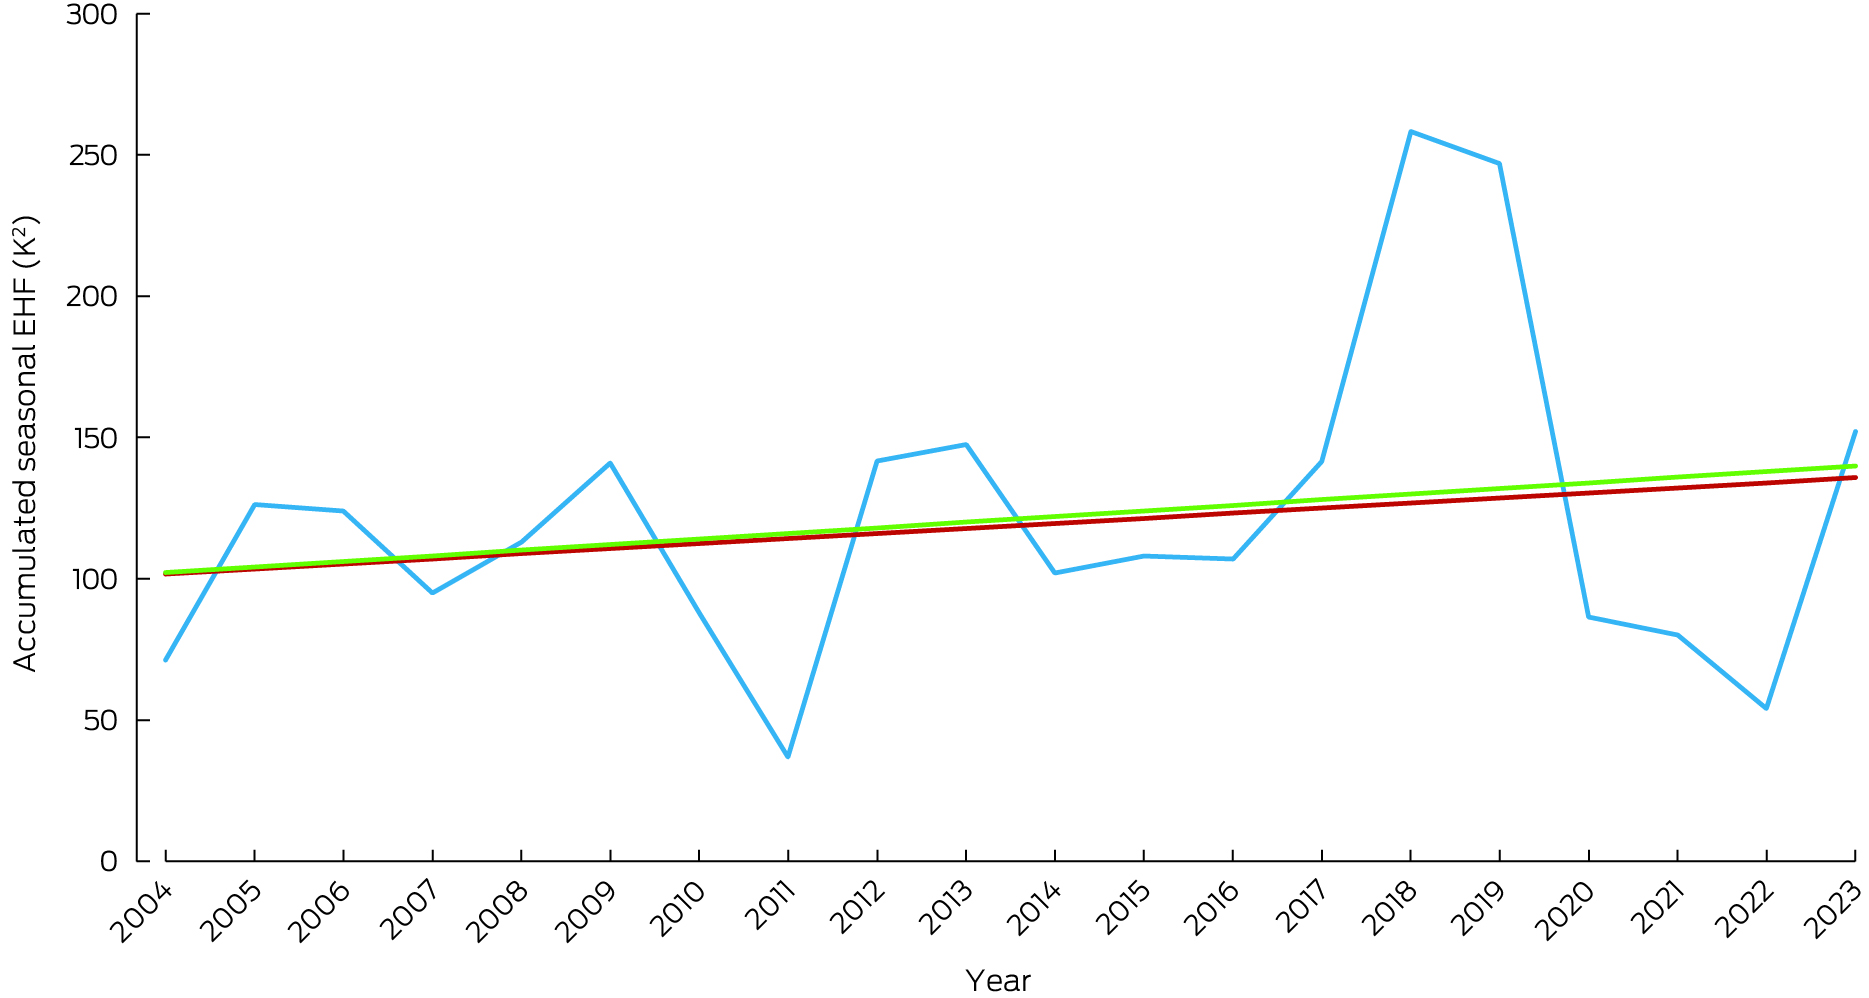
* The red trend line is calculated over the past 50 heatwave seasons (1974–1975 to 2023–2024), and the green trend line is calculated over the past 20 heatwave seasons. Data source: Bureau of Meteorology.
Box 3 – Annual person‐days bushfire exposure (green) and population‐weighted number of days exposed to very or extremely high bushfire danger (red) in Australia, 2003–2023*
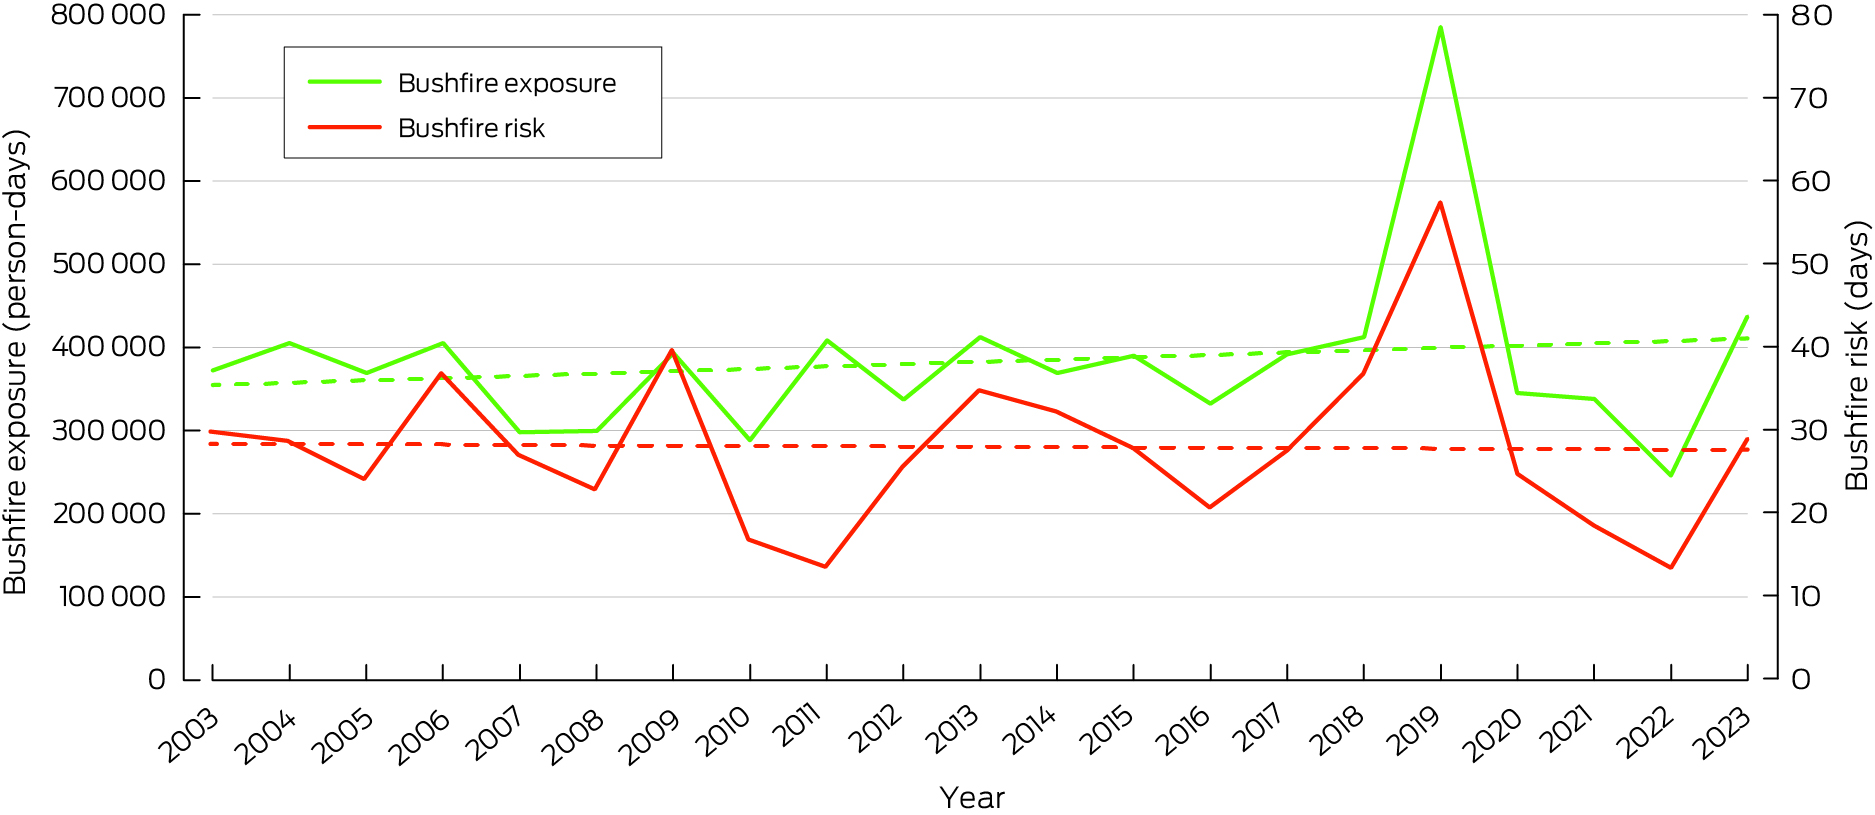
* Dashed lines show trends.
Box 4 – The nursing response to health and climate change in Australia
- Although the International Council of Nurses (ICN) has long recognised the link between climate change and health,36 Australia's nursing workforce has visibly increased its involvement in climate action only recently by playing critical roles in climate education, advocacy, sustainable practices, public health initiatives, research and innovation, adopting sustainable practices and fostering collaborations to promote climate action and environmental health initiatives.37 The primary challenge facing the profession is the need to enhance its capacity to respond to climate change through active engagement and visible leadership at decision‐making tables.38
- Early education in nursing pre‐registration programs is essential to enhance the profession's capacity to deliver climate‐related interventions effectively.39 Subsequently, the Australian College of Nursing has called for integrating the climate–health nexus into pre‐registration nursing curricula as a priority.40 Additionally, the ICN Code of Ethics for Nurses, which applies to Australian nurses, acknowledges this responsibility as part of ethical nursing practice.41 However, nursing academics often lack the knowledge, skills, and resources to implement climate change education into their curricula.42 Addressing this gap, the Planetary Health Collaborative for Nurses and Midwives: Research and Education Collaborative43 established a consensus on the knowledge and skills essential for undergraduate nursing students to promote sustainable health care.44 This framework was distributed nationwide by the Council of Deans of Nursing and Midwifery, facilitating adaptation to meet the Australian Nursing and Midwifery Accreditation Council Registered Nurse Accreditation Standards. The framework is now being adapted for midwifery undergraduate curricula. To inspire current and future nurses, the Collaborative also compiled case studies of nurse leaders involved in climate initiatives45 and shared sustainability practices in clinical teaching laboratories.46
- Australian nurses actively engage in climate advocacy, both individually and through organisations such as Climate Action Nurses,47 and the Australian Nursing and Midwifery Federation (ANMF) Victorian Branch.48 They participate in United Nations Framework Convention on Climate Change (UNFCCC) Conference of the Parties (COP) meetings to ensure nursing representation in global climate discussions. For example, Janine Mohammed, an Indigenous nurse leader and former CEO of the Lowitja Institute, advocated strongly at COP28 for Aboriginal and Torres Strait Islander leadership in climate policy and solutions.49 The Lowitja Institute's discussion paper, Climate change and Aboriginal and Torres Strait Islander health, emphasises the shared responsibility for climate responses, the need for Indigenous‐led initiatives in adaptation and mitigation, and the value of traditional knowledge in environmental stewardship.50 The connection between nature and human health is further exemplified by initiatives such as the nurse‐led horticultural therapy at Austin Health's Royal Talbot Rehabilitation Centre in Melbourne, Victoria, running as a full‐day horticultural rehabilitation program.45
- Nurses are most visible as champions of environmental sustainability. While the ANMF (Victoria) provides support, education resources, and strategies to nurses across Victoria and holds an annual Health and Environmental Sustainability conference,48 another notable example is nurse‐led initiative Save Our Supplies, which collects clean, usable medical supplies from hospitals across Queensland and redistributes them to areas of need, such as low income countries, including Papua New Guinea, Solomon Islands, Cambodia and Fiji, and to homeless and disaster‐impacted areas. In 2022, they diverted about 20 tonnes of usable medical supplies from landfill, benefiting an estimated 700 000 people.45
- These examples of growing evidence of nursing commitment to a sustainable future strengthens the health care system's resilience and empowers communities to face climate challenges.
Box 5 – Annual displacement of people caused by weather‐related disaster in Australia, 2008–2023
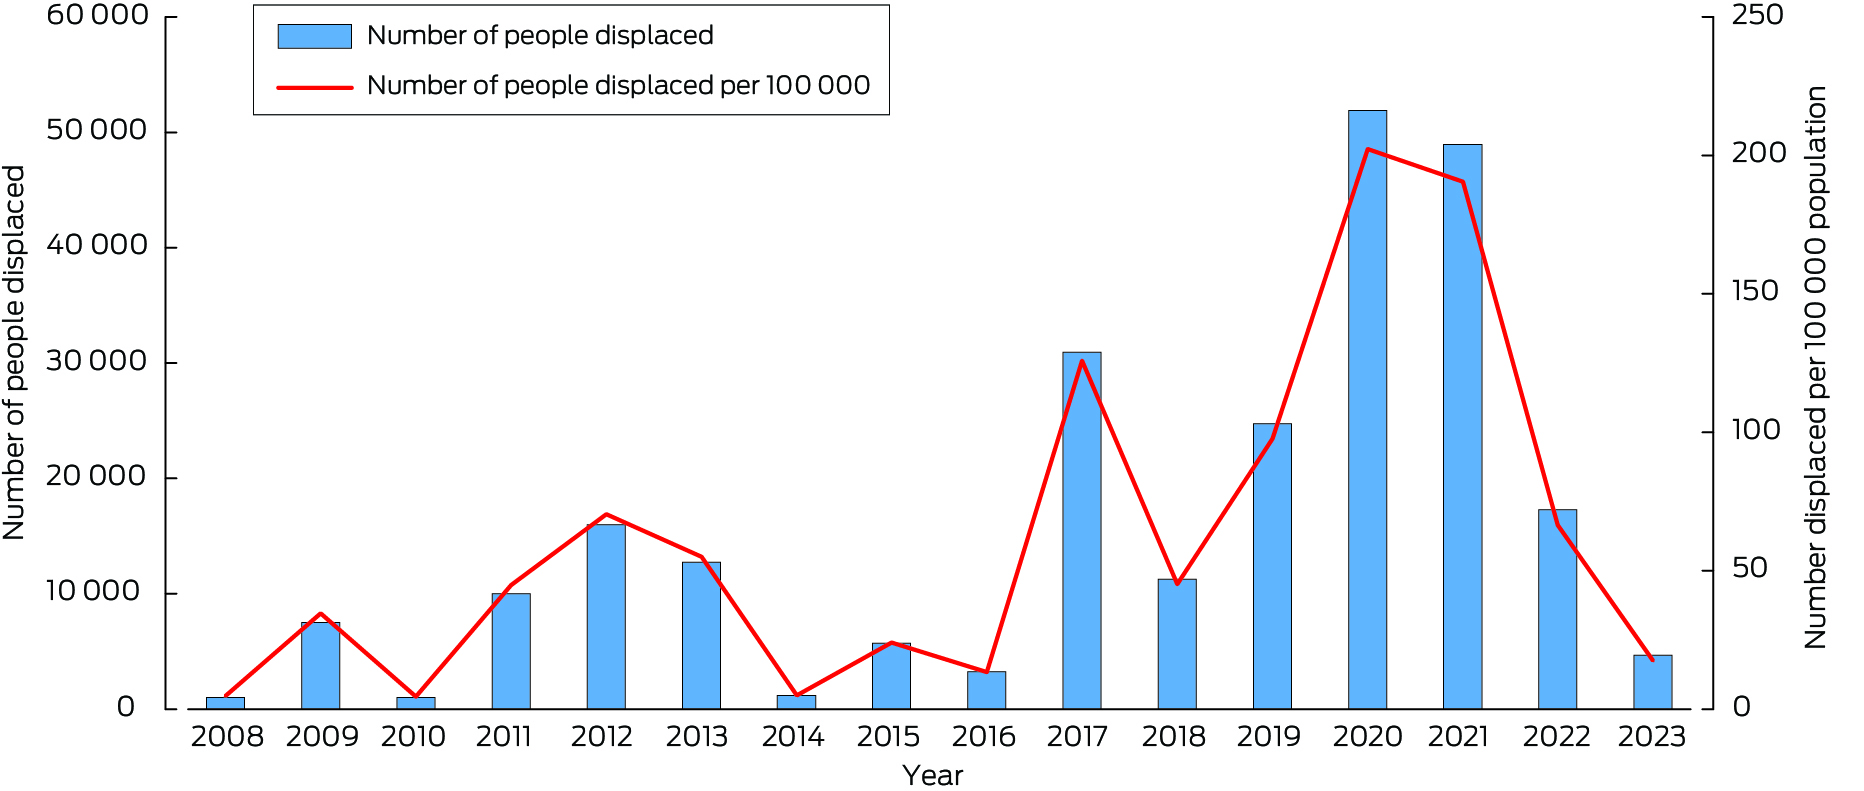
Data sources: Internal Displacement Monitoring Centre;61 World Bank.62
Box 6 – Annual number of National Aerial Firefighting Centre (NAFC) aircraft services and volunteer firefighters and support staff in Australia from 2007–08 to 2022–23*
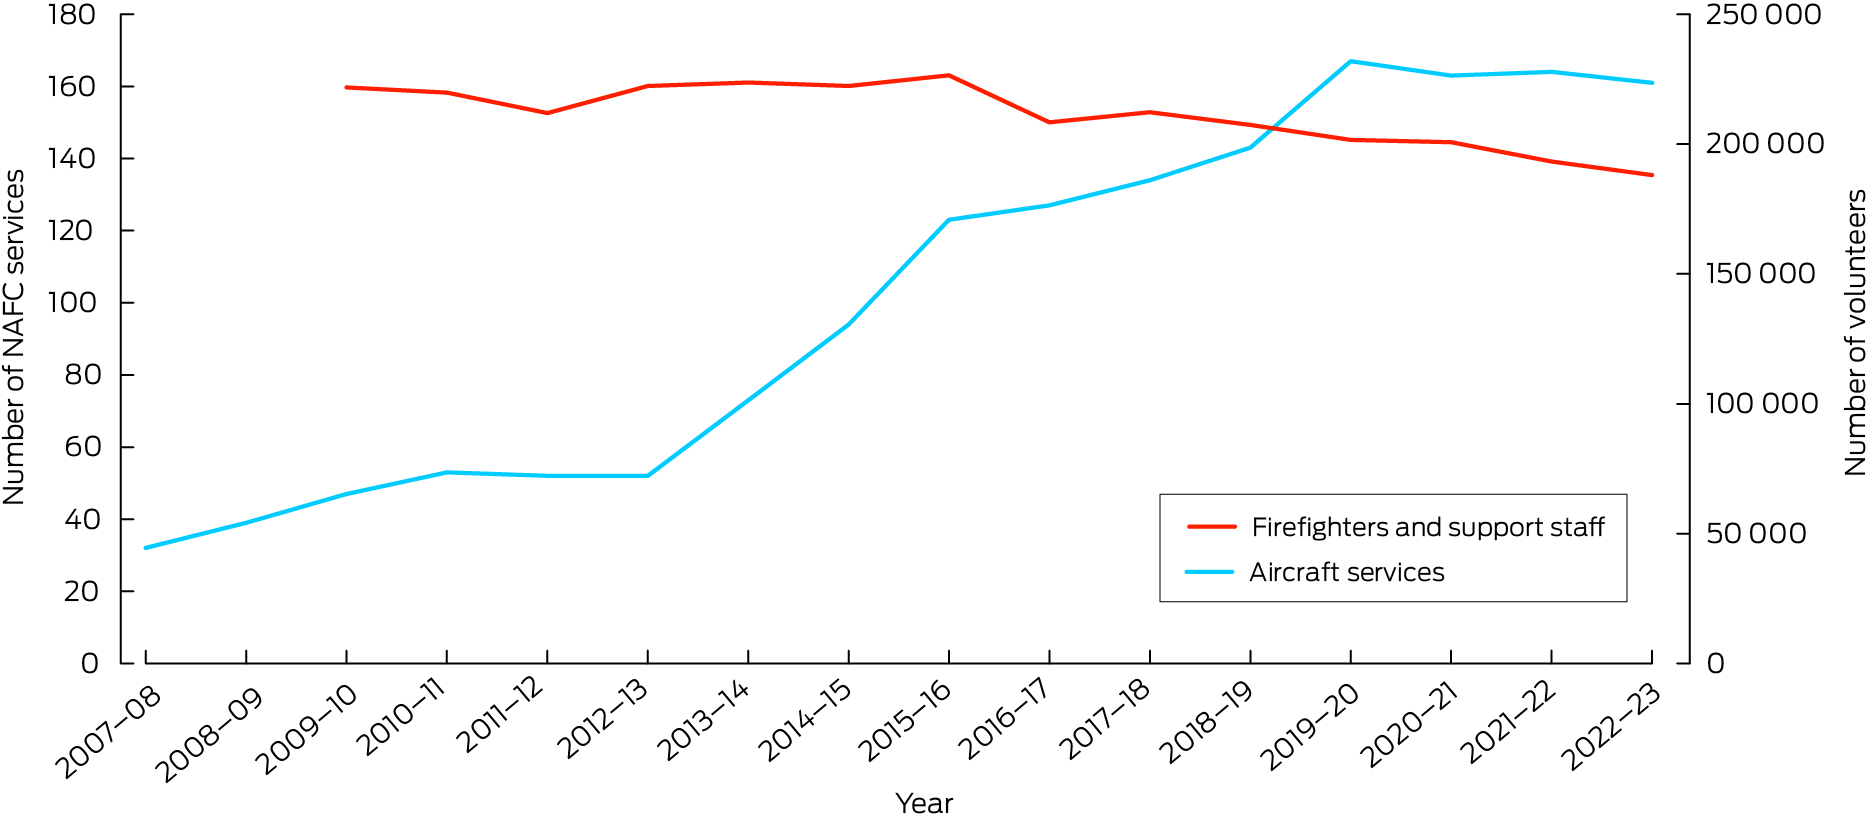
* NAFC aircraft services represent the number of aircraft in Australia available to fight bushfires. Note that some aircraft double up for the north and south of the country; for example, an aircraft might run in Queensland then move to Tasmania as a separate service. A service is usually exclusive to NAFC use, mostly for 84 or 96 days each summer (some services run longer). Data sources: NAFC; Australian Government Productivity Commission.64
Box 7 – Annual Australian electricity generation, by fuel type, from 2015 to 2023
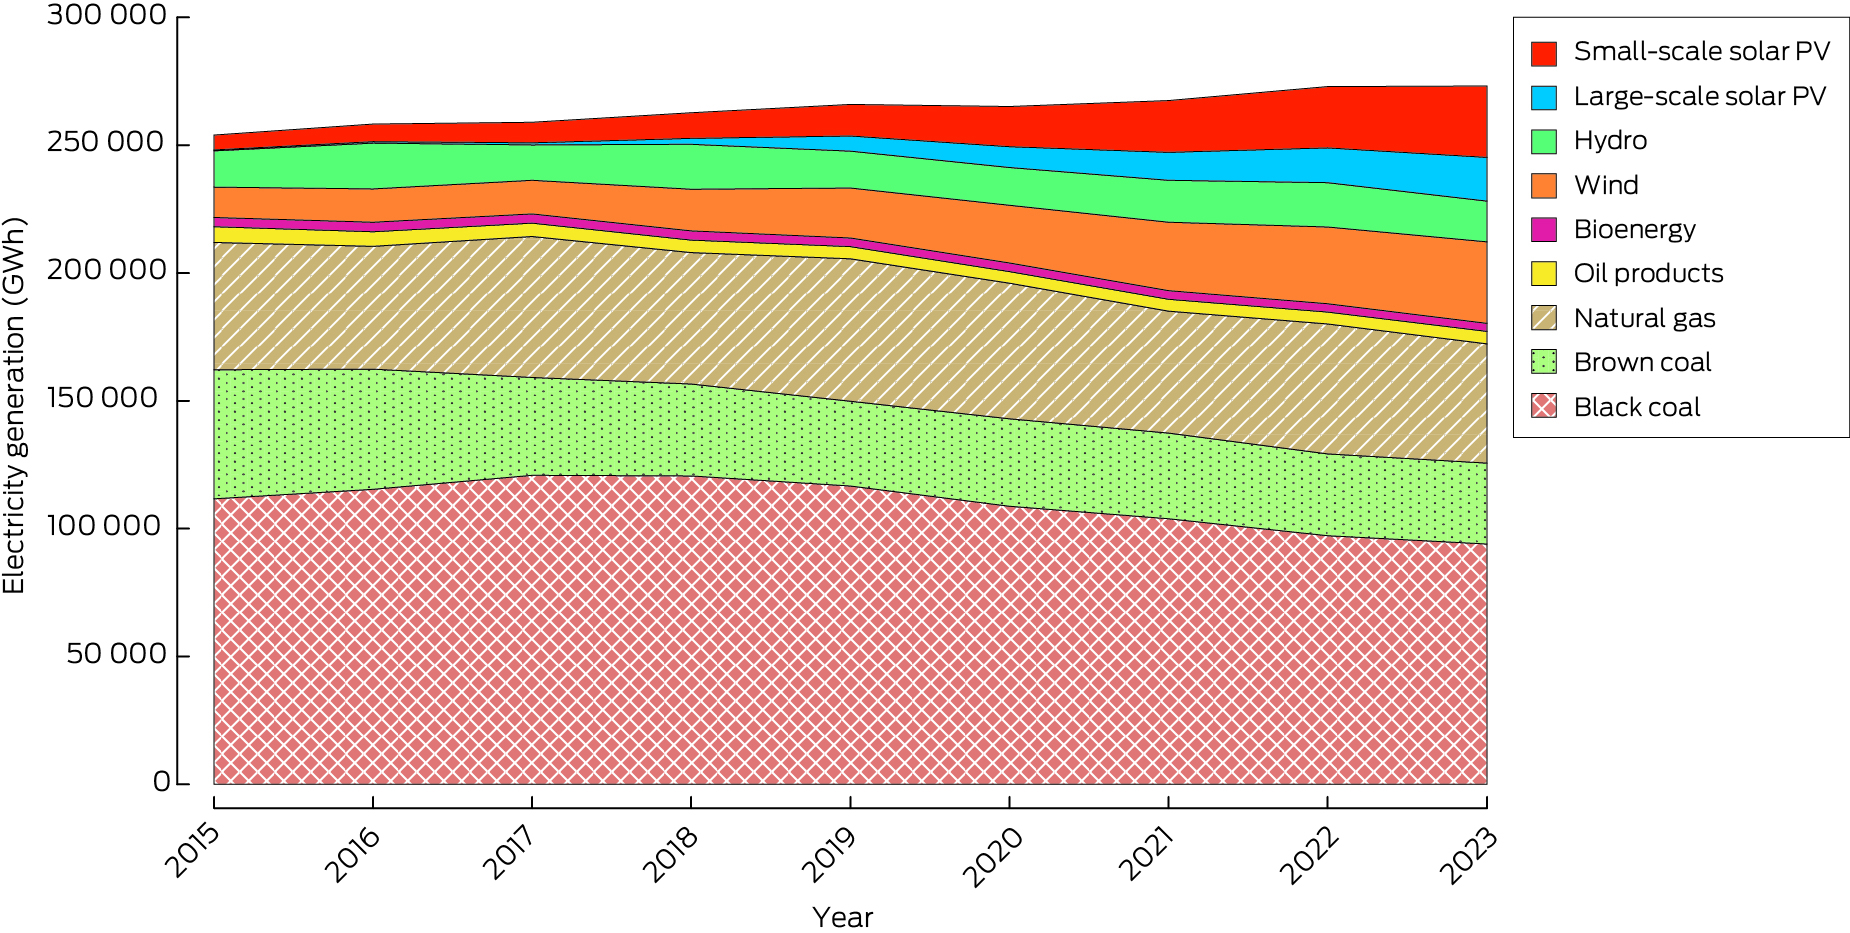
GWh = gigawatt hours; PV = photovoltaic. Geothermal not shown due to its negligible contribution to electricity generation (0.0–0.4 GWh over this period). Data source: Australian Government Department of Climate Change, Energy, the Environment and Water.68
Box 8 – Total energy supply by source, Australia 1990–2023
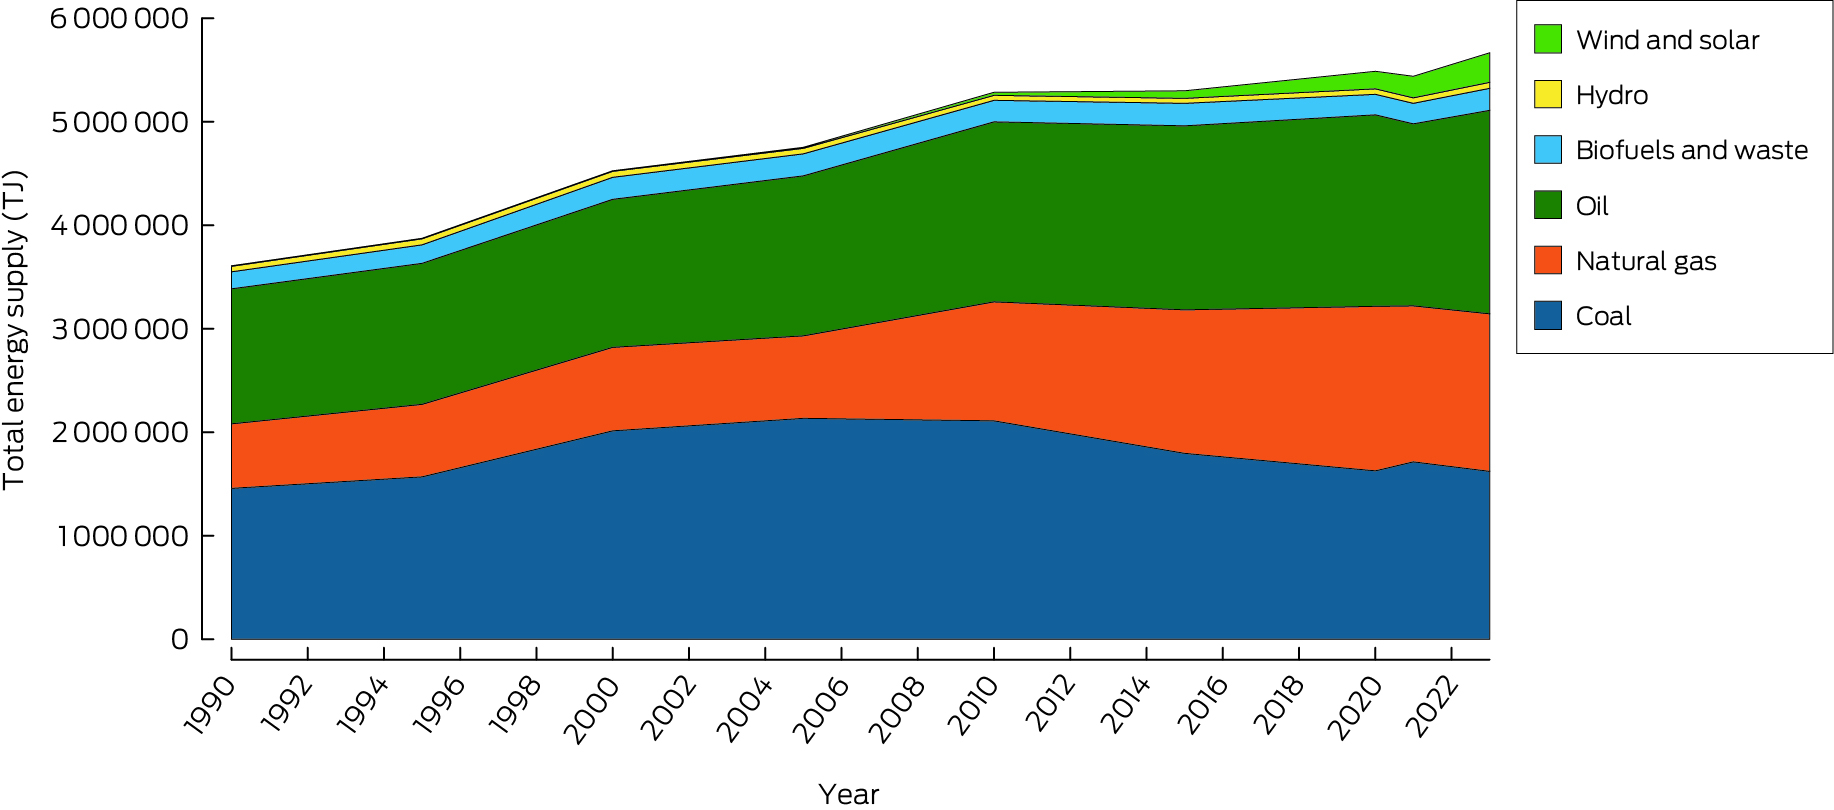
TJ = terajoules. Data source: International Energy Agency.69
Box 9 – Annual (financial year) Australian transport energy consumption by fuel types, 2011–12 to 2021–22
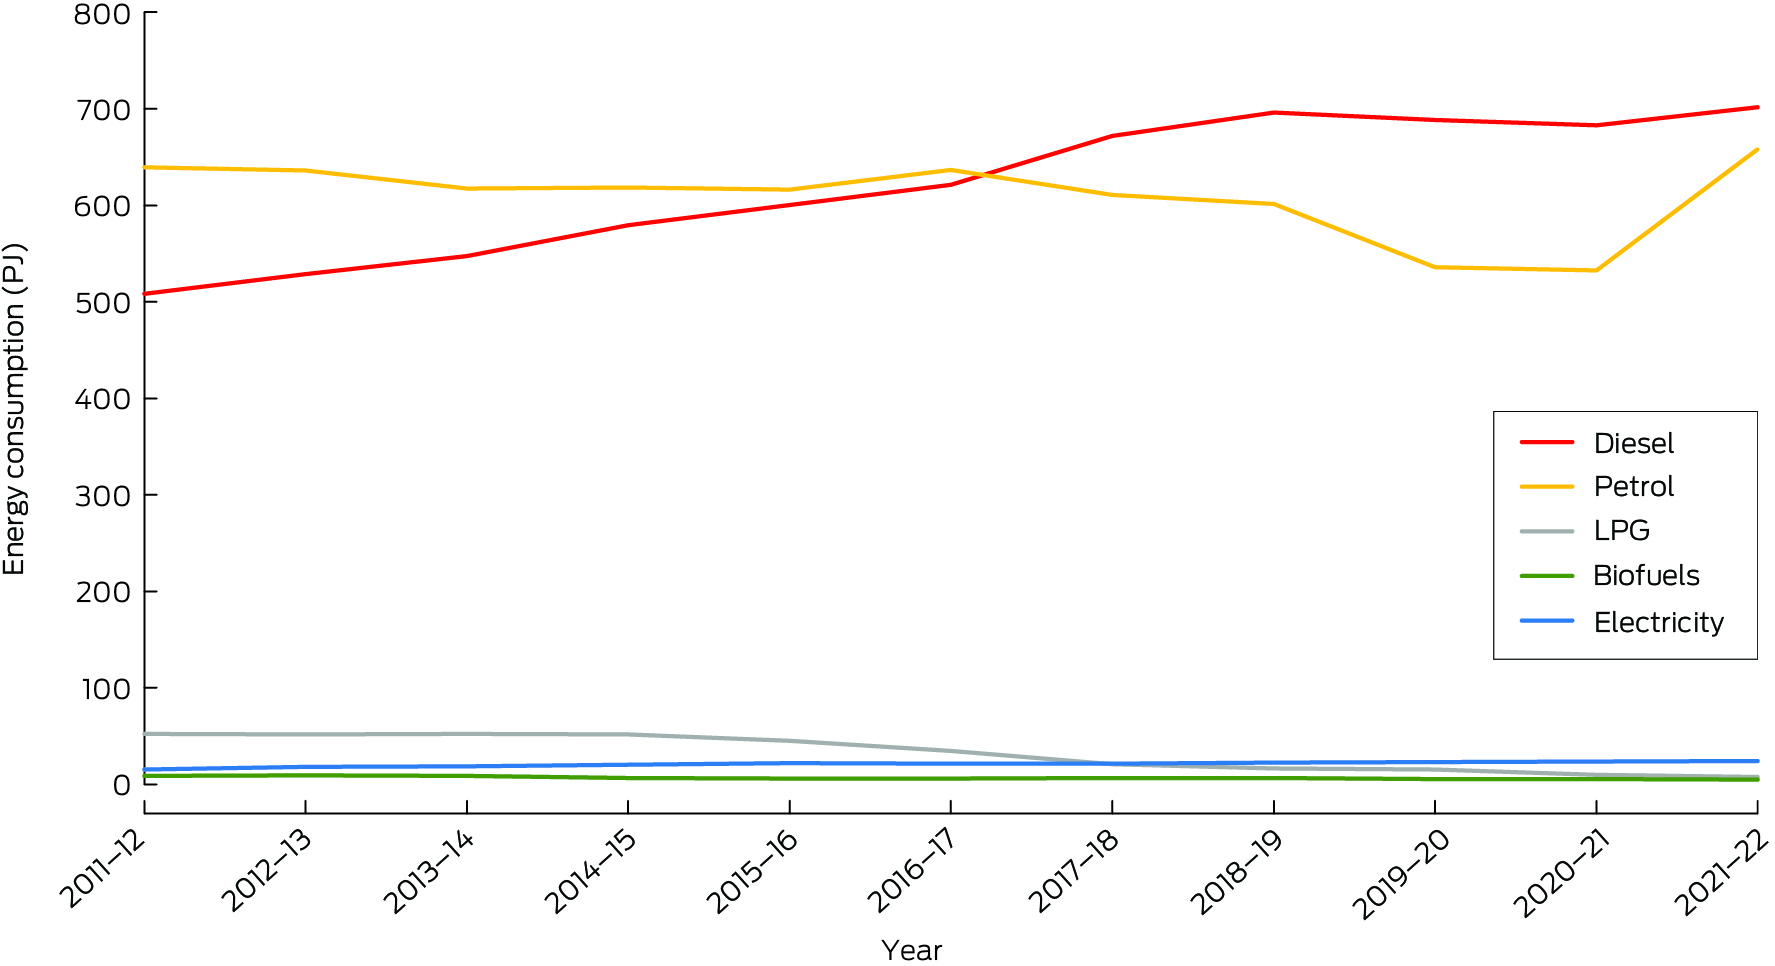
LPG = liquid propane gas; PJ = petajoules. Data source: Department of Climate Change, Energy, the Environment and Water.80
Box 10 – Annual number of electric vehicle (EV) sales in Australia, 2011–2023, and corresponding percentage of total light vehicle sales
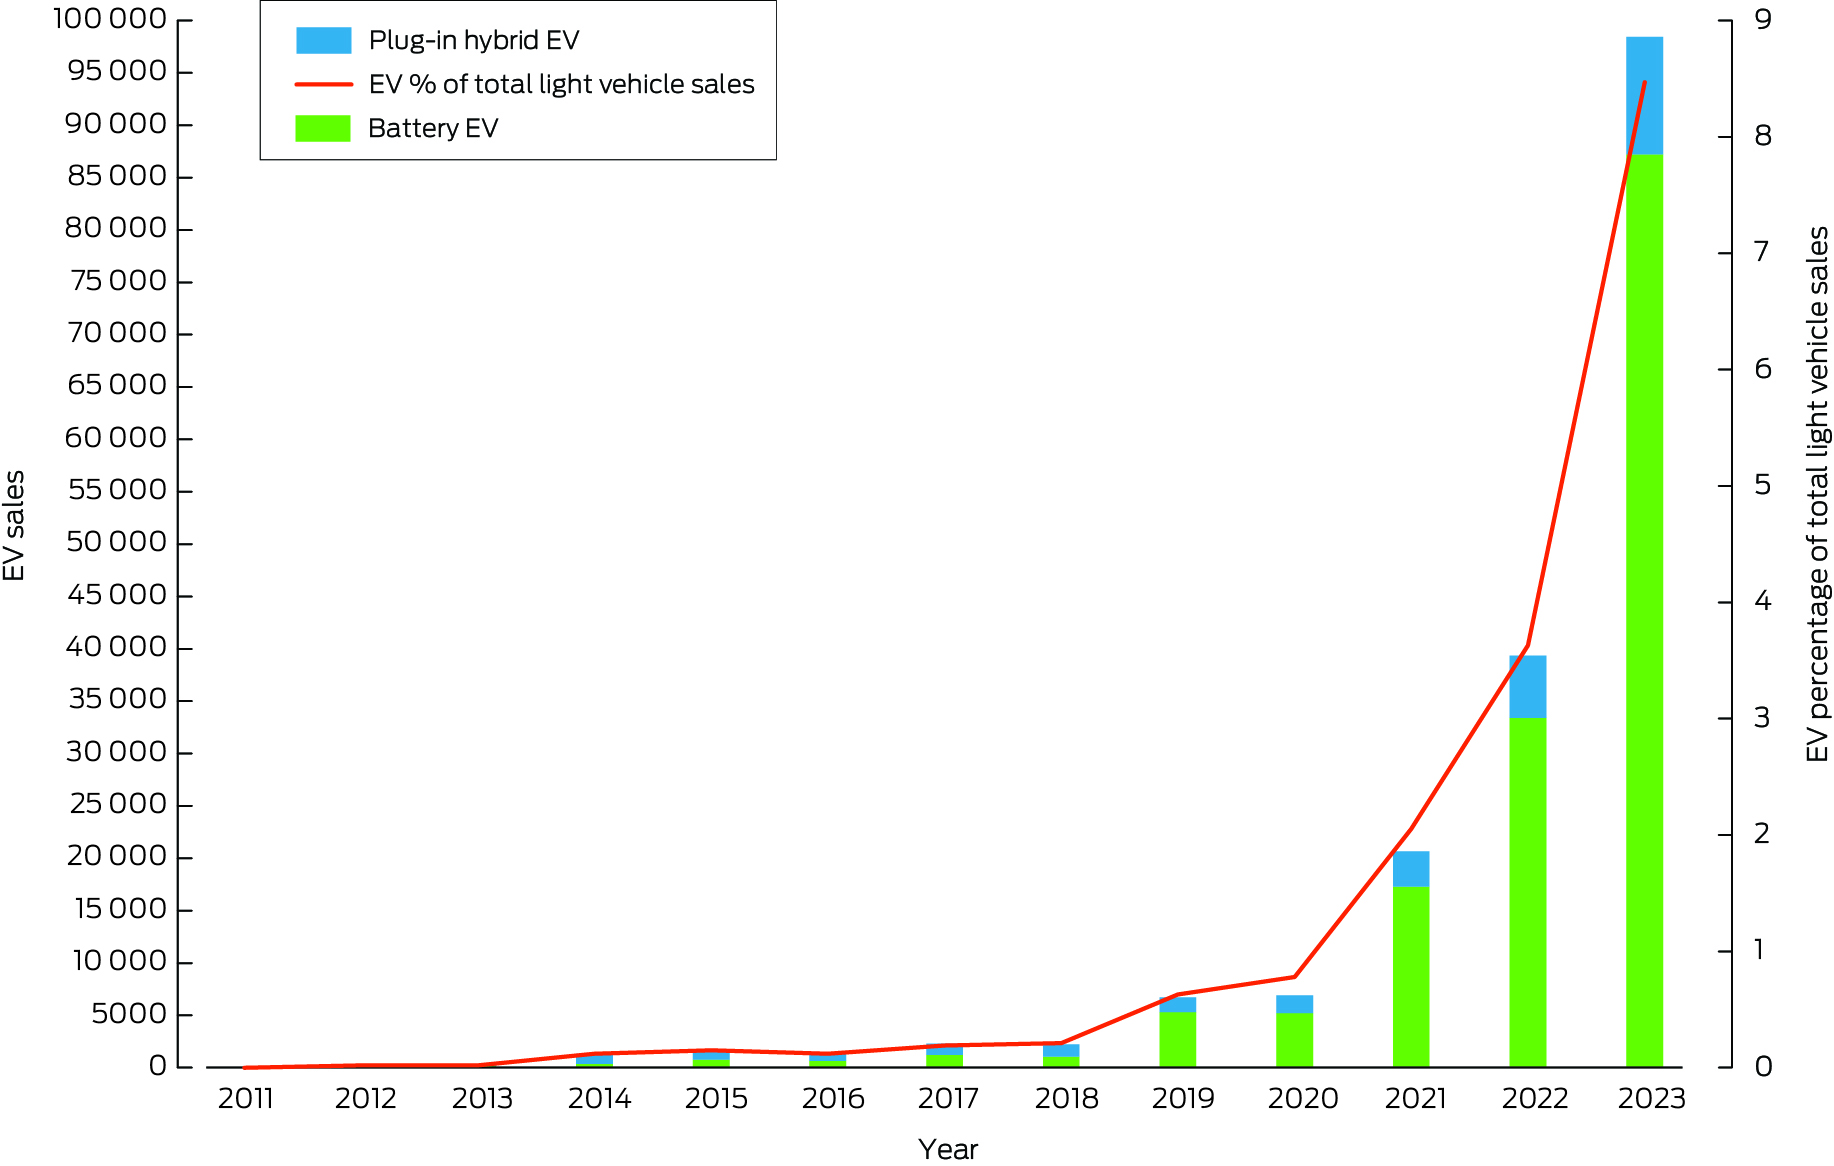
Data source: Electric Vehicle Council.81
Box 11 – Annual greenhouse gas emissions from food production in Australia by commodity from 1995 to 2021
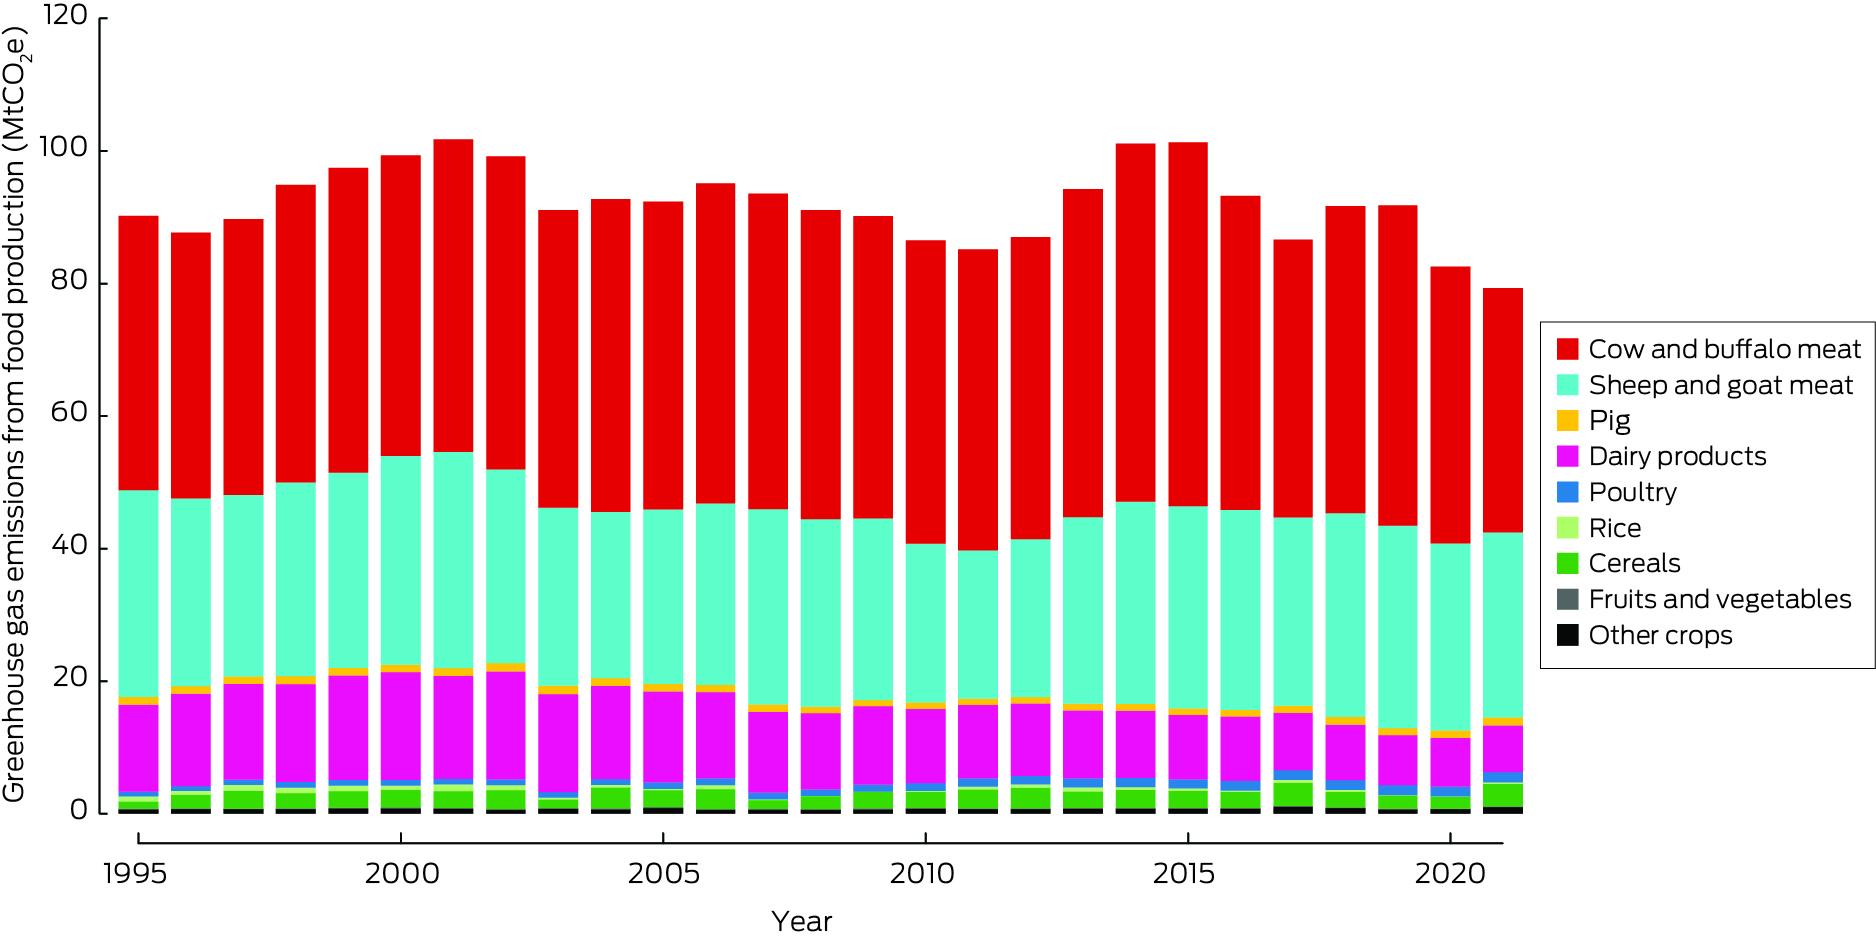
MtCO2e = megatonnes of carbon dioxide equivalent.
Box 12 – Deaths attributable to unbalanced diets in Australia annually from 2015 to 2021*
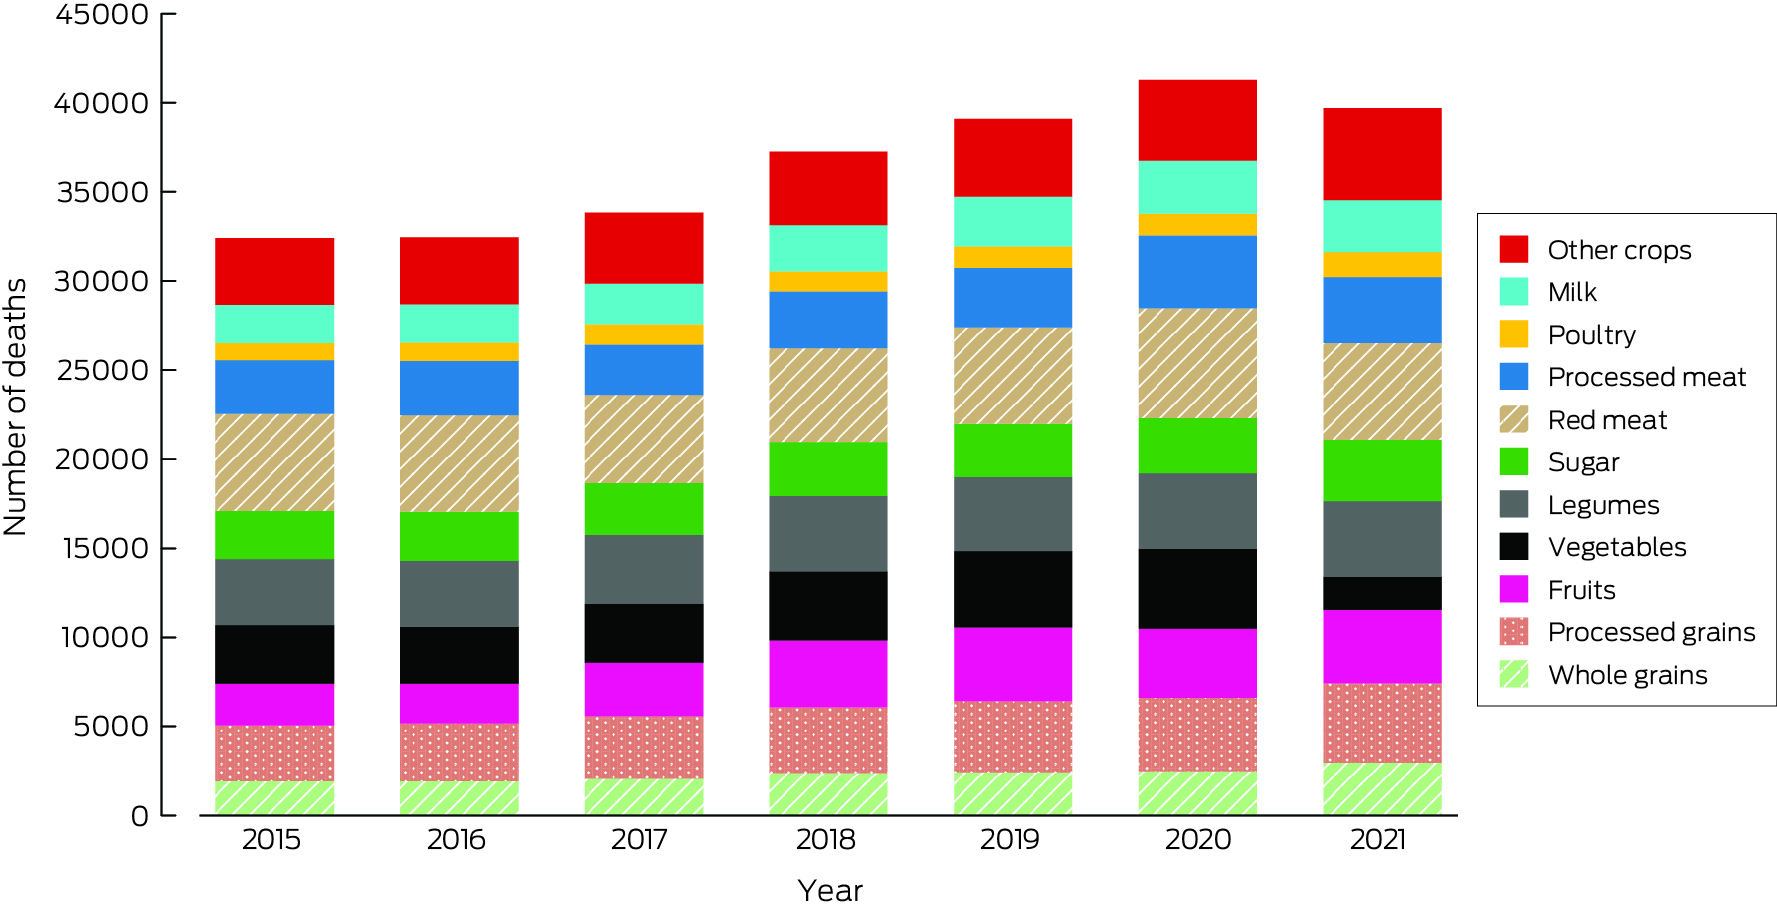
* Deaths are attributable to insufficient consumption of whole grains, fruits, vegetables and legumes, and excessive consumption of processed grains, sugar, red meat, processed meat, poultry and milk. Only major contributors to diet‐related deaths are shown.
Box 13 – Greenhouse gas emissions (absolute and per capita) from 2010 to 2021 from Australia's health care sector
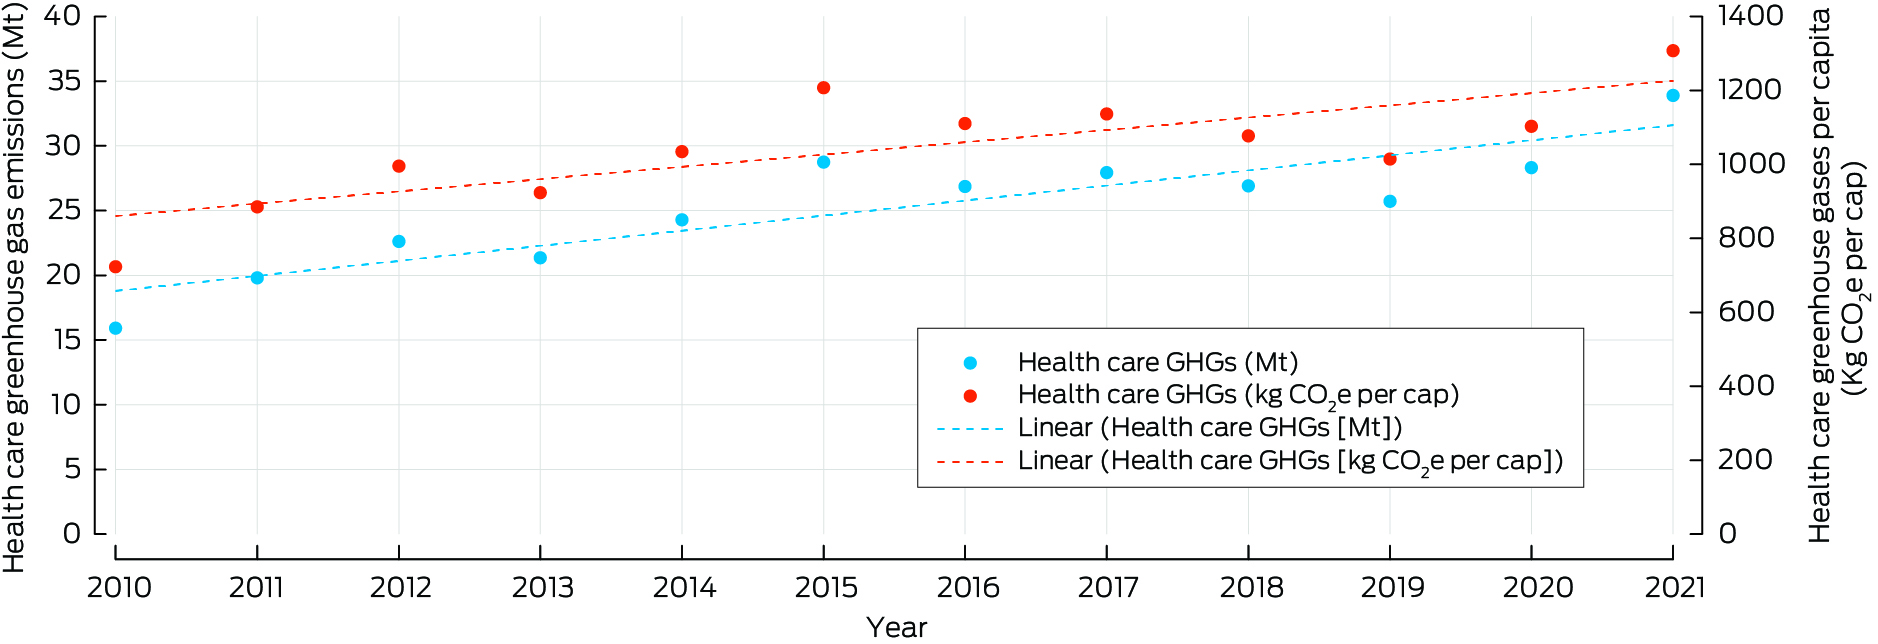
Kg CO2e per cap = kilograms of carbon dioxide equivalent per capita; Mt = megatonnes.
Box 14 – Digital health care for climate change mitigation and adaptation in Australia
- When designed sustainably, digital health technologies (DHTs) can support climate change mitigation, adaptation, and resilient health care systems.93,94 For example, telehealth mitigates greenhouse gases by reducing transport‐related emissions, fuel consumption, paper use, and personal protective equipment.95 Electronic prescribing and electronic referral services can eliminate up to 15 000 tonnes of carbon annually.96 The use of electronic medical records reduces redundant referrals and tests, follow‐up appointments, paper consumption, and waste.97,98,99
- In the context of adaptation and resilience, DHTs are instrumental in improving access to quality health services during extreme weather events. They also support responses to climate change events such as heatwaves, air pollution, floods, and bushfires. For example, the AirRater service provides smoke forecasts to communities vulnerable to bushfires and other sources of smoke pollution.100 The Melbourne Pollen Count application for mobile phones helps users manage asthma and allergies with real‐time data and provides risk alerts for thunderstorm asthma.101,102 HeatWatch, a web‐based resource, estimates individual heat risk based on personal data, including their health condition and planned activities.103 Virtual care models and wearable health monitors used in response to the coronavirus disease 2019 (COVID‐19) pandemic104 can be repurposed to improve access to health care in rural and remote areas during extreme weather events and disasters that might disrupt traditional in‐person services. My Health Records enable health professionals to access individual health information during disasters.105 Furthermore, the recent addition of climate and disaster‐related concepts in the multilingual SNOMED CT (Systematized Nomenclature of Medicine — Clinical Terms) clinical terminology permits real‐time data capture of the impact of climate‐driven disaster hazards on human health, facilitating more reliable epidemiological modelling.106 Predictive models for vector‐borne diseases such as Japanese encephalitis help understand their geographic spread and tracking and aid public health decision making.107
-
As DHTs aid in creating a climate‐resilient and sustainable health care system delivering climate‐conscious health care, there are several important considerations to address:
- ‣ DHTs generate greenhouse gases through their supporting infrastructure, such as computer networks and data storage and transfer. Mining rare minerals for DHT production and end‐of‐life disposal are environmental concerns.97 Energy‐intensive software interfaces, such as progress bars, animations, icons, images and scroll bars, add to this impact.108 Awareness of these factors may lead to implementing greener DHTs in health care settings.
- ‣ The digital divide must be addressed, as not everyone can access reliable, affordable internet or necessary digital literacy skills.109
- ‣ Ensure equitable access for those facing barriers to health care services, such as people with disabilities, homeless people, Aboriginal and Torres Strait Islander people, and members of culturally and linguistically diverse communities.110
- ‣ Digital health systems must be resilient to climate change and disaster impacts.111
- DHT systems that address these issues can effectively support climate change mitigation and adaptation, creating a resilient and sustainable health care system for the future.
Box 15 – Annual inflation‐adjusted total insured economic losses in Australia (base year 2019) from bushfires, cyclones, flooding, hailstorms, storm flooding, and tornadoes for the period 2000–2023*
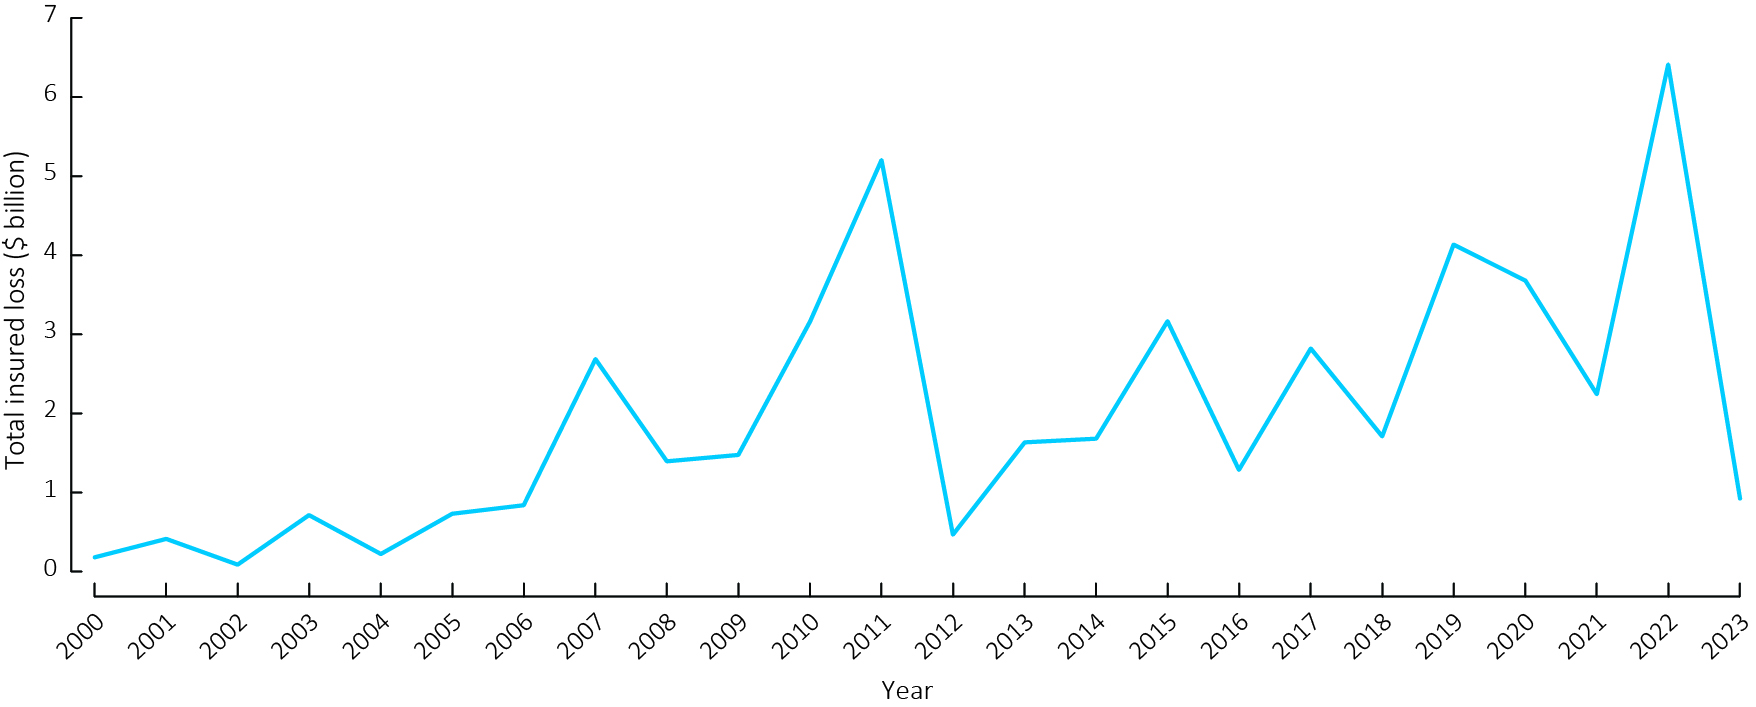
* Based on the Historical Catastrophe Data of the Insurance Council of Australia.113
Box 16 – New investment and capacity withdrawal in the Australian National Electricity Market for different fuel sources for the financial years 2013–2014 to 2022–2023
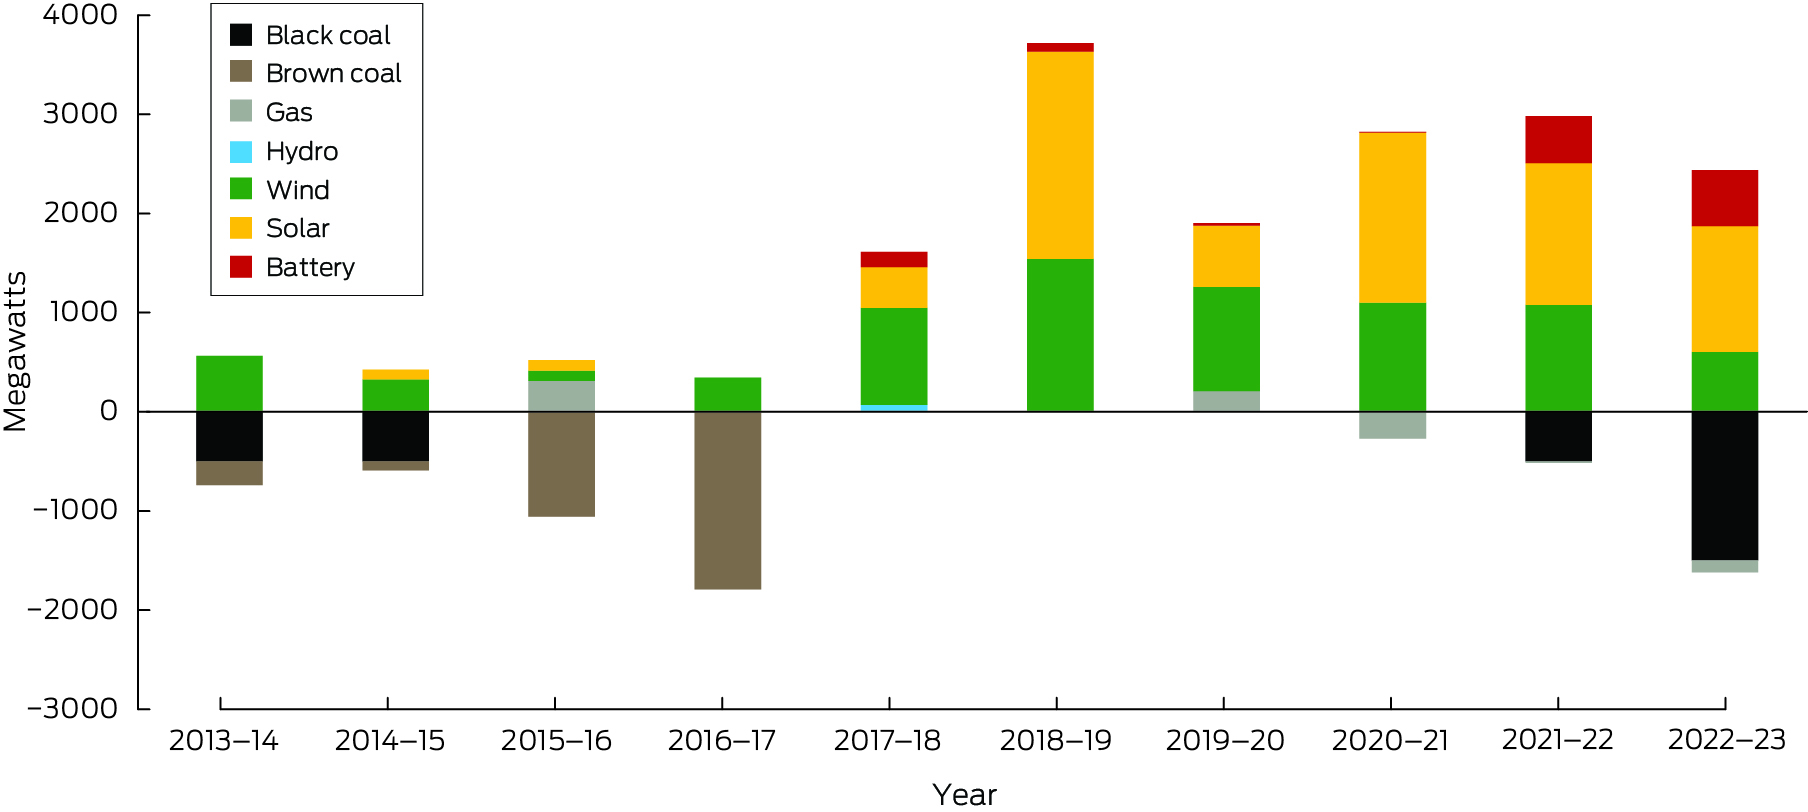
Data sources: Australian Energy Regulator (AER);114 Australian Energy Market Operator (AEMO).115
Box 17 – Annual number of media articles on health and climate change by covered regions in Australia, 2008–2023
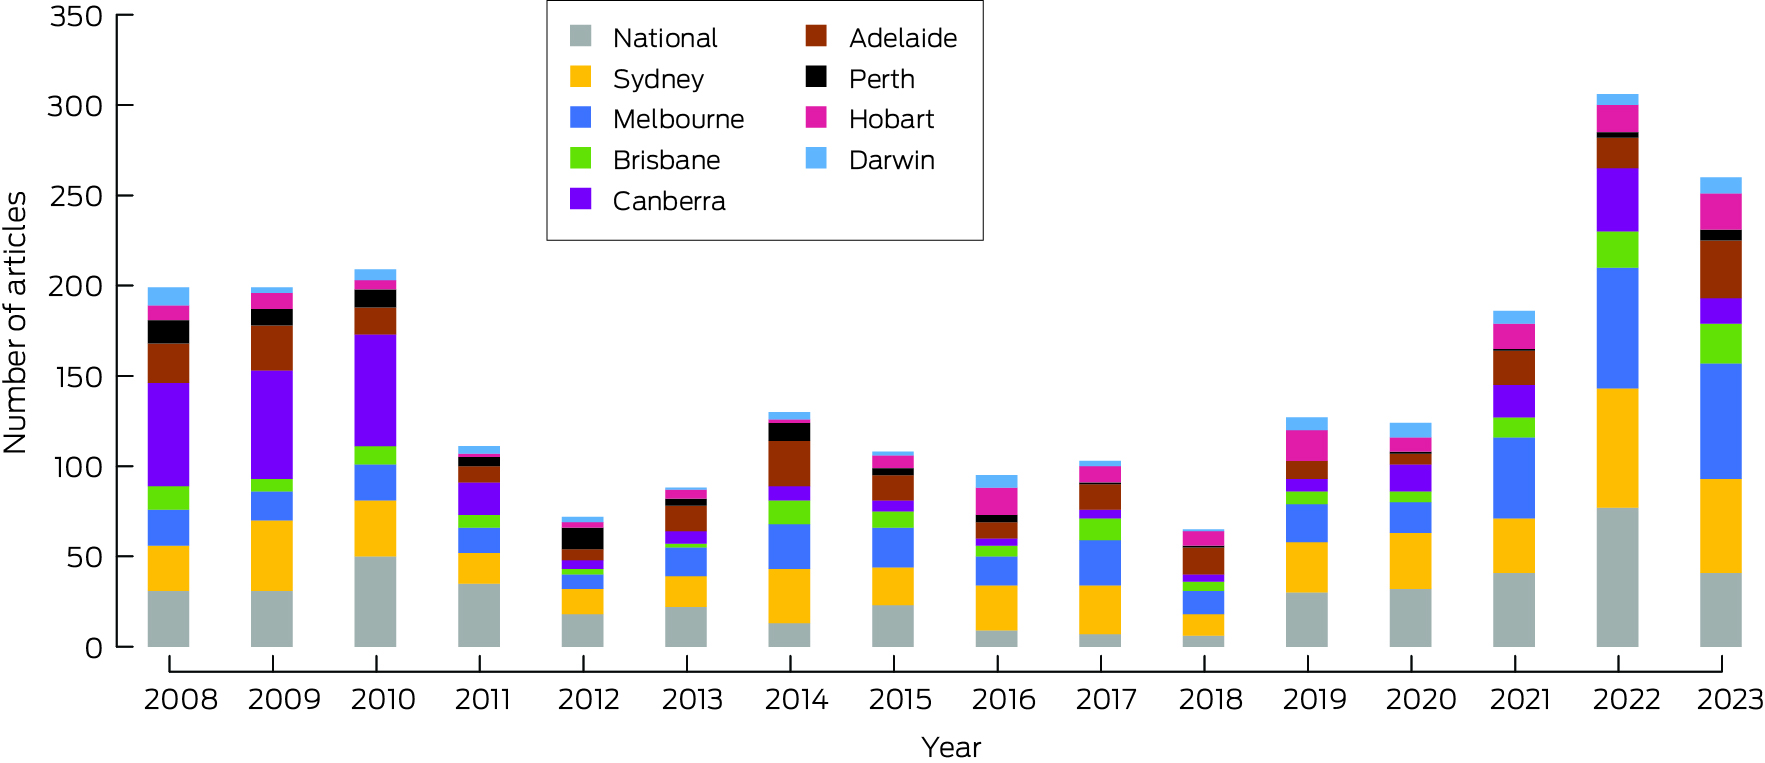
Data source: Factiva (https://about.proquest.com/en/products‐services/factiva).
Box 18 – Annual number of scientific publications on health and climate change in Australia and New Zealand, 2008–2023
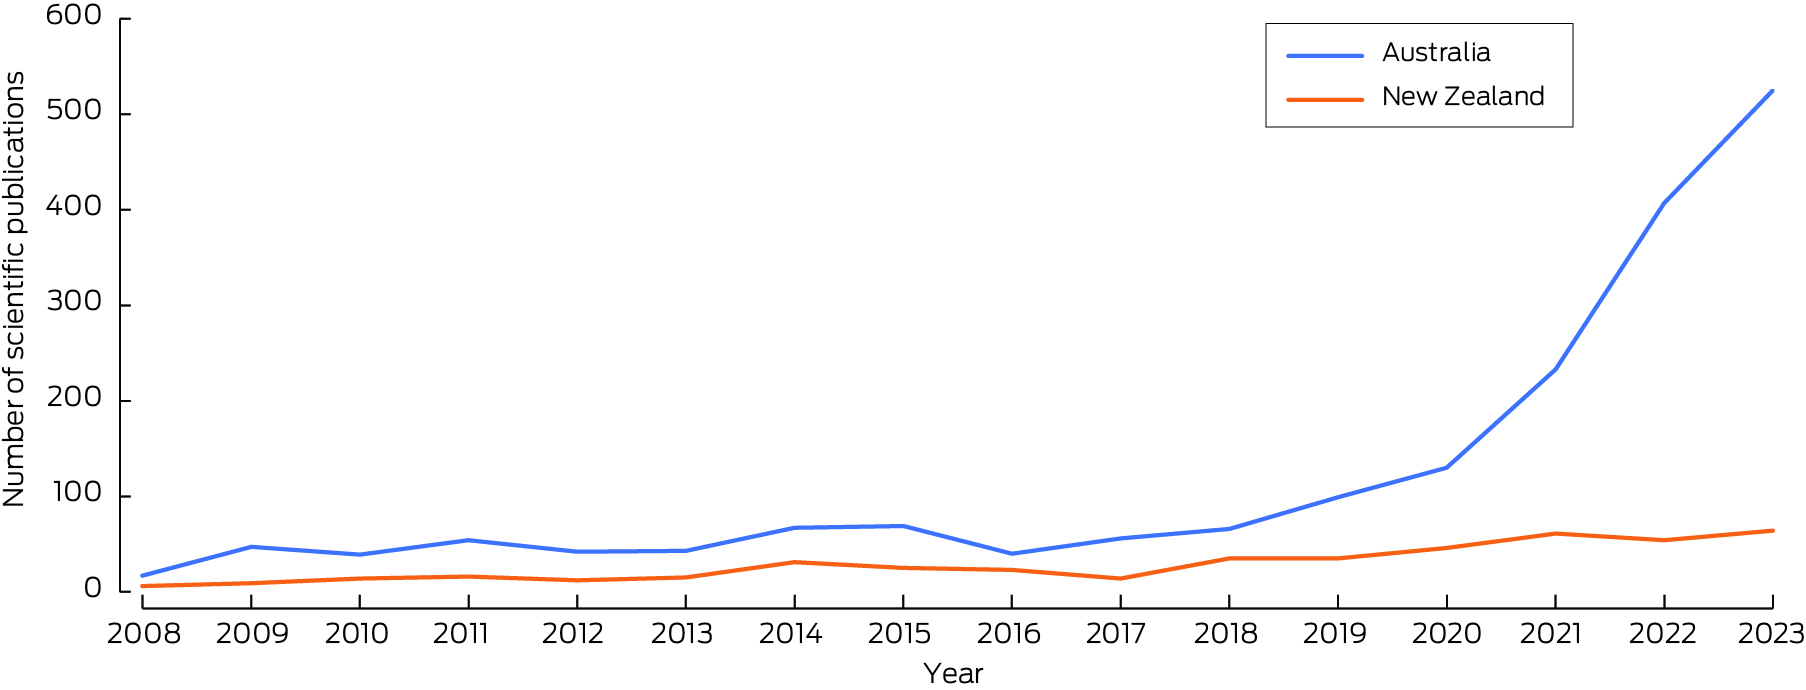
Data source: Scopus (https://www.scopus.com/home.uri).
Box 19 – Annual number of funded and not‐funded National Health and Medical Research Council (NHMRC) grant applications with a focus on health and climate change, and success rate, 2000–2023
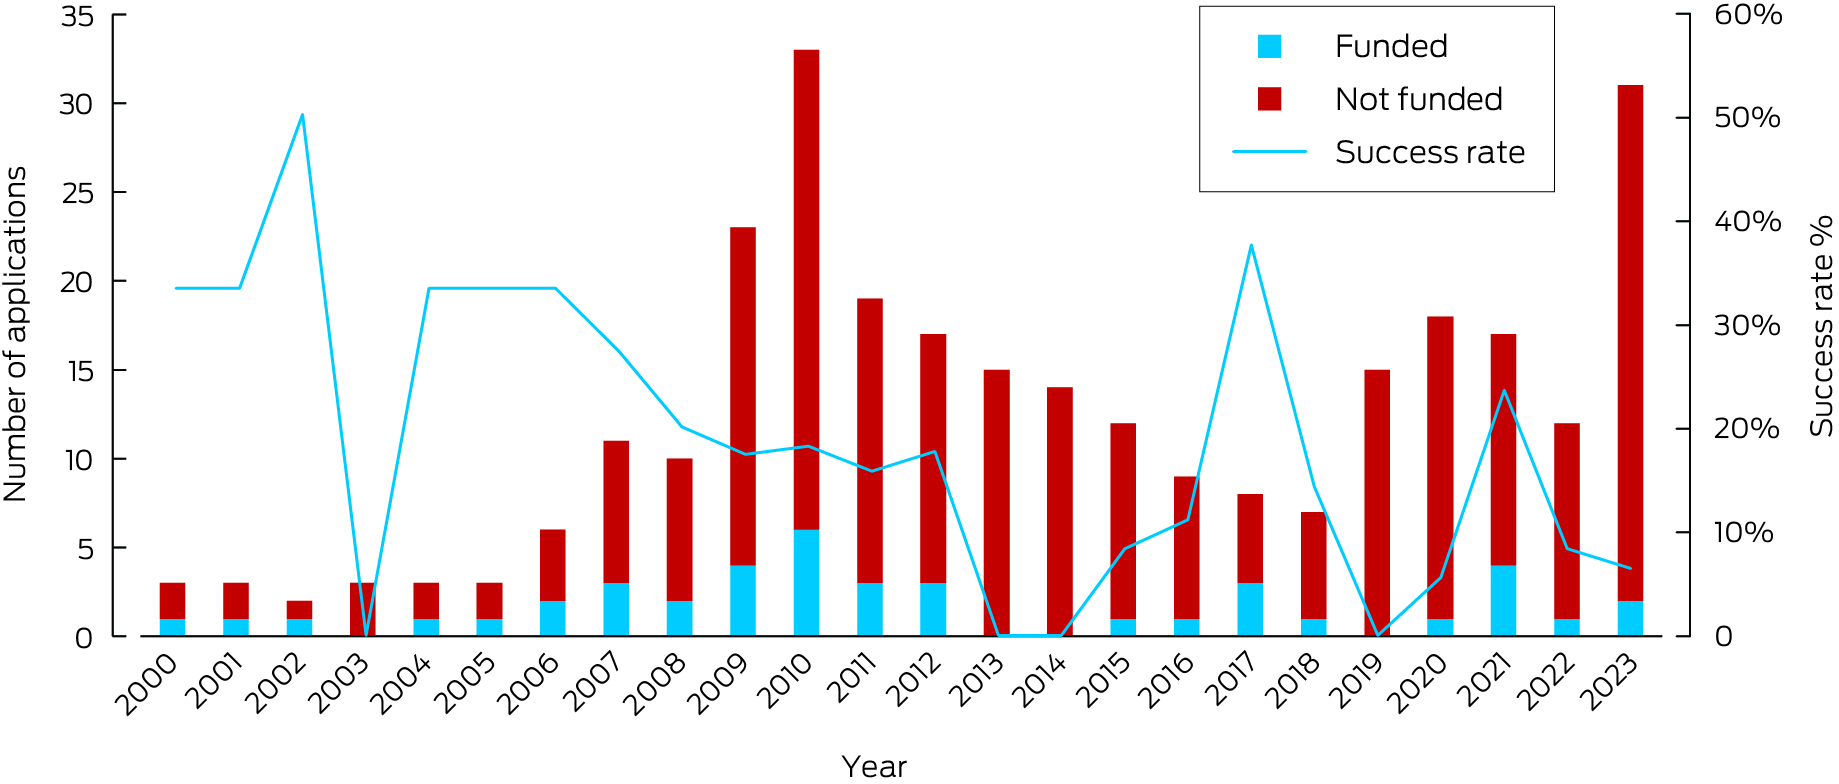
Data source: NHMRC.
Box 20 – Annual number of Australian climate cases decided by courts that have raised health‐related issues in the period 2014–2023*
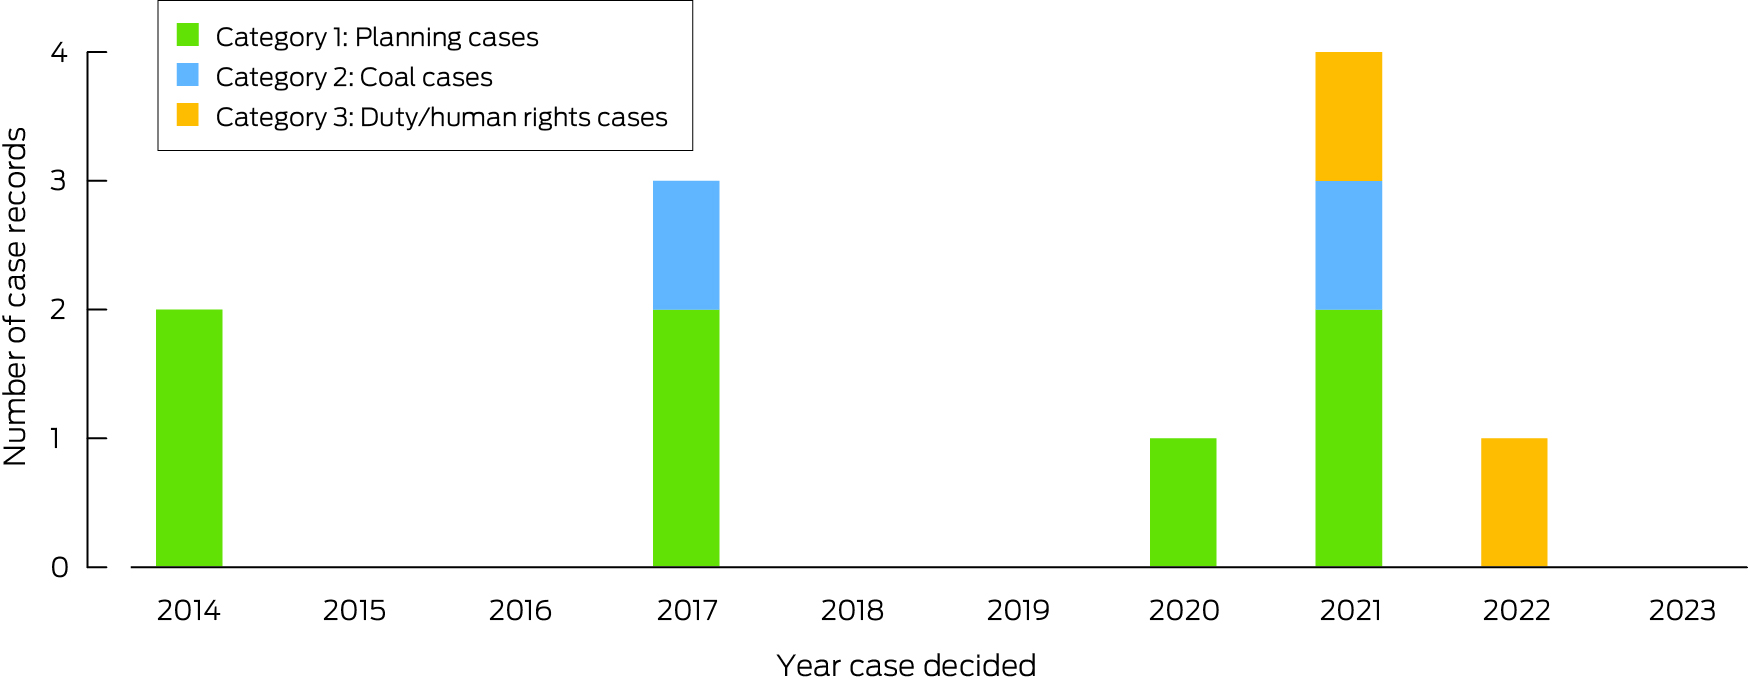
* Planning cases (category 1) involving development proposals were the first cases in which health and amenity risks associated with climate change were raised. Over time, health issues have also been raised in category 2 cases challenging coal projects, with a more recent trend to raise health issues as part of broader arguments concerning a duty of care on decision makers or obligations to observe human rights when assessing proposals for activities such as coal mines that will exacerbate climate change (category 3). Data source: Australian and Pacific Climate Change Litigation database (https://law.app.unimelb.edu.au/climate‐change/).
Box 21 – Annual greenhouse gas emissions from food production in New Zealand by commodity from 1995 to 2021
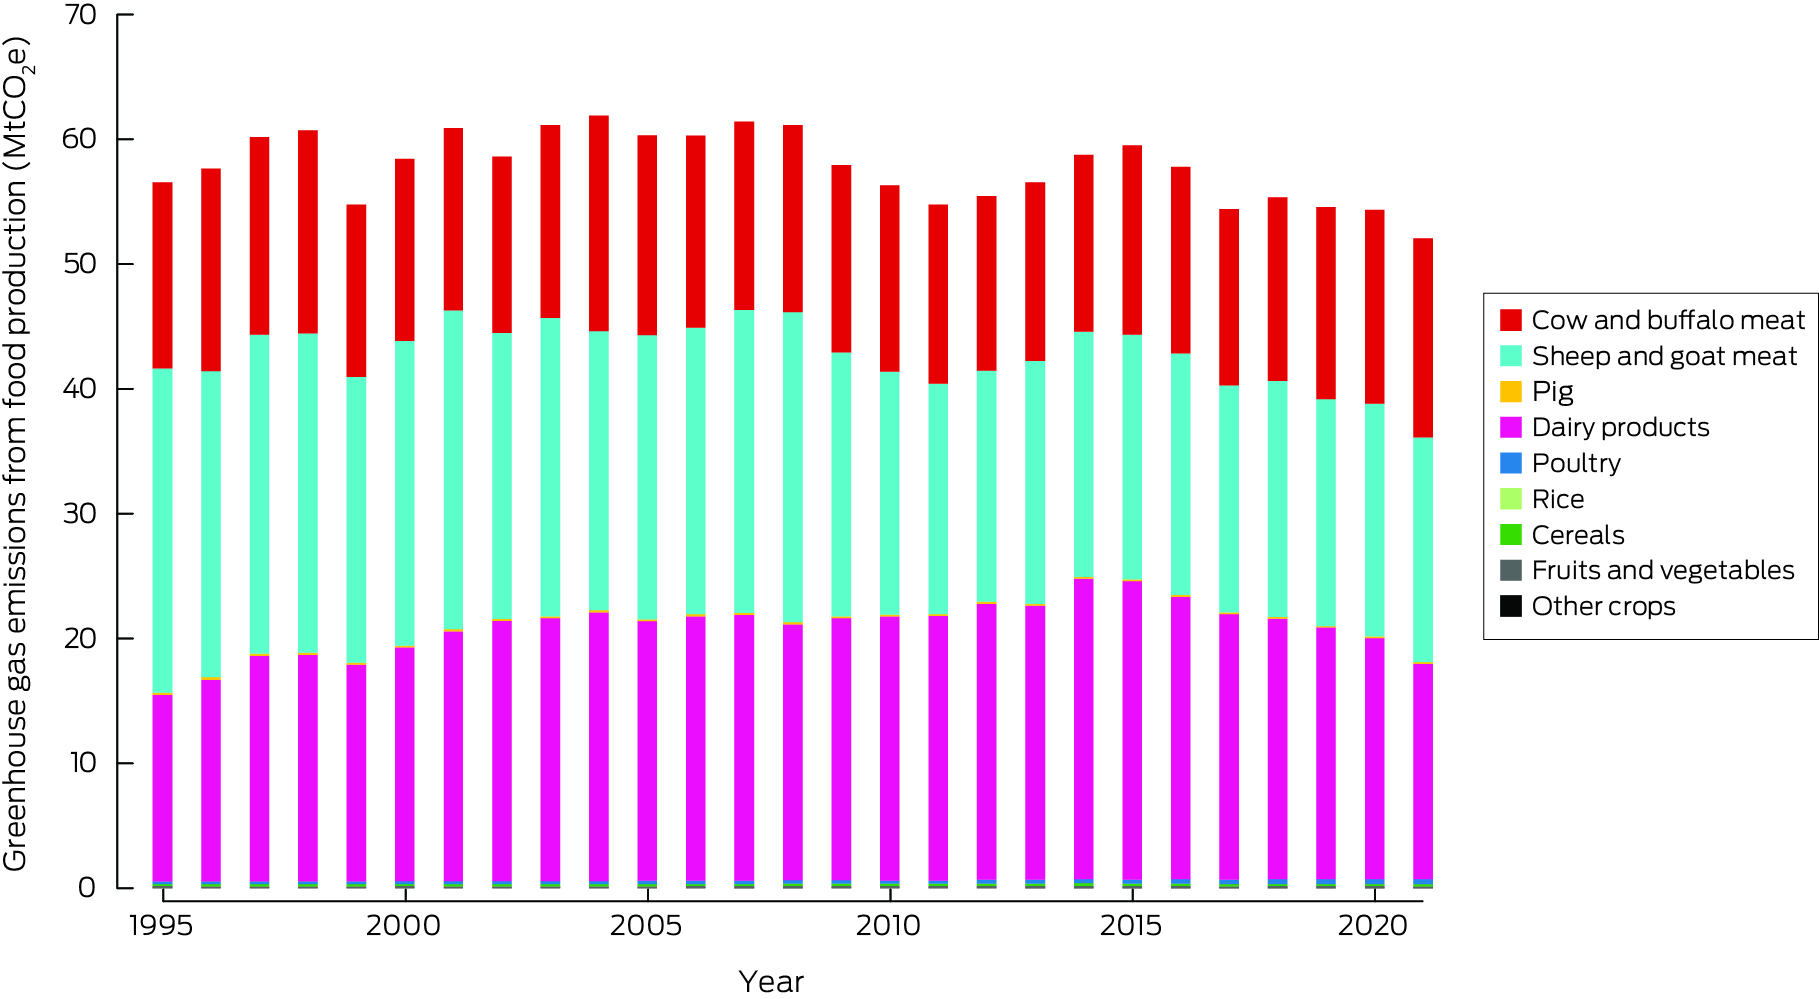
MtCO2e = megatonnes of carbon dioxide equivalent.
Box 22 – Annual displacement of people caused by weather‐related disaster in New Zealand, 2010–2023
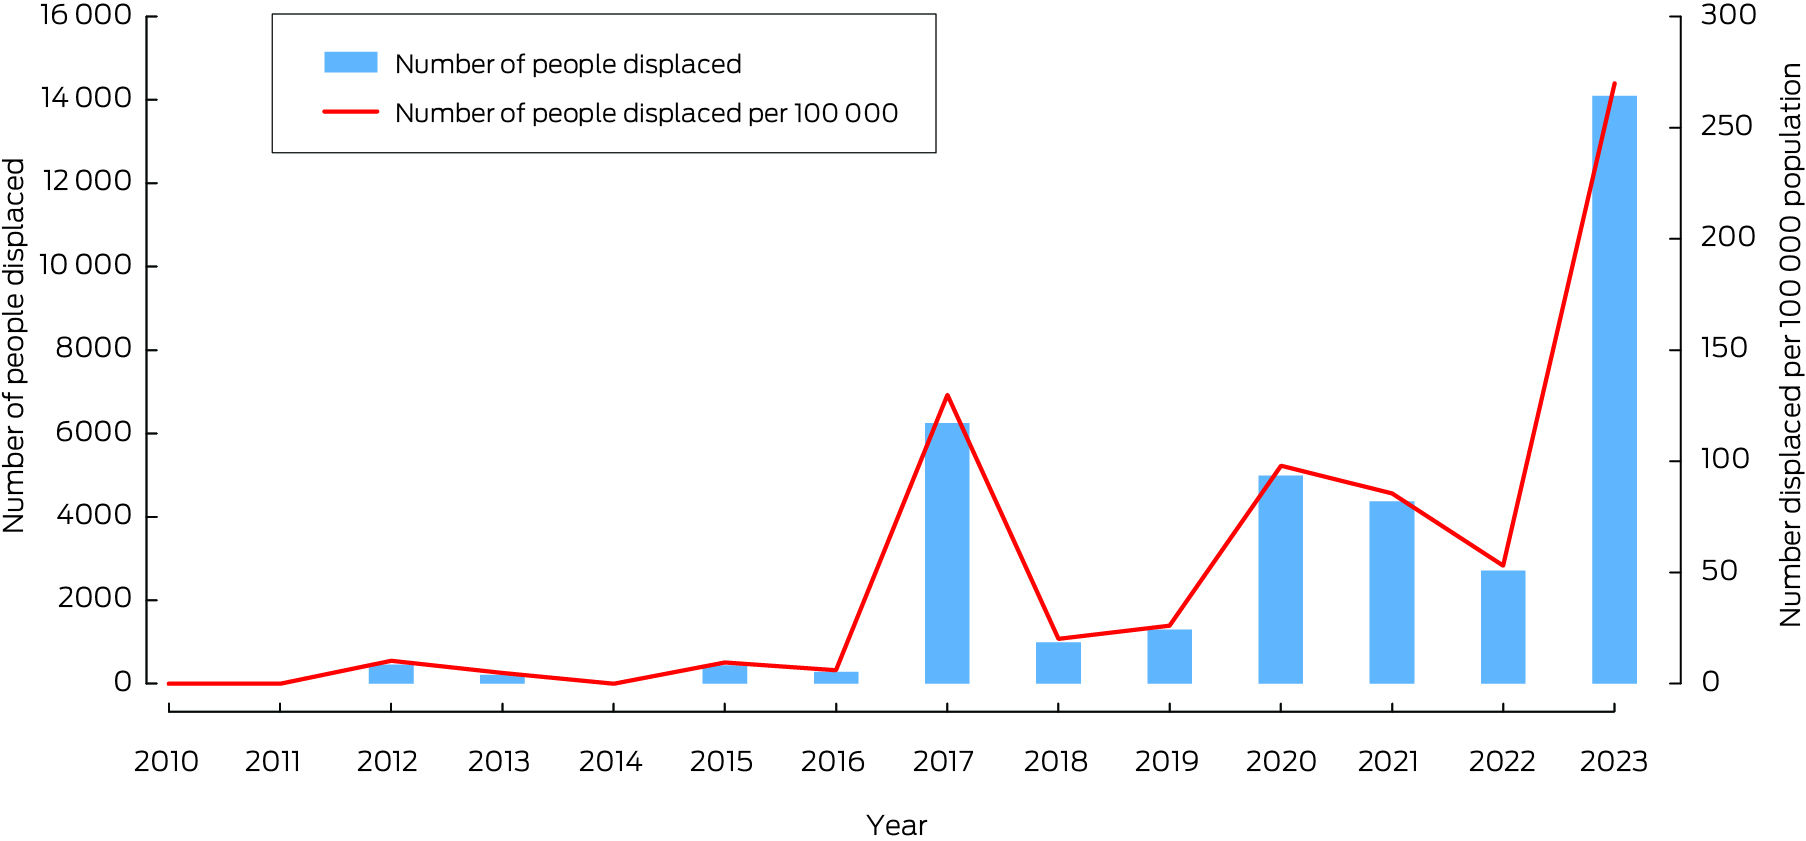
Data sources: Internal Displacement Monitoring Centre;61 World Bank.62
Box 23 – Annual inflation‐adjusted total insured economic losses in New Zealand from bushfires, cyclones, flooding, hailstorms, storm flooding and tornadoes for the period 2000 – 30 June 2023*
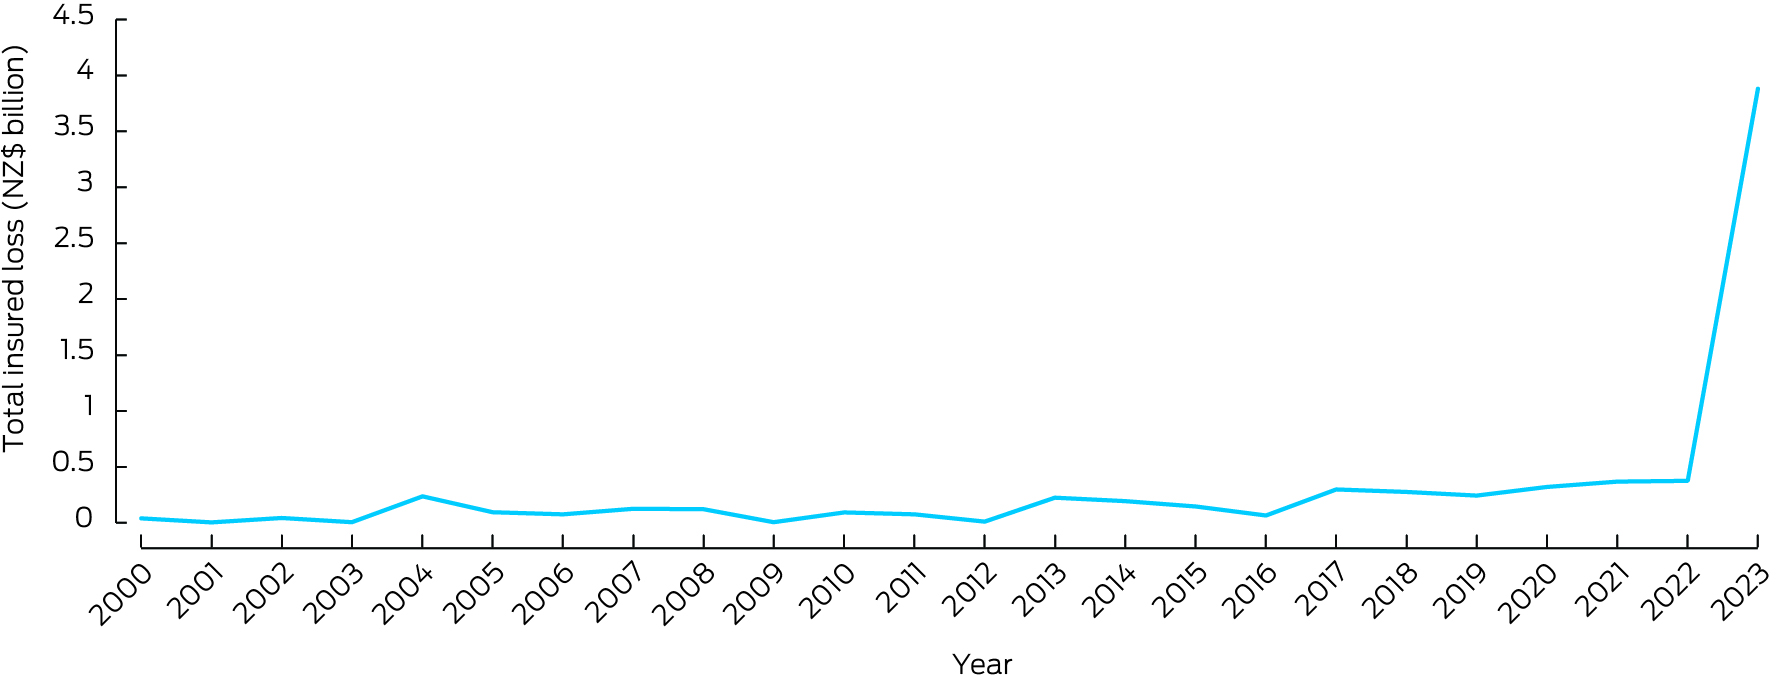
* Based on Insurance Council of New Zealand cost of natural disasters data.145
Box 24 – Key findings for Australia and New Zealand from the 2024 report of the MJA–Lancet Countdown on health and climate change*
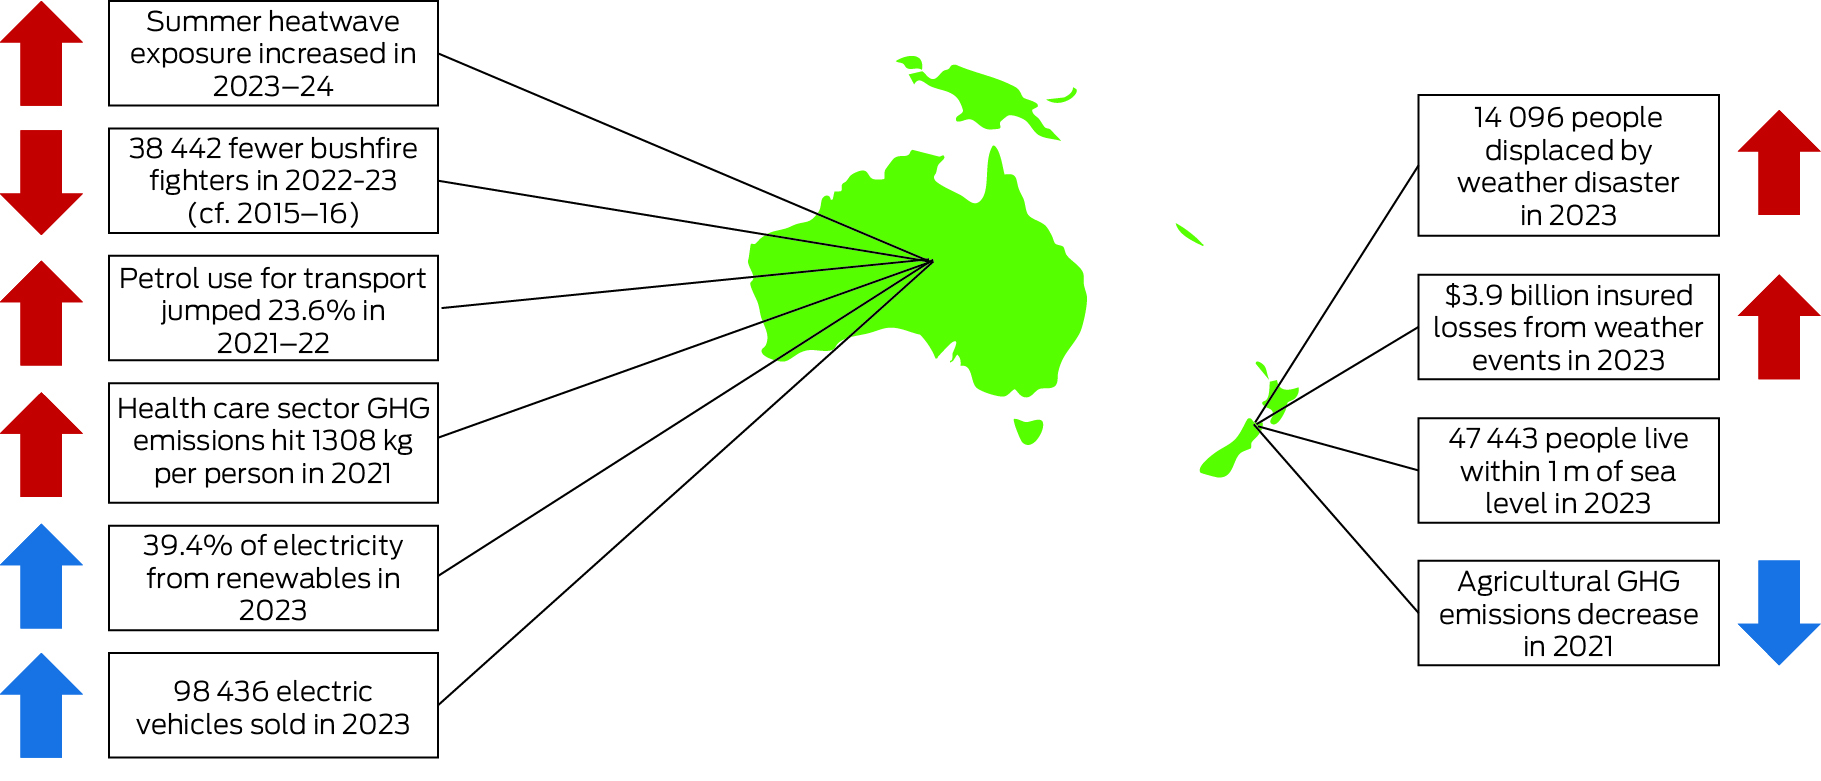
GHG = greenhouse gas. * Up and down arrows indicate the result is an increase or decrease compared with previous years. Red arrows denote the trend is contrary to that required to make progress on health and climate change, and blue arrows denote beneficial trends.
Provenance: Not commissioned; externally peer reviewed.
- Paul J Beggs1
- Alistair J Woodward2
- Stefan Trueck1
- Martina K Linnenluecke3
- Hilary Bambrick4
- Anthony G Capon5
- Zerina Lokmic‐Tomkins6
- Jacqueline Peel7
- Kathryn Bowen7
- Ivan C Hanigan8
- Nicolas Borchers Arriagada9
- Troy J Cross10
- Sharon Friel11
- Donna Green12
- Maddie Heenan13
- Ollie Jay10
- Harry Kennard14,15
- Arunima Malik10
- Celia McMichael7
- Mark Stevenson7
- Sotiris Vardoulakis16
- Aditya Vyas16
- Marina B Romanello17
- Maria Walawender17
- Ying Zhang10
- 1 Macquarie University, Sydney, NSW
- 2 University of Auckland, Auckland, New Zealand
- 3 University of Technology Sydney, Sydney, NSW
- 4 National Centre for Epidemiology and Population Health, Australian National University, Canberra, ACT
- 5 Monash Sustainable Development Institute, Monash University, Melbourne, VIC
- 6 Monash University, Melbourne, VIC
- 7 University of Melbourne, Melbourne, VIC
- 8 Curtin University, Perth, WA
- 9 Menzies Institute for Medical Research, University of Tasmania, Hobart, TAS
- 10 University of Sydney, Sydney, NSW
- 11 Australian National University, Canberra, ACT
- 12 Climate Change Research Centre and ARC Centre of Excellence for Climate Extremes, University of New South Wales, Sydney, NSW
- 13 George Institute for Global Health, Sydney, NSW
- 14 Center on Global Energy Policy, Columbia University, New York, United States
- 15 University of Texas at Austin, Austin, United States
- 16 Health Research Institute, University of Canberra, Canberra, ACT
- 17 University College London, London, United Kingdom
Open access:
Open access publishing facilitated by Macquarie University, as part of the Wiley ‐ Macquarie University agreement via the Council of Australian University Librarians.
We thank Robert Fawcett and Justin Peter (both from the Australian Bureau of Meteorology) and John Nairn (the University of Adelaide) for their contribution to indicator 1.1 Exposure of vulnerable populations to heatwaves. We thank Fay Johnston for her contribution to indicator 1.3 Bushfires. Indicator 2.1, Health adaptation plans and assessments, is produced with support from HEAL (Healthy Environments And Lives) National Research Network, which receives funding from the National Health and Medical Research Council (NHMRC) Special Initiative in Human Health and Environmental Change (Grant No. 2008937). For indicator 3.3 Exposure to particulate matter air pollution in cities, our access to air pollution, spatial data and population census data was supported by the Clean Air Research Data and Analysis Technology (CARDAT) platform funded by the NHMRC Centre for Safe Air and the Curtin University WHO Collaborating Centre for Climate Change and Health Impact Assessment (https://cardat.github.io). CARDAT also received funding from the Australian Research Data Commons (ARDC) for the National Air Pollution Monitor Database under the Integrated National Air Pollution and Health Data project (https://doi.org/10.47486/PS022). We thank Carole Dalin (University College London) for assistance with indicator 3.5 Emissions from agricultural production and consumption. We thank NHMRC for providing the data for indicator 5.3 Health and climate change research funding. We thank the Lancet Countdown for providing the results for indicators: 1.3 Bushfires, 2.3 Migration and displacement (population exposure to sea level rise data), 3.1 Energy systems and health, 3.6 Diet and health co‐benefits, and 3.7 Health care sector emissions.
No relevant disclosures.
- 1. World Meteorological Organization. State of the global climate 2023 [WMO No. 1347]. Geneva: WMO, 2024. https://library.wmo.int/idurl/4/68835 (viewed Dec 2024).
- 2. World Meteorological Organization. Record‐breaking temperatures continue in August [news release]. 13 September 2024. https://wmo.int/media/news/record‐breaking‐temperatures‐continue‐august (viewed Sept 2024).
- 3. Kemp L, Xu C, Depledge J, et al. Climate Endgame: exploring catastrophic climate change scenarios. Proc Natl Acad Sci U S A 2022; 119: e2108146119.
- 4. World Health Organization. Draft fourteenth general programme of work, 2025–2028; report by the Director‐General. Seventy‐Seventh World Health Assembly: provisional agenda item 17 [A77/16]. 3 May 2024. https://apps.who.int/gb/ebwha/pdf_files/WHA77/A77_16‐en.pdf (viewed Dec 2024).
- 5. COP28. COP28 UAE Declaration on Climate and Health, 2023. https://who.int/publications/m/item/cop28‐uae‐declaration‐on‐climate‐and‐health (viewed Jan 2025).
- 6. Vyas A, Wyns A, Beggs PJ, Zhang Y. Health at the centre of climate change negotiations: critical achievements from the COP28 Health Programme. Environ Res Lett 2024; 19: 081003.
- 7. Carlson CJ. After millions of preventable deaths, climate change must be treated like a health emergency. Nat Med 2024; 30: 622.
- 8. European Court of Human Rights. Grand Chamber rulings in the climate change cases. https://www.echr.coe.int/w/grand‐chamber‐rulings‐in‐the‐climate‐change‐cases (viewed Sept 2024).
- 9. Minnerop P, Haines A. KlimaSeniorinnen v Switzerland: the European Court of Human Rights leads the way on climate action. BMJ 2024; 387: q2156.
- 10. Lancet Countdown. Lancet Countdown: health and climate change in Oceania. https://lancetcountdown.org/oceania/ (viewed Sept 2024).
- 11. Beggs PJ, Zhang Y, Bambrick H, et al. The 2019 report of the MJA–Lancet Countdown on health and climate change: a turbulent year with mixed progress. Med J Aust 2019; 211: 490–491.e21. https://www.mja.com.au/journal/2019/211/11/2019‐report‐mja‐lancet‐countdown‐health‐and‐climate‐change‐turbulent‐year‐mixed
- 12. Beggs PJ, Zhang Y, McGushin A, et al. The 2021 report of the MJA–Lancet Countdown on health and climate change: Australia increasingly out on a limb. Med J Aust 2021; 215: 390‐392.e22. https://www.mja.com.au/journal/2021/215/9/2021‐report‐mja‐lancet‐countdown‐health‐and‐climate‐change‐australia
- 13. Beggs PJ, Zhang Y, McGushin A, et al. The 2022 report of the MJA–Lancet Countdown on health and climate change: Australia unprepared and paying the price. Med J Aust 2022; 217: 439‐458. https://www.mja.com.au/journal/2022/217/9/2022‐report‐mja‐lancet‐countdown‐health‐and‐climate‐change‐australia‐unprepared
- 14. Beggs PJ, Trueck S, Linnenluecke MK, et al. The 2023 report of the MJA–Lancet Countdown on health and climate change: sustainability needed in Australia's health care sector. Med J Aust 2024; 220: 282‐303. https://www.mja.com.au/journal/2024/220/6/2023‐report‐mja‐lancet‐countdown‐health‐and‐climate‐change‐sustainability‐needed
- 15. Zhang Y, Beggs PJ, Bambrick H, et al. The MJA–Lancet Countdown on health and climate change: Australian policy inaction threatens lives. Med J Aust 2018; 209: 474‐474.e21. https://www.mja.com.au/journal/2018/209/11/mja‐lancet‐countdown‐health‐and‐climate‐change‐australian‐policy‐inaction
- 16. Zhang Y, Beggs PJ, McGushin A, et al. The 2020 special report of the MJA–Lancet Countdown on health and climate change: lessons learnt from Australia's “Black Summer”. Med J Aust 2020; 213: 492‐492.e10. https://www.mja.com.au/journal/2020/213/11/2020‐special‐report‐mja‐lancet‐countdown‐health‐and‐climate‐change‐lessons
- 17. Talley NJ. Welcoming the new MJA Editor‐in‐Chief, and the top ten original research articles in the MJA in 2022. Med J Aust 2023; 218: 22‐24. https://www.mja.com.au/journal/2023/218/1/welcoming‐new‐mja‐editor‐chief‐and‐top‐ten‐original‐research‐articles‐mja‐2022
- 18. Zuccala E, Barbour V; on behalf of the MJA editorial team. Reflecting on what makes a medical journal in 2023: local, regional and planetary connections. Med J Aust 2023; 219: 507‐510. https://www.mja.com.au/journal/2023/219/11/reflecting‐what‐makes‐medical‐journal‐2023‐local‐regional‐and‐planetary
- 19. Romanello M, Walawender M, Hsu S‐C, et al. The 2024 report of the Lancet Countdown on health and climate change: facing record‐breaking threats from delayed action. Lancet 2024; 404: 1847‐1896.
- 20. Boocock J, McDonald J, McCormack PC. Public health: a forgotten piece of the adaptation law puzzle. Front Clim 2024; 6: 1355793.
- 21. Burger M, Gundlach J; editors. Climate change, public health, and the law. Cambridge, UK: Cambridge University Press, 2018.
- 22. Toolan N, Marcus H, Hanna EG, Wannous C. Legal implications of the climate‐health crisis: a case study analysis of the role of public health in climate litigation. PLoS One 2022; 17: e0268633.
- 23. Romanello M, di Napoli C, Green C, et al. The 2023 report of the Lancet Countdown on health and climate change: the imperative for a health‐centred response in a world facing irreversible harms. Lancet 2023; 402: 2346‐2394.
- 24. Thomson TN, Szanyi J, Mulvenna V. Heat health alerts and emergency department presentations by people aged 65 years or older, Victoria, 2010–22: a case–crossover analysis. Med J Aust 2024; 221: 117‐118. https://www.mja.com.au/journal/2024/221/2/heat‐health‐alerts‐and‐emergency‐department‐presentations‐people‐aged‐65‐years
- 25. Nairn J, Fawcett R. Defining heatwaves: heatwave defined as a heat‐impact event servicing all community and business sectors in Australia [CAWCR Technical Report No. 060]. CSIRO and Australian Government Bureau of Meteorology, 2013. https://www.cawcr.gov.au/technical‐reports/CTR_060.pdf (viewed Sept 2024).
- 26. Nairn JR, Fawcett RJB. The excess heat factor: a metric for heatwave intensity and its use in classifying heatwave severity. Int J Environ Res Public Health 2015; 12: 227‐253.
- 27. Vecellio DJ, Cottle RM, Wolf ST, Kenney WL. Critical environmental limits for human thermoregulation in the context of a changing climate. Exerc Sport Mov 2023; 1: e00008.
- 28. Jay O, Broderick C, Smallcombe J. Extreme heat policy. Melbourne: Sports Medicine Australia, 2021. https://sma.org.au/wp‐content/uploads/2023/03/SMA‐Extreme‐Heat‐Policy‐2021‐Final.pdf (viewed Sept 2024).
- 29. Johnston FH, Williamson G, Borchers‐Arriagada N, et al. Climate change, landscape fires, and human health: a global perspective. Annu Rev Public Health 2024; 45: 295‐314.
- 30. Vicente‐Serrano SM, Beguería S, López‐Moreno JI. A multiscalar drought index sensitive to global warming: the standardized precipitation evapotranspiration index. J Clim 2010; 23: 1696‐1718.
- 31. Watts N, Amann M, Arnell N, et al. The 2020 report of the Lancet Countdown on health and climate change: responding to converging crises. Lancet 2021; 397: 129‐170.
- 32. Bureau of Meteorology. Australia's climate in 2023. Melbourne: Commonwealth of Australia, 2024. http://www.bom.gov.au/climate/current/annual/aus/2023/ (viewed Sept 2024).
- 33. Shepherd B. Record‐breaking Perth dry spell may have lasting impact on WA's water supply, experts warn. ABC News 2024, 1 Apr. https://www.abc.net.au/news/2024‐04‐01/impact‐of‐perth‐dry‐spell‐on‐wa‐water‐supply‐explained/103646216 (viewed Sept 2024).
- 34. Bowen KJ, Ebi K, Friel S, McMichael AJ. A multi‐layered governance framework for incorporating social science insights into adapting to the health impacts of climate change. Glob Health Action 2013; 6: 21820.
- 35. Butler JRA, Wise RM, Skewes TD, et al. Integrating top‐down and bottom‐up adaptation planning to build adaptive capacity: a structured learning approach. Coast Manage 2015; 43: 346‐364.
- 36. International Council of Nurses. Position statement: nurses, climate change and health. Geneva: ICN, 2018. https://www.icn.ch/sites/default/files/inline‐files/ICN‐PS‐Nurses%252c‐climate‐change‐and‐health‐FINAL‐.pdf (viewed Sept 2024).
- 37. Lokmic‐Tomkins Z, Nayna Schwerdtle P, Armstrong F. Engaging with our responsibility to protect health from climate change. J Adv Nurs 2023; 79: e41‐e44.
- 38. Lokmic‐Tomkins Z, Strus JA, Kaminski J, Davies S. “You cannot be what you cannot see”: we need visible nursing role models shaping a healthier planetary future for all. Contemp Nurse 2023; 59: 185‐188.
- 39. Best O, Tutticci N, Heart D, et al. Rising to the climate challenge: integrating climate action in the undergraduate curriculum. Aust J Adv Nurs 2023; 40: 2023.403.1266.
- 40. Australian College of Nursing. The nursing response to the climate emergency: a white paper by ACN 2023. Canberra: ACN, 2023. https://www.acn.edu.au/wp‐content/uploads/white‐paper‐the‐nursing‐response‐to‐the‐climate‐emergency.pdf (viewed Sept 2024).
- 41. International Council of Nurses. The ICN Code of Ethics for Nurses. Geneva: ICN, 2021. https://www.icn.ch/sites/default/files/2023‐06/ICN_Code‐of‐Ethics_EN_Web.pdf (viewed Sept 2024).
- 42. Bonnamy J, Levett‐Jones T, Carr B, et al. Australian and New Zealand nursing and midwifery educators’ planetary health knowledge, views, confidence and teaching practices: a descriptive survey study. J Adv Nurs 2024; https://doi.org/10.1111/jan.16317.
- 43. Planetary Health Collaborative. Planetary Health Collaborative for Nurses and Midwives: Research and Education Collaborative, 2024. https://planetaryhealthcare.com.au/ (viewed Sept 2024).
- 44. Levett‐Jones T, Catling C, Cheer S, et al. Achieving consensus on the essential knowledge and skills needed by nursing students to promote planetary health and sustainable healthcare: a Delphi study. J Adv Nurs 2024; https://doi.org/10.1111/jan.16229.
- 45. Levett‐Jones T, Bonnamy J, Cornish J, et al. Celebrating Australian nurses who are pioneering the response to climate change: a compilation of case studies. Contemp Nurse 2024; 60: 234‐246.
- 46. Levett‐Jones T, Bonnamy J, Fields L, et al. Promoting sustainability in nursing and midwifery clinical laboratories: strategies for resource reduction, reuse, and recycling. Nurse Educ Today 2024; 134: 106105.
- 47. Climate Action Nurses. Climate Action Nurses, 2024. https://www.climateactionnurses.org/ (viewed Sept 2024).
- 48. Australian Nursing and Midwifery Federation Victorian Branch. Health and environmental sustainability. Melbourne: ANMF, 2024. https://www.anmfvic.asn.au/healthenvironmentalsustainability (viewed Sept 2024).
- 49. Mohamed J. Janine Mohamed: reflections on the COP28 climate conference in Dubai. Atlantic Fellows 2024, 1 Mar. https://www.atlanticfellows.org/post/janine‐mohamed‐reflections‐on‐the‐cop28‐climate‐conference‐in‐dubai (viewed Sept 2024).
- 50. Matthews V, Atkinson A‐R, Lee G, et al. for the HEAL Network and CRE‐STRIDE. Climate change and Aboriginal and Torres Strait Islander health: discussion paper. Prepared for the Lowitja Institute and the National Health Leadership Forum by Healthy Environments and Lives (HEAL) Network and Centre for Research Excellence in Strengthening Systems for Indigenous Health Care Equity (CRE‐STRIDE). Melbourne: Lowitja Institute, 2021. https://www.lowitja.org.au/wp‐content/uploads/2023/06/Lowitja_ClimateChangeHealth_1021_D10‐1.pdf (viewed Sept 2024).
- 51. Australian Government, Department of Health and Aged Care. National Health and Climate Strategy. Canberra: Commonwealth of Australia, 2023. https://www.health.gov.au/sites/default/files/2023‐12/national‐health‐and‐climate‐strategy.pdf (viewed Sept 2024).
- 52. Australian Government, Department of Climate Change, Energy, the Environment and Water. National Adaptation Plan: Issues paper. Canberra: Commonwealth of Australia, 2024. https://storage.googleapis.com/files‐au‐climate/climate‐au/p/prj2bf366cf9d0b4cc962561/page/National%20Adaptation%20Plan%20Issues%20Paper%20March%202024.pdf (viewed Sept 2024).
- 53. Northern Territory Government, NT Health. Sustainability and Climate Adaptation Strategy: 2024–2030. Darwin: NT Health, 2024. https://health.nt.gov.au/__data/assets/pdf_file/0006/1468311/nt‐health‐sustainability‐climate‐adaptation‐strategy2024‐2030.PDF (viewed Dec 2024).
- 54. Western Australia Government, Department of Water and Environmental Regulation. Climate Adaptation Strategy: building WA's climate resilient future. Perth: Western Australia Government, 2023. https://www.wa.gov.au/system/files/2023‐07/climate_adaption_strategy_220623.pdf (viewed Sept 2024).
- 55. Xu R, Yu P, Liu Y, et al. Climate change, environmental extremes, and human health in Australia: challenges, adaptation strategies, and policy gaps. Lancet Reg Health West Pac 2023; 40: 100936.
- 56. World Health Organization. International Health Regulations (2005), 3rd ed [as amended in 2014 and 2022]. Geneva: WHO, 2024. https://apps.who.int/gb/bd/pdf_files/IHR_2022‐en.pdf (viewed Jan 2025).
- 57. World Health Organization. International Health Regulations (2005): guidance document for the state party self‐assessment annual reporting tool. WHO/WHE/CPI/2018.17. Geneva: WHO, 2018. https://iris.who.int/bitstream/handle/10665/272438/WHO‐WHE‐CPI‐2018.17‐eng.pdf?sequence=1 (viewed Feb 2025).
- 58. World Health Organization. IHR capacity progress. https://extranet.who.int/e‐spar/Home/Capacity (viewed Sept 2024).
- 59. McMichael C. Climatic and environmental change, migration, and health. Annu Rev Public Health 2023; 44: 171‐191.
- 60. Dedekorkut‐Howes A, Torabi E, Howes M. When the tide gets high: a review of adaptive responses to sea level rise and coastal flooding. J Environ Plan Manag 2020; 63: 2102‐2143.
- 61. Internal Displacement Monitoring Centre. Country profile Australia: displacement data. Geneva: IDMC, 2024. https://www.internal‐displacement.org/countries/australia (viewed Aug 2024).
- 62. World Bank. Population, total — Australia. NW Washington, DC: The World Bank, 2024. https://data.worldbank.org/indicator/SP.POP.TOTL?end=2023&locations=AU&start=2008 (viewed Aug 2024).
- 63. Clarke B, Otto F, Stuart‐Smith R, Harrington L. Extreme weather impacts of climate change: an attribution perspective. Environ Res Climate 2022; 1: 012001.
- 64. Australian Government, Productivity Commission. Report on Government Services 2024. Part D, Section 9 [released on 29 Jan 2024]. 9 Emergency services for fire and other events. https://www.pc.gov.au/ongoing/report‐on‐government‐services/2024/emergency‐management/emergency‐services (viewed Sept 2024).
- 65. New South Wales Government, Rural Fire Service. About us. https://www.rfs.nsw.gov.au/about‐us (viewed Dec 2024).
- 66. Australian Government, Department of Climate Change, Energy, the Environment and Water. National Climate Risk Assessment: first pass assessment report. Canberra: Commonwealth of Australia, 2024. https://www.dcceew.gov.au/sites/default/files/documents/national‐climate‐risk‐assessment‐first‐pass‐assessment‐report‐2024.pdf (viewed Feb 2025).
- 67. International Energy Agency. Greenhouse gas emissions from energy data explorer. Paris: IEA, 2024. https://www.iea.org/data‐and‐statistics/data‐tools/greenhouse‐gas‐emissions‐from‐energy‐data‐explorer (viewed Sept 2024).
- 68. Australian Government Department of Climate Change, Energy, the Environment and Water. Australian Energy Statistics, Table O1.2: Australian electricity generation, by fuel type, physical units, calendar year; March 2024. https://www.energy.gov.au/sites/default/files/2024‐08/australian_energy_statistics_2024_table_o.xlsx (viewed Dec 2024).
- 69. International Energy Agency. World Energy Statistics and Balances. Paris: IEA, 2024. https://www.iea.org/data‐and‐statistics/data‐product/world‐energy‐statistics‐and‐balances (viewed Feb 2025).
- 70. Friel S, Trebeck K, Frank N, et al. Priorities for planetary health equity in Australia. Med J Aust 2024; 221: 236‐238. https://www.mja.com.au/journal/2024/221/5/priorities‐planetary‐health‐equity‐australia
- 71. International Energy Agency. Australia 2023: Energy policy review. Paris: IEA, 2024. https://iea.blob.core.windows.net/assets/02a7a120‐564b‐4057‐ac6d‐cf21587a30d9/Australia2023EnergyPolicyReview.pdf (viewed Sept 2024).
- 72. Clean Energy Council. Clean Energy Australia: 2024. Melbourne: CEC, 2024. https://cleanenergycouncil.org.au/getmedia/0cb12425‐37ab‐479e‐9a4b‐529622cc9c02/clean‐energy‐australia‐report‐2024.pdf (viewed Jan 2025).
- 73. Climate Council. Seize the sun: how to supercharge Australia's rooftop solar. Sydney: Climate Council, 2024. https://www.climatecouncil.org.au/wp‐content/uploads/2024/11/CC‐Report‐Seize‐the‐Sun.pdf (viewed Dec 2024).
- 74. Australian Photovoltaic Institute. Timeseries data by installation size, Australia. Australian Photovoltaic Institute, 2024. https://pv‐map.apvi.org.au/postcode (viewed Dec 2024).
- 75. Climate Council. Seize the decade: how we empower Australian communities and cut climate pollution 75% by 2030. Sydney: Climate Council, 2024. https://www.climatecouncil.org.au/wp‐content/uploads/2024/03/CC_MVSA0394‐CC‐Report‐Next‐Wave_V8‐FA‐Screen‐Single.pdf (viewed Dec 2024).
- 76. GBD 2019 Risk Factors Collaborators. Global burden of 87 risk factors in 204 countries and territories, 1990–2019: a systematic analysis for the Global Burden of Disease Study 2019. Lancet 2020; 396: 1223–1249.
- 77. Vardoulakis S, Johnston FH, Goodman N, et al. Wood heater smoke and mortality in the Australian Capital Territory: a rapid health impact assessment. Med J Aust 2024; 220: 29‐34. https://www.mja.com.au/journal/2024/220/1/wood‐heater‐smoke‐and‐mortality‐australian‐capital‐territory‐rapid‐health‐impact
- 78. World Health Organization. WHO global air quality guidelines: particulate matter (PM2.5 and PM10), ozone, nitrogen dioxide, sulfur dioxide and carbon monoxide. Geneva: WHO, 2021. https://www.who.int/publications/i/item/9789240034228 (viewed Sept 2024).
- 79. Hopke PK, Dai Q, Li L, Feng Y. Global review of recent source apportionments for airborne particulate matter. Sci Total Environ 2020; 740: 140091.
- 80. Australian Government, Department of Climate Change, Energy, the Environment and Water. Australian Energy Update 2023. Canberra: Commonwealth of Australia, 2023. https://www.energy.gov.au/sites/default/files/Australian%20Energy%20Update%202023_0.pdf (viewed Sept 2024).
- 81. Electric Vehicle Council. State of electric vehicles, July 2023. Sydney: EVC, 2023. https://electricvehiclecouncil.com.au/wp‐content/uploads/2023/07/State‐of‐EVs_July‐2023_.pdf (viewed Sept 2024).
- 82. International Energy Agency. Global EV Outlook 2024: trends in electric cars. Paris: IEA, 2024. https://www.iea.org/reports/global‐ev‐outlook‐2024/trends‐in‐electric‐cars (viewed Sept 2024).
- 83. European Commission, European Alternative Fuels Observatory. Norwegian EV market surges to 91.5% market share, setting a sustainable example [news release]. 7 April 2024. https://alternative‐fuels‐observatory.ec.europa.eu/general‐information/news/norwegian‐ev‐market‐surges‐915‐market‐share‐setting‐sustainable‐example (viewed Sept 2024).
- 84. Milovanoff A, Posen ID, MacLean HL. Electrification of light‐duty vehicle fleet alone will not meet mitigation targets. Nat Clim Chang 2020; 10: 1102‐1107.
- 85. Australian Government, Department of Agriculture, Fisheries and Forestry. Agriculture and Land Sectoral Plan. Canberra: Commonwealth of Australia, 2024. https://www.agriculture.gov.au/agriculture‐land/farm‐food‐drought/climatechange/ag‐and‐land‐sectoral‐plan (viewed Jan 2025).
- 86. Australian Government, Jobs and Skills Australia. Agriculture, forestry and fishing. Canberra: Commonwealth of Australia, 2024. https://www.jobsandskills.gov.au/data/labour‐market‐insights/industries/agriculture‐forestry‐and‐fishing (viewed Sept 2024).
- 87. Gaines A, Shahid M, Coyle D, et al. Switches in food and beverage product purchases can reduce greenhouse gas emissions in Australia. Nat Food 2024; 5: 524‐532.
- 88. Irwin A, Malik A, Vyas A, et al. The carbon footprint of health care delivery in Western Australia's public health system. Lancet Reg Health West Pac 2024; 48: 101115.
- 89. Lenzen M, Malik A, Li M, et al. The environmental footprint of health care: a global assessment. Lancet Planet Health 2020; 4: e271‐e279.
- 90. Malik A, Goodlet J, Li M, et al. Assessing waste and carbon impacts of health system at a regional level. Resour Conserv Recycl 2024; 209: 107750.
- 91. Dunne B, Forrester M, Kayak E. It's time for Australian hospitals to be all‐electric (and powered by 100% renewable energy). Med J Aust 2023; 219: 559. https://www.mja.com.au/journal/2023/219/11/its‐time‐australian‐hospitals‐be‐all‐electric‐and‐powered‐100‐renewable‐energy
- 92. Thanekar UD, Hensher M, Patrick R, et al. Exploring opportunities to reduce scope 3 emissions in renewably powered health services. Med J Aust 2024; 220: 550‐553. https://www.mja.com.au/journal/2024/220/11/exploring‐opportunities‐reduce‐scope‐3‐emissions‐renewably‐powered‐health
- 93. Lokmic‐Tomkins Z, Borda A, Humphrey K. Designing digital health applications for climate change mitigation and adaptation. Med J Aust 2023; 218: 106‐110. https://www.mja.com.au/journal/2023/218/3/designing‐digital‐health‐applications‐climate‐change‐mitigation‐and‐adaptation
- 94. Rahimi‐Ardabili H, Magrabi F, Coiera E. Digital health for climate change mitigation and response: a scoping review. J Am Med Inform Assoc 2022; 29: 2140‐2152.
- 95. Purohit A, Smith J, Hibble A. Does telemedicine reduce the carbon footprint of healthcare? A systematic review. Future Healthc J 2021; 8: e85‐e91.
- 96. Di Giacomo P, Håkansson P. A method to measure the reduction of CO2 emissions in e‐health applications. Stud Health Technol Inform 2011; 169: 970‐974.
- 97. Lokmic‐Tomkins Z, Davies S, Block LJ, et al. Assessing the carbon footprint of digital health interventions: a scoping review. J Am Med Inform Assoc 2022; 29: 2128‐2139.
- 98. McAlister S, Barratt AL, Bell KJL, McGain F. The carbon footprint of pathology testing. Med J Aust 2020; 212: 377‐382. https://www.mja.com.au/journal/2020/212/8/carbon‐footprint‐pathology‐testing
- 99. McAlister S, Barratt AL, McGain F. The carbon footprint of pathology testing. Med J Aust 2020; 213: 477. https://www.mja.com.au/journal/2020/213/10/carbon‐footprint‐pathology‐testing‐1
- 100. Workman A, Jones PJ, Wheeler AJ, et al. Environmental hazards and behavior change: user perspectives on the usability and effectiveness of the AirRater smartphone app. Int J Environ Res Public Health 2021; 18: 3591.
- 101. Beggs PJ. Thunderstorm asthma and climate change. JAMA 2024; 331: 878‐879.
- 102. Silver JD, Spriggs K, Haberle SG, et al. Using crowd‐sourced allergic rhinitis symptom data to improve grass pollen forecasts and predict individual symptoms. Sci Total Environ 2020; 720: 137351.
- 103. University of Sydney. HeatWatch, 2024. https://heatwatch.sydney.edu.au/ (viewed Sept 2024).
- 104. Gray K, Chapman W, Khan UR, et al. The rapid development of virtual care tools in response to COVID‐19: case studies in three Australian health services. JMIR Form Res 2022; 6: e32619.
- 105. Australian Digital Health Agency. Increased use of My Health Record by healthcare providers. Sydney: ADHA, 2020. https://www.digitalhealth.gov.au/newsroom/media‐releases/increased‐use‐of‐my‐health‐record‐by‐healthcare‐providers (viewed Sept 2024).
- 106. Lokmic‐Tomkins Z, Block LJ, Davies S, et al. Evaluating the representation of disaster hazards in SNOMED CT: gaps and opportunities. J Am Med Inform Assoc 2023; 30: 1762‐1772.
- 107. Flores Lima M, Cotton J, Marais M, Faggian R. Modelling the risk of Japanese encephalitis virus in Victoria, Australia, using an expert‐systems approach. BMC Infect Dis 2024; 24: 60.
- 108. García‐Berná JA, Fernández‐Alemán JL, Carrillo de Gea JM, et al. Energy efficiency in software: a case study on sustainability in personal health records. J Clean Prod 2021; 282: 124262.
- 109. Lokmic‐Tomkins Z, Borda A, Skouteris H. Climate conscious health equity is essential to achieve climate‐resilient digital healthcare. J Clim Chang Health 2024; 16: 100301.
- 110. Australian Digital Health Agency. National Digital Health Strategy 2023–2028. Sydney: ADHA, 2023. https://www.digitalhealth.gov.au/sites/default/files/documents/national‐digital‐health‐strategy‐2023‐2028.pdf (viewed Sept 2024).
- 111. Lokmic‐Tomkins Z, Bhandari D, Bain C, et al. Lessons learned from natural disasters around digital health technologies and delivering quality healthcare. Int J Environ Res Public Health 2023; 20: 4542.
- 112. Australian Commission on Safety and Quality in Health Care, Interim Australian Centre for Disease Control, Council of Presidents of Medical Colleges. Joint statement: working together to achieve sustainable high‐quality health care in a changing climate. Sydney: ACSQHC, 2024. https://www.safetyandquality.gov.au/publications‐and‐resources/resource‐library/joint‐statement‐working‐together‐achieve‐sustainable‐high‐quality‐health‐care‐changing‐climate (viewed Oct 2024).
- 113. Insurance Council of Australia. Data hub: Historical Normalised Catastrophe — January 2024. Sydney: ICA, 2024. https://insurancecouncil.com.au/industry‐members/data‐hub/ (viewed Sept 2024).
- 114. Australian Government, Australian Energy Regulator. State of the energy market 2023. Canberra: AER, 2023. https://www.aer.gov.au/publications/reports/performance/state‐energy‐market‐2023 (viewed Sept 2024).
- 115. Australian Energy Market Operator. 2024 Electricity statement of opportunities: a 10‐year outlook of investment requirements to maintain reliability in the National Electricity Market. Melbourne: AEMO, 2024. https://www.aemo.com.au/‐/media/files/electricity/nem/planning_and_forecasting/nem_esoo/2024/2024‐electricity‐statement‐of‐opportunities.pdf?la=en (viewed Sept 2024).
- 116. Graham P, Hayward J, Foster J. GenCost 2024–25: consultation draft. CSIRO, 2024. https://www.csiro.au/‐/media/Energy/GenCost/GenCost2024‐25ConsultDraft_20241205.pdf (viewed Dec 2024).
- 117. CSIRO. GenCost 2024–25 draft report released for consultation. https://www.csiro.au/en/news/All/News/2024/December/GenCost‐2024‐25‐Draft‐Report‐released‐for‐consultation (viewed Dec 2024).
- 118. Australian Bureau of Statistics. Employment in renewable energy activities, Australia: 2018–19 financial year. Canberra: ABS, 2020. https://www.abs.gov.au/statistics/labour/employment‐and‐unemployment/employment‐renewable‐energy‐activities‐australia/latest‐release (viewed Sept 2024).
- 119. Australian Bureau of Statistics. Australian industry: 2022–23 financial year. Canberra: ABS, 2024. https://www.abs.gov.au/statistics/industry/industry‐overview/australian‐industry/latest‐release (viewed Sept 2024).
- 120. Australian Bureau of Statistics. Labour account Australia: June 2024. Canberra: ABS, 2024. https://www.abs.gov.au/statistics/labour/labour‐accounts/labour‐account‐australia/latest‐release (viewed Sept 2024).
- 121. Global Fossil Fuel Divestment Commitments Database. Stand.earth, 2024. https://divestmentdatabase.org/ (viewed Sept 2024).
- 122. Australian Energy Market Operator. 2024 Integrated System Plan (ISP). Melbourne: AEMO, 2024. https://aemo.com.au/en/energy‐systems/major‐publications/integrated‐system‐plan‐isp/2024‐integrated‐system‐plan‐isp (viewed Sept 2024).
- 123. Australian Energy Market Operator. Generation information. Melbourne: AEMO, 2024. https://aemo.com.au/energy‐systems/electricity/national‐electricity‐market‐nem/nem‐forecasting‐and‐planning/forecasting‐and‐planning‐data/generation‐information (viewed Sept 2024).
- 124. Organisation for Economic Co‐operation and Development. OECD inventory of support measures for fossil fuels: Australia. OECD Environment Statistics (database). Paris: OECD, 2024. https://www.oecd‐ilibrary.org/sites/5a3efe65‐en/1/3/4/index.html?itemId=/content/publication/5a3efe65‐en&_csp_=2ffa7a733148fec42dccf926d7619e1c&itemIGO=oecd&itemContentType=book#figure‐d1e1332‐acf41476e4 (viewed Sept 2024).
- 125. Campbell R, Morison E, Ryan M, et al. Fossil fuel subsidies in Australia 2024: federal and state government assistance to major producers and users of fossil fuels in 2023–24. Canberra: Australia Institute, 2024. https://apo.org.au/node/326736 (viewed Sept 2024).
- 126. World Bank Group. State and trends of carbon pricing dashboard. Washington, DC: WBG, 2024. https://carbonpricingdashboard.worldbank.org/ (viewed Sept 2024).
- 127. Australian Government, Department of Climate Change, Energy, the Environment and Water. Australia's National Greenhouse Accounts. Canberra: Commonwealth of Australia, 2024. https://greenhouseaccounts.climatechange.gov.au/ (viewed Sept 2024).
- 128. Australian Government, Department of Climate Change, Energy, the Environment and Water. Safeguard Mechanism. Canberra: Commonwealth of Australia, 2024. https://www.dcceew.gov.au/sites/default/files/documents/safeguard‐mechanism‐reforms‐factsheet.pdf (viewed Feb 2025).
- 129. Australian Energy Market Commission. How the national energy objectives shape our decisions: 28 March 2024, final guidelines. Sydney: AEMC, 2024. https://www.aemc.gov.au/sites/default/files/2024‐03/AEMC‐guide‐on‐how‐energy‐objectives‐shape‐our‐decisions‐clean‐200324.pdf (viewed Sept 2024).
- 130. Parliament of Australia. Climate Change Amendment (Duty of Care and Intergenerational Climate Equity) Bill 2023: report — June 2024. Canberra: Parliament of Australia, 2024. https://www.aph.gov.au/Parliamentary_Business/Committees/Senate/Environment_and_Communications/DutyofCareBill/Report (viewed Oct 2024).
- 131. Parliament of Australia. Australian food story: feeding the nation and beyond. Inquiry into food security in Australia. Canberra: House of Representatives, Standing Committee on Agriculture, 2023. https://parlinfo.aph.gov.au/parlInfo/download/committees/reportrep/RB000221/toc_pdf/AustralianFoodStoryFeedingtheNationandBeyond.pdf (viewed Feb 2025).
- 132. Setzer J, Higham C. Global trends in climate change litigation: 2024 snapshot. Policy report. London: Grantham Research Institute on Climate Change and the Environment, London School of Economics and Political Science; 2024. https://www.lse.ac.uk/granthaminstitute/wp‐content/uploads/2024/06/Global‐trends‐in‐climate‐change‐litigation‐2024‐snapshot.pdf (viewed Sept 2024).
- 133. United Nations Environment Programme. Global climate litigation report: 2023 status review. Nairobi: UNEP, 2023. https://www.unep.org/resources/report/global‐climate‐litigation‐report‐2023‐status‐review (viewed Dec 2024).
- 134. Harrington LJ, Frame D. Extreme heat in New Zealand: a synthesis. Clim Change 2022; 174: 2.
- 135. Zhao Q, Li S, Ye T, et al. Global, regional, and national burden of heatwave‐related mortality from 1990 to 2019: a three‐stage modelling study. PLoS Med 2024; 21: e1004364.
- 136. Lai H, Lee JE, Hales S, Health Research Council Grant Project Team. Spatial patterns of heat exposure and child hospital admissions in Aotearoa New Zealand. ISEE 2024: 36th Annual Conference of the International Society of Environmental Epidemiology. ISEE Conference Abstracts. EHP Publishing, 2024; https://doi.org/10.1289/isee.2024.1869.
- 137. Pourzand F, Hales S, Chambers T. Associations between local 30‐day averages of weather variables and notifications of Shiga toxin‐producing E. coli in Aotearoa New Zealand 2010‐2019. ISEE 2024: 36th Annual Conference of the International Society of Environmental Epidemiology. ISEE Conference Abstracts. EHP Publishing, 2024; https://doi.org/10.1289/isee.2024.1704.
- 138. Grout L, Hales S, Baker MG, et al. Severe weather events and cryptosporidiosis in Aotearoa New Zealand: a case series of space–time clusters. Epidemiol Infect 2024; 152: e64.
- 139. Taiapa K, Barnes HM, Wright S. Climate change and mātauranga Māori: making sense of a western environmental construct. Kōtuitui: New Zealand Journal of Social Sciences Online 2024: 1‐12; https://doi.org/10.1080/1177083X.2024.2350195.
- 140. Jones R, Reid P, Macmillan A. An Indigenous climate justice policy analysis tool. Clim Policy 2024; 24: 1080‐1095.
- 141. Cleghorn C, Nghiem N, Ni Mhurchu C. Assessing the health and environmental benefits of a New Zealand diet optimised for health and climate protection. Sustainability 2022; 14: 13900.
- 142. Kliejunas E, Cavadino A, Kidd B, et al. Quantifying the greenhouse gas emissions of New Zealand households’ food purchases: an analysis by demographic variables. J Clean Prod 2023; 430: 139699.
- 143. Shaw C, Mizdrak A, Gage R, et al. Policy approaches to decarbonising the transport sector in Aotearoa New Zealand: modelling equity, population health, and health‐system effects. Lancet Planet Health 2024; 8: e647‐e656.
- 144. Daalder M. Emissions fall again — now NZ needs to up the pace. Newsroom, 19 Apr 2024. https://newsroom.co.nz/2024/04/19/emissions‐fall‐again‐now‐nz‐needs‐to‐pick‐up‐the‐pace/ (viewed Sept 2024).
- 145. Insurance Council of New Zealand. Cost of natural disasters. Wellington: ICNZ, 2023. https://www.icnz.org.nz/industry/cost‐of‐natural‐disasters/ (viewed Sept 2024).
- 146. Harrington LJ, Dean SM, Awatere S, et al. The role of climate change in extreme rainfall associated with cyclone Gabrielle over Aotearoa New Zealand's East Coast. World Weather Attribution Initiative Scientific Report. London: Grantham Institute, Imperial College London, 2023; https://doi.org/10.25561/102624 (viewed Sept 2024).
- 147. Harrison S, Macmillan A, Bond S, Stephenson J. Participatory modeling for local and regional collaboration on climate change adaptation and health. J Clim Chang Health 2023; 12: 100235.
- 148. Pourzand F, Bolton A, Salter C, et al. Health and climate change: adaptation policy in Aotearoa New Zealand. Lancet Reg Health West Pac 2023; 40: 100954.
- 149. New Zealand Climate Change Commission. Progress report: National Adaptation Plan (August 2024) — assessing progress on the implementation and effectiveness of the government's first national adaptation plan. Wellington: CCC, 2024. https://www.climatecommission.govt.nz/our‐work/adaptation/nappa/nappa‐2024 (viewed Sept 2024).
Summary