


Summary
- Climate plays an important role in human health and it is well established that climate change can have very significant impacts in this regard. In partnership with The Lancet and the MJA, we present the inaugural Australian Countdown assessment of progress on climate change and health.
- This comprehensive assessment examines 41 indicators across five broad sections: climate change impacts, exposures and vulnerability; adaptation, planning and resilience for health; mitigation actions and health co-benefits; economics and finance; and public and political engagement.
- These indicators and the methods used for each are largely consistent with those of the Lancet Countdown global assessment published in October 2017, but with an Australian focus. Significant developments include the addition of a new indicator on mental health.
- Overall, we find that Australia is vulnerable to the impacts of climate change on health, and that policy inaction in this regard threatens Australian lives. In a number of respects, Australia has gone backwards and now lags behind other high income countries such as Germany and the United Kingdom. Examples include the persistence of a very high carbon-intensive energy system in Australia, and its slow transition to renewables and low carbon electricity generation. However, we also find some examples of good progress, such as heatwave response planning.
- Given the overall poor state of progress on climate change and health in Australia, this country now has an enormous opportunity to take action and protect human health and lives. Australia has the technical knowhow and intellect to do this, and our annual updates of this assessment will track Australia’s engagement with and progress on this vitally important issue.
Climate is important to health and wellbeing, especially where climates are extreme and particularly variable, as in Australia. Despite having one of the world’s best health systems, the health of Australians is highly vulnerable to the country’s climate and weather extremes, as exemplified by the world’s largest epidemic thunderstorm asthma event in Melbourne on 21 November 2016.1 Australia therefore needs a detailed understanding of and suite of health and wellbeing-related responses to the impacts of climate change. While brief overviews of the impacts of climate change on human health in Australia have been presented,2 this report is the first to examine Australia’s broad progress on climate change and human health, including considering its social, economic and political determinants, and progress towards mitigation and adaptation.
Global assessments have shown the importance of climate change and human health. In 2009, The Lancet concluded that “climate change is the biggest global health threat of the 21st century”.3 In 2015, its subsequent report paired this conclusion with the assertion that “tackling climate change could be the greatest global health opportunity of the 21st century”.4 Most recently, the Lancet Countdown, a multi-institutional collaboration spearheaded by University College London, examined progress on climate change and human health at a global scale. Its first assessment was published online in October 20175 and will be repeated annually until 2030. This is consistent with the near term timeline of the Paris Agreement, which entered into force on 4 November 2016. The Agreement builds upon the United Nations Framework Convention on Climate Change and, for the first time, brings all nations into a common cause to undertake ambitious efforts to combat climate change and adapt to its effects.6
Through a partnership between The Lancet, University College London and the MJA,7 Australia is one of a select few countries to undertake their first national Countdown assessment. The publication of the first Australian Countdown assessment is timed to coincide with the publication of the Lancet Countdown’s second global assessment,8 in order to enhance both the national and international exposure of the assessments.
Methods
The Australian Countdown is a multidisciplinary and interdisciplinary collaborative assessment led by the University of Sydney and Macquarie University. Relevant experts from these two institutions and those from other Australian institutions with the required expertise were brought together to form the authorship team. Work on the assessment commenced following the inaugural meeting of the original team members in September 2017.
The Lancet Countdown’s 2017 report tracked progress on health and climate change across 40 indicators divided into five broad sections: climate change impacts, exposures and vulnerability; adaptation, planning and resilience for health; mitigation actions and health co-benefits; economics and finance; and public and political engagement.
To establish indicators for Australia to monitor our own progress on health and climate change, the Australian Countdown assessment adopts these same sections and, where possible, the methods used by the Lancet Countdown report.5 Where more appropriate for an Australia-focused assessment or where it was possible to refine or improve on the original method as more precise and comprehensive data or methods were available at the national level, the method for the Australian indicators was modified or an alternative method was employed. We have also modified the Lancet Countdown indicator titles where necessary and have changed some completely to provide a more relevant focus for that indicator (eg, 1.7.2 Marine primary productivity was changed to 1.7.2 Prevalence of malnutrition). One indicator was excluded because Australian data were unavailable (3.5.2 Sectoral contributions to air pollution). Our Australian assessment also introduces two entirely new indicators: 1.9 Mental health, and 3.10 Soil organic carbon. Details of our methods, data and caveats are provided for each indicator in the Appendix. We also provide a brief summary of the method within the text for each indicator here. Our final list of 41 indicators is provided in Box 1.
Section 1: Climate change impacts, exposures and vulnerability
In this section, we present preliminary indicators for selected climate change-related exposures (temperature, heatwaves and disasters), vulnerabilities (changes in labour capacity, food insecurity and malnutrition) and health impacts (climate-sensitive and infectious diseases, non-accidental mortality and suicide). The frequency, intensity, duration, seasonality and location of exposures interact with multiple factors to influence the resulting distribution and burden of disease. For example, Australia’s most common mosquito-borne disease, Ross River virus, is affected by rainfall and tides, while heat-related mortality rates differ among states, major cities and genders. We cannot currently quantify the contribution of climate change to many health outcomes, so we begin by discerning some baselines and exemplar trends.
1.1 Health effects of temperature change
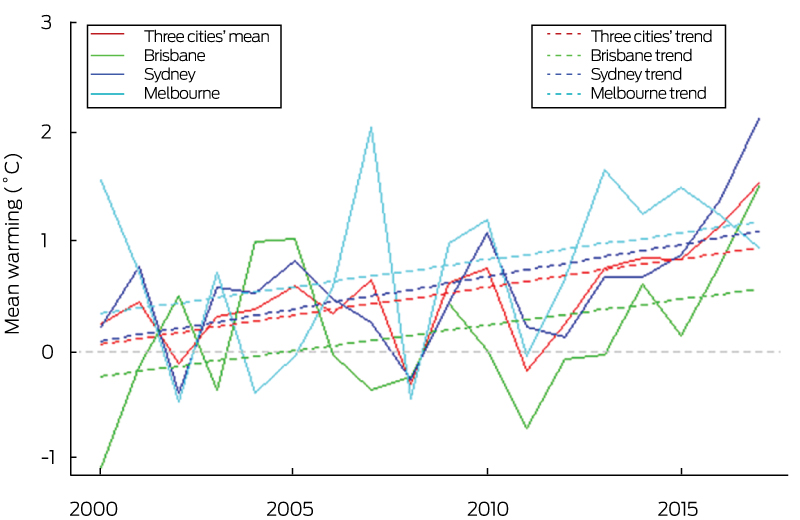
We used a time series model with non-linear function to examine the association between summer daily mean temperature and non-accidental mortality in Australia’s three biggest cities: Sydney, Melbourne and Brisbane.9 We found significant linear associations between exposure to higher temperatures and greater mortality in all three cities (Appendix, Figure A1), but the magnitude of the effect varied by city. Although increasing temperatures may exacerbate existing health problems in the Australian population, the health impact of temperature change depends on the detailed spatiotemporal trends of population and temperature over time.
Temperature anomalies were calculated relative to 1986–2008 from each city for summer average temperature (Box 2), showing that between 2000 and 2016 human exposure to atmospheric warming in the three biggest Australian cities was on average about 0.9°C. This suggests that Australian cities are highly vulnerable to rising temperatures and consequent health impacts and that adaptive action for cities is urgently required.
1.2 Health effects of heatwaves
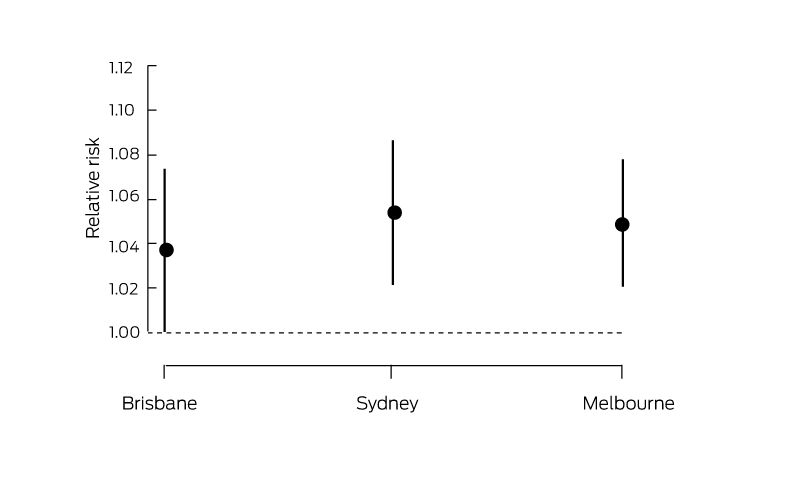
We defined a heatwave as minimum temperatures above the 95th percentile of each city’s minimum temperatures for more than 3 days during the study period (1988–2009). Time series models were used to examine the association between heatwaves and non-accidental mortality in the three largest Australian cities: Sydney, Melbourne and Brisbane.9 This indicator shows that there were statistically significant associations between heatwaves and mortality in all three cities (Box 3), but the magnitude of the effect estimates varied by city.
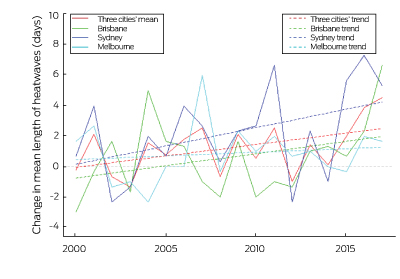
Change in annual heatwave length for the period 2000–2017 was calculated against the annual mean for 1986–2008. Overall, the length of heatwaves increased in 2016 and 2017 in all three cities (Box 4). Heatwave length varied considerably from year to year, but between 2000 and 2017, the mean number of heatwave days increased significantly by over 2 days in Australia. Given that heatwave is an important risk factor for mortality, adaptation strategies should be developed urgently to protect human health from exposure to heatwaves.
1.3 Change in labour capacity
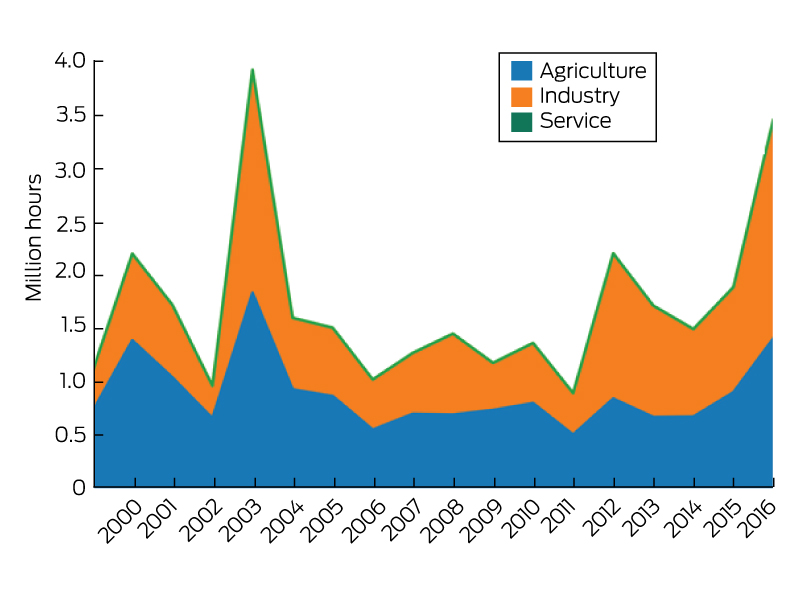
Workers’ compensation claims in Adelaide increased by 6.2% during heatwaves, predominantly among outdoor male workers and tradespeople over 55 years.10 Annual productivity losses from heat stress have been estimated at A$616 per employed person, equating to a national annual economic burden of around A$5.8 billion (95% CI, $5.2–$7.3 billion) or 0.33–0.47% of Australia’s gross domestic product.11 A study for the city of Perth projects that by 2070, manual labour will be dangerous to perform on 15–26 days per year compared with 1 day per year at present for acclimatised people.12 For this indicator, we calculated total hours of labour lost due to heat in the agriculture, industry and service sectors in Australia (Box 5). Over the period 2000–2017, there was significant interannual variability, with two periods of particularly high labour loss: an earlier period including the years 2001, 2002 and 2004; and a later period including the years 2013, 2014, 2016 and 2017.
1.4 Lethality of weather-related disasters
The Emergency Events Database (EM-DAT) is used in Australia for consistency with international assessments. It estimates that between 1900 and 2017, 600 Australians died from drought, 319 from floods, 248 from storms, 501 from bushfires and 509 from extreme temperature (totalling 2177). However, the quality of the database has been questioned13 and may not be accurate for Australia. For example, Blanchi and colleagues14 identified 825 deaths from wildfire over a slightly shorter period (1901–2011), indicating that the EM-DAT figures are likely to be underestimates.
1.5 Trends in overall burden of climate-sensitive diseases
Several health outcomes are known to be directly (eg, heat and severe storms) or indirectly (eg, vector-borne disease and mental health) associated with climate. We examined health outcomes linked with relative certainty to climate taken from global burden of disease estimates for Australia. Our analyses found few national level trends suggestive of climate change impacts, perhaps because in a large and climatically diverse country such as Australia, national level data may average out or dilute trends at a sub-national level (and global burden of disease data cannot be disaggregated to sub-national or local level to identify trends at this level). It may also be the case that there are a series of mega-trends currently driving burden of disease, and the climate signal is only detectable in specific diseases or in specific contexts within other diseases.
1.6 Climate-sensitive infectious diseases
As the most notified vector-borne disease in Australia, the relationship between Ross River virus infections and climate variability has been studied in Queensland, South Australia, Western Australia, Northern Territory and Tasmania, with results suggesting that rainfall, temperature and tidal level play an important role in disease transmission.15-17 Similar associations were found for Barmah Forest virus infection. Interannual weather variation is one determinant of dengue outbreak receptivity in North Queensland.18 For enteric infections, studies in SA, Queensland, WA, New South Wales and Victoria showed that maximum temperatures and heatwaves significantly affect Salmonella infections, including specific serotypes and phage types.19,20 However, no clear association between weather and Campylobacter infections has been established in Australia.21
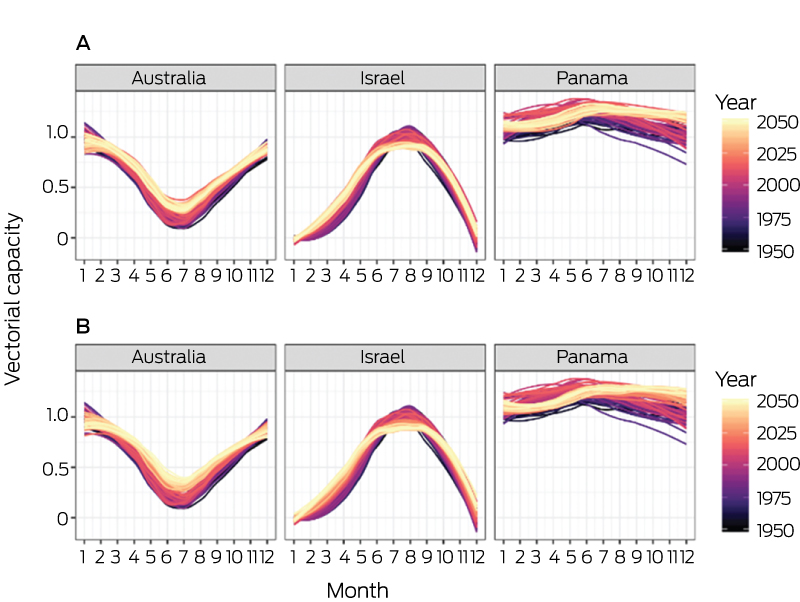
For this indicator, we focused on dengue fever by calculating the vectorial capacity of its main mosquito vector, Aedes aegypti, over the period 1950–2050 in Australia (Box 6 and Box 7). Vectorial capacity refers to a vector’s ability to transmit disease to humans and incorporates interactions between host, virus and vector, assuming that all three of these elements are present.5 There is a clear increasing trend of A. aegypti vectorial capacity over this period (Box 6), with an observed increase of 13.7% from the 1950s to 2016. A particularly strong increase in the winter vectorial capacity trough is resulting in decreasing annual seasonality (Box 7).
1.7 Food insecurity and malnutrition
Food insecurity is associated with malnourishment and poor health. Climate change may exacerbate food insecurity through direct (eg, flood damage to crops) and indirect mechanisms such as reduced crop nutrients (eg, protein, iron and zinc) due to increased carbon dioxide (CO2) levels and scarcity-related food price increases.22
Wheat yield potential in Australia declined by 27% over a 26-year period from 1990 to 2015 because of reduced rainfall and rising temperatures, although this is not fully expressed in actual national yields due to an unprecedented rate of technology-driven gains.23
1.7.1 Prevalence of food insecurity
Nationally, 4% of people experienced food insecurity (running out of food and being unable to afford to buy more) in 2014.24 Rates were similar for all states and territories, but much greater food insecurity (22%) was found among Indigenous people (20% in non-remote Australia, 31% in remote Australia).25 The current single measure of food insecurity in Australia assesses only one dimension of food insecurity (affordability) and is likely to underestimate the true prevalence.26 Assessment of all dimensions of food insecurity (eg, physical availability, quality) would provide more accurate data. As yet, we have no indicator of the health effects of climate change via food insecurity. However, drought-related (compared with poverty-related) food insecurity is associated with poor mental health27 and could form the basis of a future indicator. Effective adaptive strategies among Indigenous Australians and other vulnerable groups, including women and children in lower socio-economic groups, must be identified.
1.7.2 Prevalence of malnutrition
About two-thirds (63.4%) of adult Australians are overweight (35.5%) or obese (27.9%), with slightly higher rates in regional and remote Australia compared with major cities.24 Survey data indicate that adulthood overweight and obesity are on the rise in Australia (54% in 2004–2005 v 38% in 1989–1990).28
In 2014–15, only 5.1% of Australian adults and 5.1% of Australian children aged 2–18 years met the Australian dietary guidelines for recommended daily serves of both fruit and vegetables: 49.8% of adults and 68.1% of children met the guidelines for fruit and 7.0% (adults) and 5.4% (children) for vegetables.29 In 2011–12, 35% of total daily energy consumed by Australians was from discretionary (ie, junk) foods.24 While positive dietary changes have been observed in the Australian population,30 it is important that we continue to monitor consumption in the face of climate change, particularly among our most vulnerable groups.
Climate change may have an impact on food prices and therefore exacerbate inadequate consumption of key food groups. For example, the Australian drought in 2005–2007 was reported to be the primary contributor to elevated food prices, with increases of 33% for vegetables and 43% for fruit.31 Energy-dense, nutrient-poor foods are less affected by increases in costs of agricultural commodities. If food price increases occur then individuals may shift from healthier food (often expensive) to less healthy food (often less expensive), thus having a negative impact on health. It is predicted that drought-related food price shocks may occur every 2–4 years in Australia in the future, especially for foods such as fresh fruit and vegetables that are supplied mainly by local producers.31
Research indicates that elevated CO2 levels may reduce levels of iron in C3 grains (eg, wheat, maize, barley) and legumes (eg, soybeans)32 and vegetables.33 While some cereal foods are fortified with iron in Australia, a reduction in the iron content of foods may have implications for nutrient intake as 23% of Australian females are reported to have inadequate iron intake.29 Research also suggests that elevated CO2 levels may also reduce zinc in C3 grains and legumes32 and vegetables.33 This may be of concern as a large minority in Australia also has inadequate usual zinc intake (37% males and 9% females).29 These projected changes to plant nutritional content should be taken into account when recommending to eat less animal-source foods (which are excellent sources of bioavailable iron and zinc) in favour of a plant-based diet.
Improved attention to monitoring the nutritional content of food entering the human value chain will be important as we move forward to understand the combined impacts of climate change, selection pressure by breeders, and soil nutrient depletion. Perhaps more attention will need to be given to formulating human diets in relation to gender, age, health status and reproductive status using optimal mixes of plant- and animal-source foods.
1.8 Migration and population displacement
Migration may harm health (eg, from new exposure to communicable disease or crowding arising from large scale population displacement34,35). It may also promote health (eg, moving to a new country with better health care as active adaptation). Migration attributable to climate change can be planned or forced in response to slow changes such as drought, or to sudden extreme events such as flooding (Appendix, Table A3).35,36 Sea level rises inundating vulnerable coastal residential, economic and cultural assets will likely contribute to internal migration within Australia, as may extreme heat and other extreme events. Climate change is also shifting the location of agriculture and fisheries,37 and human settlements are likely to follow. Tasmania is already preparing to receive increasing numbers of migrants from mainland Australia.38 There are currently no estimates of how many people have migrated due to climate change in Australia.
1.9 Mental health
Preliminary mapping of the climate change–mental health system has been undertaken39 as recommended.5 In this context, systems thinking is a set of “synergistic analytic skills” used to describe interacting factors that produce outcomes, predict their behaviour, and develop interventions to achieve desired results.5 We present a one-decade baseline indicator of the climate change–mental health system: the association between mean annual maximum temperatures and suicide rates for Australian states and territories over the period 2007–2016. In Australia, hot days have a damaging effect on whole-population mental health equivalent to that of unemployment40 and predict hospitalisation for self-harm.41 Men and residents of the NT are significantly disproportionately likely to die by self-harm. In warmer states and territories, higher mean annual maximum temperatures predict elevated suicide rates (Box 8, A). This association is reversed in cooler locations, where elevated suicide rates are predicted by cooler maximum temperatures (Box 8, B). Future years will record deviations from these baseline decade means. Adaptation planning for unusually hot or cold weather could usefully consider the interaction between suicide, gender, jurisdiction and local climate, with the aim of weakening temperature–suicide associations.
Conclusion: climate change impacts, exposures and vulnerability
Despite difficulties with data availability and attribution, it is evident that Australians face non-trivial exposure to known climate change-related health risk factors. Since 2000, our biggest cities have warmed considerably and we now have additional annual heatwave days. Climate change threatens to exacerbate existing food insecurity and malnutrition in Australia. We have no data on climate-related migration into Australia (although migration is a known health risk factor) and no plans to manage it. Systems thinking (eg, in mental health) may provide an approach that could help Australia take a broad perspective on the range of actions that it should take.
Section 2: Adaptation planning and resilience for health
Most of Australia operates under three nested tiers of government — local (eg, city council), state/territory and national — which means that the responsibility for climate change adaptation planning falls across multiple jurisdictions. The three tiers of government have differing areas of responsibility, from waste collection (local council) to health, transport and education (state/territory) to income tax and international trade and diplomacy (federal). This governance structure with competing priorities, within a vast and diverse landscape, means that adaptation planning is relatively complex, is not uniformly advanced, and varies in key priorities for action.
2.1 Australian adaptation plans for health
With the notable exception of Queensland, there are no current standalone climate change and health adaptation plans for Australia as a whole or for any other states and territories. However, the nation, these other states and the ACT all have broad-ranging climate change adaptation plans or strategies.38,42-47 Each of these includes health to some extent. For example, the national strategy43 includes a five-page section on health and wellbeing, and the Victorian plan includes a two-page section on addressing the impacts on health and human services. Climate change adaptation planning is also making its way into related plans such as the Victorian public health and wellbeing plan (2015–2019). The Human Health and Wellbeing Climate Change Adaptation Plan for Queensland48 is a comprehensive 63-page document exploring not only the impacts of climate change on health and wellbeing but also gaps and barriers to adaptation, opportunities and co-benefits, and pathways to respond, in addition to the particulars of the plan itself. Perhaps the most well developed climate change health adaptation planning relates to heat, with both national and state/territory level plans in place.49
2.2 City level climate change risk assessments
Climate change risk assessments and adaptation plans were sought for each of Australia’s state and territory capital cities: Sydney, Melbourne, Brisbane, Perth, Adelaide, Canberra, Hobart and Darwin, which include about 15 600 000 or 67% of the total Australian population. Climate across these cities varies from cool temperate with no distinct dry season, to tropical with a distinct summer wet season (Appendix, Table A5).50,51
Other than the NT, all states and territories had at least one adaptation strategy sitting within a broader climate change framework52-58 (Appendix, Table A6). For Victoria, Queensland, WA and Tasmania, adaptation plans were state-wide only.38,46-48,59 NSW included a regional approach that also included Sydney,60 and the ACT’s focus was on the city of Canberra,42 which takes up the majority of the territory. Two strategies were identified for each of WA46,61 and Tasmania.38,59 Not all strategies included impacts or adaptation for health or health services, these being only implied under other sectors for SA and Tasmania. Only three of the state/territory strategies were comprehensive (ACT, Queensland and WA), the NSW strategy was somewhat comprehensive, and the remaining ones were lacking in detail in either approach or planned actions. The local governments of each of the eight capital cities had themselves conducted climate change risk assessments and/or had adaptation plans62-68 (Appendix, Table A7). Of these, only three explicitly considered health and/or health services (Adelaide, Canberra, Sydney), and health consideration was implied with regard to managing extreme events in the Hobart plan. The Canberra and Hobart plans were comprehensive, and that of Sydney was somewhat comprehensive. The Canberra plan was the only one, at state or city level, to make explicit links between health and other sectors. Details of health considerations and other sectors are included in Appendix, Table A6.
2.3 Detection and early warning of, preparedness for and response to health emergencies
Based on the latest World Health Organization (WHO) International Health Regulations (IHR) annual reporting data, which comprises 167 countries’ self-reported status on IHR implementation capacity,69 Australia has an average value of 100% for the 13 core capacity indicators in 2016, indicating a very high public health capacity to implement the IHR effectively compared with the average value of 79% in the WHO Western Pacific Region. However, a limitation is that the data are for capacity only and not for actions taken.
In Australia, all state/territory Departments of Health have established heatwave and population health response mechanisms, targeting various vulnerable populations. Given there is no universal heatwave definition, each health department uses its own criteria. Recently, the excess heat factor, which measures unusually high daily mean temperatures compared with the local long term climate and the recent past, has been recommended by the Bureau of Meteorology.70 Other early warning mechanisms include the Australian Red Cross Telecross REDi service,71 providing services to older people during heatwaves in SA. An evaluation assessment72 suggested that the early heat and health warning system initiated by the SA Government was effective in terms of significantly reducing the ambulance call-outs, emergency department presentations and hospitalisations in Adelaide.
2.4 Climate information services for health
The Bureau of Meteorology (BOM) currently provides real-time forecast services directly to the health sector in three areas: ultraviolet (UV) radiation, heatwave and thunderstorm asthma (Appendix, Table A8). Australia has one of the highest levels of UV exposure and highest rates of skin cancer in the world. To help people know when to protect themselves, the BOM UV index forecasts (values given 3-hourly on a scale of 1 to ≥ 11) are included in local Bureau weather forecasts, the BOM Weather app, online maps and tables, and also via the free SunSmart app.
Heatwaves cost more lives in Australia than all other natural hazards combined.73 The BOM issues national heatwave assessments and forecasts during the warm half of the year (October–March) to show where heatwaves have occurred and when and where excessive heat is expected during the coming week. These are based on the excess heat factor.70
Following an unprecedented epidemic thunderstorm asthma event in Victoria in 2016,1 the BOM and the Victorian Department of Health and Human Services undertook a 3-year pilot of a new early warning service, starting in 2017, to provide the Victorian community and health sector with information to respond to enhanced risk of thunderstorm asthma.
2.5 National assessment of vulnerability, impacts and adaptation for health
The 2008 Garnaut climate change review74 was primarily an analysis of the economic impacts of climate change on Australia, following the United Kingdom’s Stern review.75 The multisectoral analysis concluded that the costs of mitigating climate change through reduced greenhouse gas emissions would be substantially less than dealing with the consequences of inaction. The main recommendations included encouraging investment in low emissions technologies through a carbon tax or an emissions trading scheme. The 2011 update report76 recognised the additional and unquantifiable value of Australia’s natural and social assets as additional reasons to reduce emissions in Australia’s best interests. Australia’s Climate Commission produced reports on a broad range of climate change issues and topics,77,78 including extreme weather,79 global trends in renewable energy uptake and options for Australia,80-82 and the likely health impacts from climate change.83
2.6 Climate-resilient health infrastructure
The climate change risk assessments and adaptation plans of Australia’s state and territory capital cities were examined to determine whether they considered health infrastructure and the health system more broadly. Of the adaptation plans, those of Queensland, NSW, Victoria, WA, SA, the ACT and Tasmania mentioned infrastructure in relation to health. Of these, only Queensland, WA and the ACT gave any comprehensive consideration (Appendix, Table A6, indicator 2.2). Of the capital cities, only Adelaide considered infrastructure in relation to human health (Canberra being under the ACT plan). Where health-related infrastructure was mentioned, it was usually in relation to emergency service coordination and responding to extreme heat (health service load and protecting vulnerable community members), rather than in ensuring long term resilience and capacity to cope with less acute events (eg, vector-borne disease outbreaks) that will nonetheless cause additional strain on the health system.
Conclusion: adaptation planning and resilience for health
Adaptation planning in Australia is, with the exception of the ACT and Queensland, not very comprehensive. Few jurisdictions recognise the importance of building resilience through improving underlying population health, the impacts that climate change (including extreme events) are likely to have on the health of the population, and the need for the health system itself to be resilient and responsive to the challenges brought by climate change. While many local councils have been active in adaptation planning, their impact is geographically highly constrained and they are limited by what is possible under state/territory and federal legislation. Heatwave response planning is the area which is most advanced, with all states and territories having a plan in place that recognises the vulnerability of certain population groups to extreme heat.
Section 3: Mitigation actions and health co-benefits
This section presents various indicators that cover the health benefits associated with mitigating climate change through reductions in the carbon intensity of the energy system, the phase-out of coal, as well as shifts towards lower carbon-intensive energy and transportation systems. This section also covers indicators related to emissions from meat production for human consumption, health care sector emissions, and data on soil organic carbon. There are many obvious health co-benefits associated with moving away from coal and towards a cleaner energy and transportation system, including those related to improvements in air quality.84,85 As a developed country, Australia tracks relatively well in terms of indicators such as air pollution. However, it is evident that there are many areas where Australia falls behind other developed countries, especially regarding the transition towards cleaner energy, transportation and agricultural solutions.
3.1 Carbon intensity of the energy system
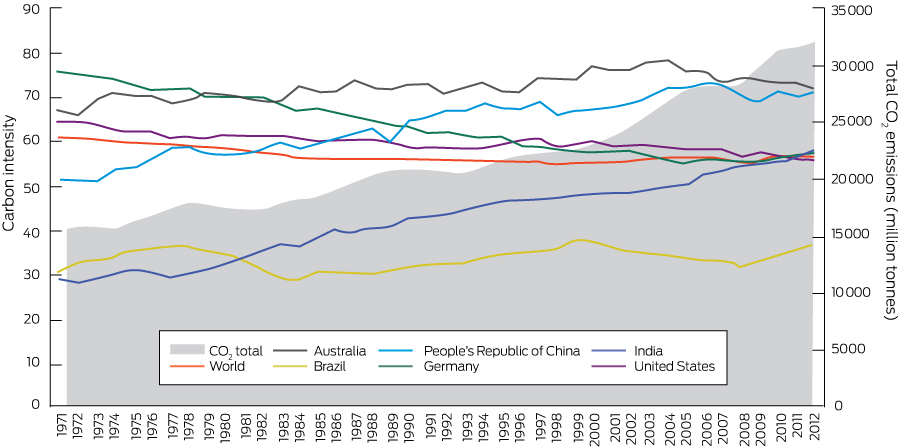
The carbon intensity of the energy system is defined as the tonnes of CO2 emitted for each unit of primary energy supplied. On a global level, the carbon intensity of total primary energy supply has remained relatively stable since 1990. As shown in Box 9, a reduction in carbon intensity in developed countries such as Germany and the United States has been offset by an increased carbon intensity of energy supply in developing countries such as China and India.5 However, looking at total global CO2 emissions, it is clear that these have increased substantially. Australia’s carbon intensity of total primary energy supply increased from 66 in the early 1970s to 78 in 2005, and slightly decreased thereafter. This can be attributed to a growth in renewables, the closure of coal-fired power plants, and a shift away from energy-intensive manufacturing and engineering utilities.86 However, it must be noted that Australia’s carbon intensity of total primary energy supply continues to be the highest of those presented in Box 9.
3.2 Coal phase-out
The primary use of coal and coal products is power generation. Ninety per cent of Australia’s coal consumption is devoted to power generation, and the country is one of the world’s largest coal net exporters (31% of world coal exports in 2015).87 According to data provided by the International Energy Agency,87 world coal production declined in 2015 by 207 Mt. World coal production accounts for 28% of the world total energy supply (second behind oil, which accounts for 31%). However, the share of coal is higher in terms of electricity production (39%), while both renewables and gas account for 23% of electricity production each. Leading countries for primary coal supply are China (48% of global production), the US (11%), followed by India, Australia and Indonesia. Together, these five countries account for 80% of primary coal supply.87
3.3 Zero carbon emission electricity
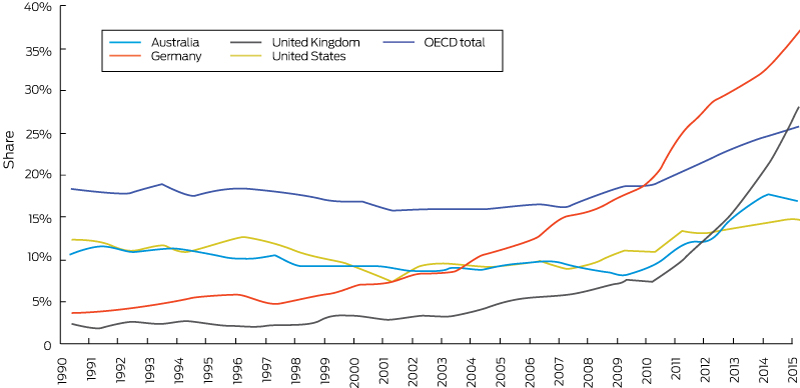
This indicator draws upon data that consider both renewable and low carbon electricity generation. Renewable sources are defined as sources that produce energy from renewable sources in a sustainable manner (including bioenergy, geothermal energy, hydropower, ocean energy, solar energy and wind energy, but excluding nuclear power). An increase in the use of low carbon and renewable energy for electricity generation will decrease the reliance on fossil fuels, and thus create improvements in air quality, with benefits to health.5
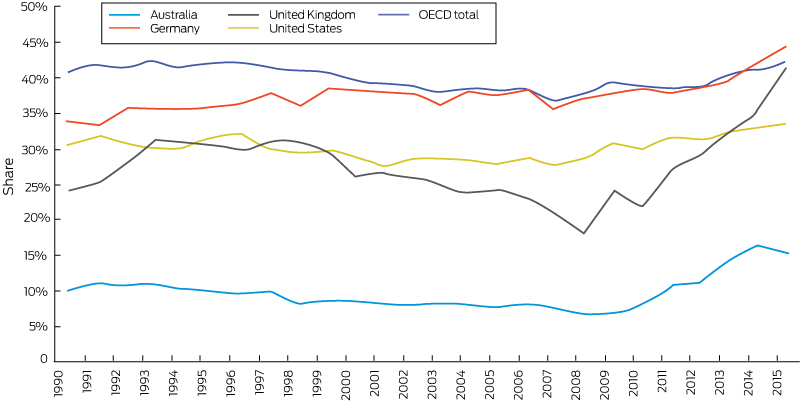
Some countries such as Germany and the UK have seen rapid increases in the share of renewable and low carbon generation. In Australia, this increase has been much more modest. From 1990 to 2015, the share of electricity generation from renewable sources increased from 11% to 17%, and from 10% to 15% from low carbon sources (Box 10 and Box 11). Energy Network Australia has recently agreed on an ambitious target to generate electricity with no carbon emission by 2050. Although detailed planning is still not clear, more legislation, including a carbon price, would be needed to achieve a clean future.88
3.4 Access to clean energy
Data from the World Bank demonstrate that essentially all of Australia’s population has access to electricity. In 2016, 17.3% of Australia’s electricity was provided by renewable energy sources.89 It is estimated that 42.3% of Australia’s renewable energy was contributed by hydroelectric power plants in 2016, making hydro power an important contributor.89 Australia has a renewable energy target regulation in place, with a target of 33 000 GWh for large scale generation (wind and solar farms or hydroelectric power stations) in 2020.90 About 17 500 GWh of renewable energy was generated in 2016 towards meeting the large scale component, meaning that about half of the renewable energy target has been achieved so far.89 Australia has a small scale renewable energy scheme, providing incentives for households or small businesses to install small scale renewable energy systems (eg, solar hot water or solar photovoltaic). About 135 000 solar rooftop systems were installed in 2016, which was steady compared with the year before,89 but there are signs that uptake is increasing, especially in SA where the government is aiming to roll out at least 50 000 home solar and battery systems.
However, as noted above, Australia tracks behind other countries such as Germany and the UK. Many of Australia’s remote and Indigenous communities still lack a reliable energy supply.91 Opportunities exist here to replace diesel generators with solar and battery systems, which will also provide opportunities to Indigenous communities and businesses in terms of reducing living costs, enabling return to country, and having the ability to install the internet. Such opportunities will in turn open up a range of positive health, but also business, education and social outcomes.92
3.5 Exposure to ambient air pollution
Air pollution influences the respiratory system following inhalation and then affects the cardiovascular system after transfer from the lungs to the blood. Fine particulate matter, such as particles less than 2.5 μm in diameter (PM2.5), causes premature death from cardiorespiratory diseases and is considered a good indicator of other outdoor air pollution exposure.93 Two sub-indicators analysed the annual average PM2.5 concentrations in all major Australian cities and estimated the number of premature deaths in 2015 due to exposure to anthropogenic (human-made) sources of PM2.5 across Australia. Because of data limitations, it was not possible to decompose the anthropogenic PM2.5 into sector-specific pollution.
3.5.1 Exposure to air pollution in cities
This indicator uses information on annual average background concentrations of PM2.5 in typical urban settings. PM2.5 data were collected from the environmental management government agencies in each state and territory. Annual average concentrations were calculated for all monitoring sites within 50 km of the centre of all major Australian cities (defined as urban areas with greater than 100 000 population in 2016). In all major Australian cities, the annual average PM2.5 concentrations were below the WHO annual guideline of 10 μg/m3 and the Australian advisory reporting standard of 8 μg/m3. PM2.5 pollution concentrations in these cities have generally remained stable over the past few years.
3.5.2 Premature mortality from ambient air pollution by sector
Long term exposure to PM2.5 causes reduced life expectancy and death from cardiovascular and respiratory conditions. Around 2900 premature deaths in 2015 were caused by exposure to all anthropogenic sources of PM2.5 air pollution in Australia (Box 12), with more than 40% of these occurring in Sydney and Melbourne (based on our analysis of data from the Australian Bureau of Statistics, van Donkelaar and colleagues94 and the WHO95). We consider this to be an underestimate of the actual health burden caused by air pollution. The air pollution exposure model that we used tends to underestimate PM2.5 concentrations compared with government agency monitoring sites. Air pollution is also associated with a broad range of other health impacts apart from mortality, including increased hospitalisation, visits to a general practitioner and medication usage. Long term measures to reduce greenhouse gas emissions and minimise the impacts of climate change will also have a range of short term co-benefits including reducing urban air pollution and the associated burden of disease.
3.6 Clean fuel use for transport
The uptake of electric vehicles (EVs) in Australia has been relatively slow compared with international standards, facing barriers such as high purchase costs and poor perceptions of charging infrastructure.96 The highest proportion of new vehicle sales in Australia which were electric was found in the ACT, where EVs comprised 0.18% of new vehicle sales. The lowest proportion was sold in WA, where they comprised only 0.03% of new sales. Overall, only 0.07% of new cars sold in Australia in 2016 were EVs. In comparison, six countries achieved an EV market share above 1% of their total car sale in 2016: Norway (29.0%), Netherlands (6.4%), Sweden (3.4%) and China, France and the UK (each about 1.5%).97
3.7 Sustainable travel infrastructure and uptake
This indicator comprises household travel data for the capital city of each Australian state and territory. The data were sourced from the Australian Bureau of Infrastructure, Transport and Regional Economics, which provides research to the Australian Government Department of Infrastructure, Regional Development and Cities. Per capita, Canberra had the highest number of kilometres travelled in all modes of transport, as well as the highest number of kilometres travelled in private modes. Hobart, however, was found to have the greatest share of passenger kilometres travelled in private modes (96%). Sydney, Australia’s most populous city, had the lowest share of passenger kilometres associated with private transport (86%).
In terms of share models for transportation, compared with other global major cities, Australian cities have a very high proportion of private car driving, almost 70% of trips for Sydney and almost 80% of trips for Melbourne.5,98 More strategies should be taken to promote active transportation in Australia, as a co-benefit analysis in Adelaide shows that shifting 40% of vehicle kilometres travelled by passenger vehicles to active transport could achieve a significant reduction in annual average urban PM2.5 levels, with associated net health benefits owing to improved air quality and increased physical activity.99
3.8 Ruminant meat for human consumption
We selected specific input–output sectors pertaining to the production of beef cattle for meat and traced the supply chains of those sectors using consumption-based input–output analysis.100 Our assessment takes into account all individual supply chains that are required for the production of beef cattle for meat. These upstream supply chains are vast; their inclusion in the assessment therefore ensures that all environmental impacts are taken into account.101 Our supply chain assessment indicates that electricity supply, road freight and water supply are key inputs responsible for the large greenhouse gas footprint of the beef cattle sector. This assessment, however, does not account for different production systems, weights of livestock carcasses and weather patterns, as greenhouse gas emissions vary across these factors.
3.9 Health care sector emissions
This indicator involves assessing the carbon footprint of 15 selected sectors that make up Australia’s health care system. To this end, a comprehensive input–output database for Australia’s economy was coupled with data on CO2-equivalent emissions and expenditure data on Australian health care, to analyse the supply chain CO2-equivalent emissions for the health care sectors. This integration, commonly known as hybrid life cycle assessment, allowed for the quantification of CO2-equivalent emissions in all upstream supply chains that provide inputs to the health care system. Results show that public and private hospitals make up almost half of the total CO2-equivalent emissions (35.8 Mt) of the health care sector. Of the eight Australian states/territories assessed, NSW has the largest health care expenditure, hence the largest CO2-equivalent footprint, followed by Victoria and Queensland. These three Australian states contribute to about 75% of Australian total health care CO2-equivalent emissions. Overall, Australia’s health care sector is responsible for 7% of total emissions. In comparison, health care sectors in the UK and US account for about 3% and 10% of total emissions, respectively.
3.10 Soil organic carbon
Soil organic carbon (the amount of carbon stored in the soil) is a component of plant and animal materials in the soil that are in various stages of decay. Soil carbon can be a significant source or sink for greenhouse gases.102,103 Management of soil carbon is also central to maintaining soil health and ensuring global food security.104
In Australia, soil carbon levels have dropped by up to half of pre-agricultural levels in many areas because of activities such as fallowing, cultivation, stubble burning or removal, and overgrazing. Although there is a limit on the amount of organic carbon that can be stored in soils, the large losses in the past mean that many of Australia’s agricultural soils have the potential for a substantial increase in soil organic carbon.105
Management and monitoring of soil carbon is a matter of national and international importance.104 The Soil Carbon Research Program,106 to date the largest and most extensive soil sampling and analysis program undertaken in Australia to measure stocks of soil carbon, concluded in 2012.
Conclusion: mitigation actions and health co-benefits
The indicators in this section show that Australia still has a very high carbon-intensive energy system, and has been slow to transition to renewable and low carbon generation in comparison to other developed countries such as Germany and the UK. The Australian Government has proposed to cut emissions by 26–28% on 2005 levels by 2030. Some state governments also set their own target for mitigation. For example, NSW, Australia’s largest economy, has set a goal of net zero carbon by 2050 and allocated $500 million over 5 years to help shift to renewable energy. However, challenges lie ahead. Australia has a substantial agricultural sector, meaning that there are significant agricultural emissions and decreases in soil organic carbon due to cultivation, meat production and overgrazing. Given the international paradigm shift in energy policies leading to the increased uptake and cost-competitiveness of renewable energy,107 there is a strong case for Australia to invest in the transition towards cleaner energy, transportation and agricultural solutions. As well as longer term climate benefits, this will have substantial short term co-benefits such as reduced ground level air pollution.
Section 4: Economics and finance
This section focuses on the economic and financial mechanisms that have been implemented to protect human health from the impacts of climatic change. As noted in the 2008 Garnaut climate change review,74 Australia has a significant interest in adopting a strong and effective position on climate change mitigation, driven by the country’s high sensitivity to climate change and its opportunity to do well in a world of effective global mitigation. A major focus has been the reduction of greenhouse gas emissions and the transformation of the electricity sector from predominantly fossil fuel generation to a higher share of renewables.
4.1 Investments in zero carbon energy and energy efficiency
The indicator reports the investment in renewable zero carbon energy based on actually installed generation capacity. Between 2012 and March 2017, about 2000 MW of plant capacity was added to the Australian National Electricity Market (NEM). Of this additional capacity, 92% was in renewables with a share of 80% wind and 12% solar.108 A further 125 MW of solar capacity and over 600 MW of wind capacity were committed in March 2017, while an additional 20 000 MW of generation proposals (62% wind, 25% gas, 11% solar, 1% water, 1% biomass) were classified as being at an advanced state, although not yet formally committed.109 Box 13 illustrates the significant increase in new wind generation capacity since the financial year 2005–06 for the NEM.
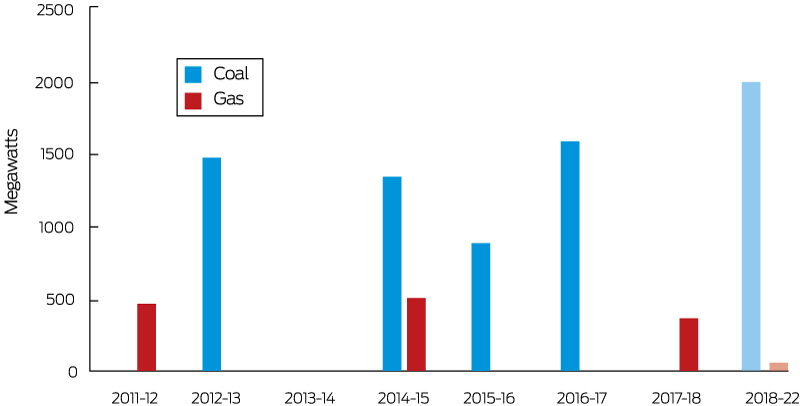
4.2 Investment in coal capacity
This indicator reports the investment in coal capacity between December 1998 and March 2017. Over this period, new investment added over 15 200 MW of registered generation capacity in the NEM, while almost 5500 MW of capacity was withdrawn. As illustrated in Box 13, for the period 1999–2008, there was typically a significant investment in coal-fired generation, adding over 600 MW in 2000–01, over 800 MW of capacity in 2001–02 and 2002–03, while another additional 750 MW was added in 2006–07. From 2008 onward, a flattening of electricity demand in combination with increased incentives to invest in renewable plants led to an oversupply of generation capacity for several years. As a response, a significant share of coal-fired capacity was removed from the market. Therefore, since 2009–10, investment in coal capacity has decreased substantially, and for most years, coal-fired generation has been removed from the market.
4.3 Funds divested from fossil fuels
Fossil fuel divestment aims to encourage institutions and investors to divest themselves of assets involved in the extraction of fossil fuels and generation of energy from fossil fuels. Several organisations have made binding commitments to divest from coal companies, while others have agreed to avoid any investment in fossil fuel companies. We provide two indicators for Australia tracking the divestment from fossil fuels. The first indicator is the number of companies and government organisations that have partially or entirely committed to divest from fossil fuels. According to a 2016 report,110 Australia has the most divestments per capita of any developed nation. Over 140 organisations including pension funds, local governments, universities and corporations have committed to divest from fossil fuel companies.
The other indicator is the number of historical and announced withdrawals of coal- and gas-fired power plants (ie, divestment from fossil fuel electricity generation) (Box 14). Between 2011 and 2022, over 8700 MW of fossil fuel fired capacity has been withdrawn or has been announced to be retired. This corresponds to about 19.3% of the total generation capacity in the NEM for the financial year 2017–18.
4.4 Economic losses due to climate-related extreme events
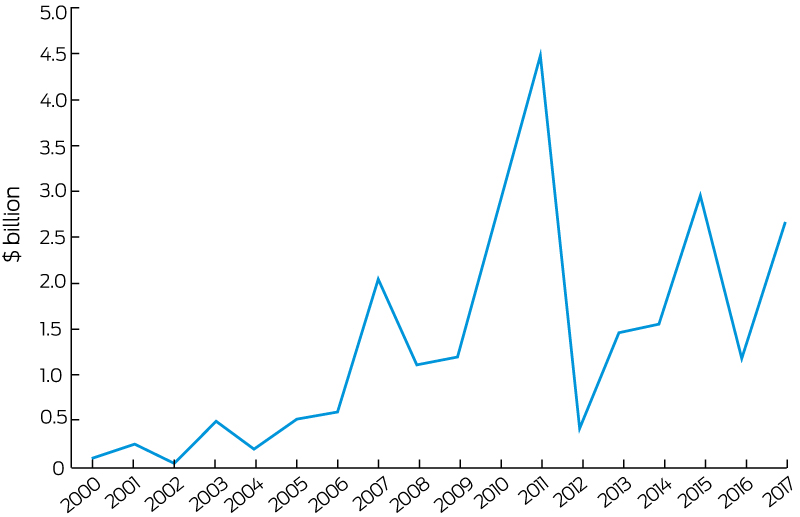
Climate change is expected to increase both the frequency and severity of natural hazards such as tropical storms, droughts, bushfires and flooding across the world. Australia is unusual in the sense that each of these hazards can be responsible for a probable maximum loss event that may cause significant damage to the community. Further, as suggested by several studies (eg, Garnaut,76 Hasson et al,111 and Murphy and Timbal112), various regions in Australia may be prone to increased flooding or storm and bushfire activities in the future. The indicator provided tracks the total insured economic losses from disaster events and is based on numbers provided by the Insurance Council of Australia. Box 15 shows the cumulative annual insured losses arising from bushfires, cyclones, flooding, hail storms and tornados. While the graph suggests an increasing trend, it is important to note that cumulative annual losses are often driven by a single or a small number of extreme events. For example, in 2011, over 60% of insured losses can be attributed to the Brisbane floods and Cyclone Yasi, while in 2017, about 65% of the losses were a result of Cyclone Debbie. The average annual loss over the 2000–2017 period was $1.33 billion, while over the past 5 years this figure has increased to $1.96 billion.
4.5 Employment in low carbon and high carbon industries
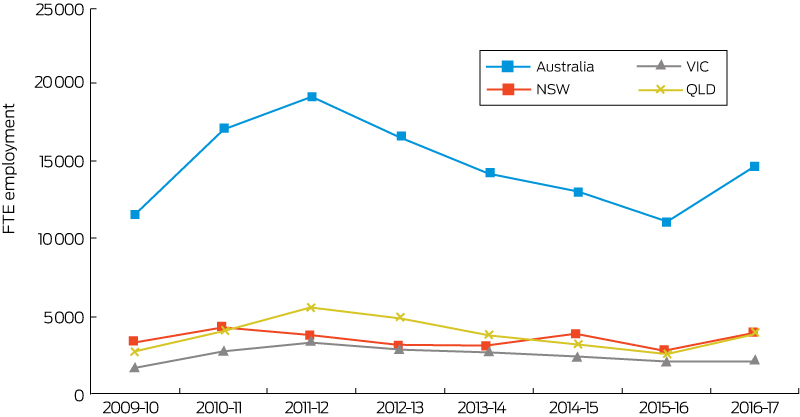
This indicator shows that direct full-time equivalent (FTE) employment in renewable energy activities in Australia was about 11 150 people in 2015–16. As illustrated by Box 16, after an original boost for the period between 2009 and 2012, recent employment numbers have been declining. The 2015–16 figures suggest a decrease in direct full-time employment of 2150 FTE (− 16%) from the previous year (2014–15) and a decline of 8070 FTE (− 42%) from a peak of 19 220 in 2011–12. A similar trend can also be observed for the three most populous states (NSW, Queensland and Victoria). The decline can be mainly explained by the decrease in the number of new rooftop solar photovoltaic system installations (over 60% decrease between 2011–12 and 2015–16).114
4.6 Fossil fuel subsidies
Fossil fuel subsidies can provide an indicator of a government’s support (or lack of) for fossil fuel energy sources. There is increasing understanding of the need to reduce fossil fuel subsidisation as a tactic for reducing global carbon emissions;115,116 however, there is a lack of comprehensive data for Australian subsidisation amounts. The data included here are an estimated sum of subsidies exclusively for energy production, which amounts to $63 million — 2.1% of total electricity generation subsidies.
4.7 Coverage and strength of carbon pricing
Despite NSW having one of the world’s first mandatory emissions trading schemes (beginning in 2003 and lasting just under a decade), Australia currently has no national or state-based carbon price.117 In 2007, the then Liberal Prime Minister, John Howard, floated the idea of a national emissions trading scheme. It was not successful. Two subsequent prime ministers lost their positions, at least in part, due to their positions on trying to implement an emissions trading scheme. In Australia, the introduction of climate change policy, such as a carbon price, is highly politicised.
The Clean Energy Act 2011, introduced by the Labor government under Julia Gillard, began in July 2012 and included an emissions trading scheme with a fixed price for all large emitters of $23–24 per tonne.118 It was repealed 2 years later by the Tony Abbott-led Coalition government and replaced by the Emissions Reduction Fund, which was established to buy up to $2.55 billion in carbon credits from emissions abatement activity rather than actually force polluters to pay for their carbon emissions.119
4.8 Use of carbon pricing revenues
Australian Government Budget documents indicate that in the financial year 2012–2013, Australia’s carbon price provided a revenue of $6.5 billion, and $6.6 billion in the 2013–14 financial year.120,121 These revenue amounts are, however, highly contested, as many emissions-intensive, trade-exposed industries received their allocations for free, so the actual revenues were likely to be much lower.122 Revenue was spent on compensating low to middle income earners and large companies through free permits.123
As a consequence, it would be hard to identify any of this revenue that was used for mitigation, adaptation, environmental tax reform or other relevant general funds as suggested by this indicator. The current replacement, the Emissions Reduction Fund, which operates under the Direct Action suite of policies, pays companies for projects that cut the amount of greenhouse gases they create via an auction; hence they cannot really be seen to create revenue.
4.9 Spending on adaptation for health and health-related activities
As a leading organisation promoting and supporting climate change adaptation for health and health-related activities, the National Climate Change Adaptation Research Facility (NCCARF) was established in 2008 by the Australian Government Department of Environment and Energy, with $50 million over 5 years supporting around 100 projects and eight networks including a human health network. Over the period 2014–2017, NCCARF phase 2 received funding of $8.8 million, supporting four networks with one relevant to health: the adaptation network for vulnerable communities.124 In addition, the CSIRO Climate Adaptation Flagship also undertook climate change adaptation research relevant to human health. Since 2017, the NSW Office of Environment and Heritage and the NSW Ministry of Health have provided financial support for the human health and social impacts research node of the NSW Adaptation Research Hub hosted by the University of Sydney. Further, several cooperative research centres (CRCs) — such as the Bushfire and Natural Hazard CRC, CRC for Mental Health, Smart Services CRC, Young and Well CRC, and CRC for Aboriginal and Torres Strait Islanders Health — also performed health-related activities to respond to climate change.
4.10 Health adaptation funding from Australian climate financing mechanisms
There have been no continuing climate financing mechanisms in Australia to fund relevant health research and adaptation activities. Australian researchers undertake their research activities via very competitive and limited funding from traditional funding organisations such as the Australian Research Council and the National Health and Medical Research Council (NHMRC). For example, no NHMRC Centres of Research Excellence for climate change and health have yet been established.
Conclusion: economics and finance
The indicators presented in this section seek to highlight mechanisms related to the impacts of climate change on health from an economic and financial perspective. They focus on investment in zero carbon energy, divestment from fossil fuels, losses due to climate-related extreme events, economic benefits of tackling climate change, carbon pricing, and funding adaptation for health and health-related activities. The indicators show evidence of the beginning of a transition from fossil fuels to significantly more renewable energy in the Australian economy. At the same time, they suggest that carbon pricing revenues have typically not been spent on climate mitigation, adaptation or health-related activities.
Section 5: Public and political engagement
Because achieving policy action on health and climate change in Australia will depend on community support and political will,5 the indicators in this section were chosen to measure public and political engagement. The indicators track media coverage and parliamentary activity on health and climate change over the period 2008–2017, and identify trends relevant to public and political engagement.
5.1 Media coverage of health and climate change
It is evident that the media play an important role in framing information for climate change debate, disseminating research findings to the public and enabling appropriate responses by individuals and communities.125 Two sub-indicators analysed the coverage of climate change and health from Australian major newspaper sources, aiming to understand what kind of information has been provided and whether or not Australian audiences are receiving sufficient information to enable them to take actions to reduce associated risks.
5.1.1 Australian newspaper reporting on health and climate change
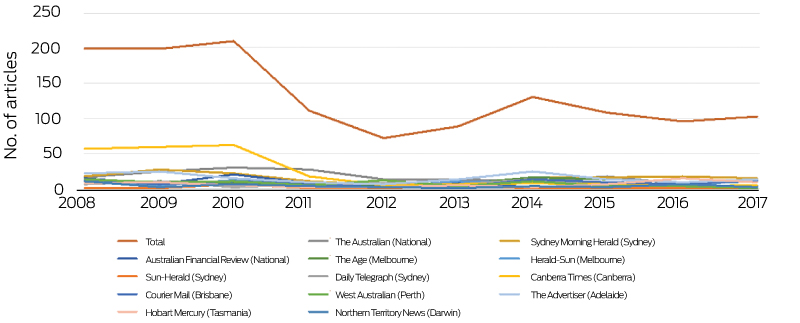
This indicator tracks nationwide coverage of health and climate change in high circulation English-language newspapers from 2008 to 2017. Using the Factiva (Dow Jones) global news database, 13 national and regional newspapers from all major cities were included in the analysis, with time trends providing a national indicator of Australian community exposure to news coverage of health and climate change. Search key words, and regional disaggregation, are detailed in the Appendix.
During the past 10 years, annual Australian newspaper coverage of health and climate change decreased by 50% from a high of about 200 articles per year in 2008–2010, with some rebound in 2014 coinciding with the G20 meeting in Brisbane and the extreme heat events during that summer (Box 17). This fall in coverage substantially resulted from reduced coverage in The Australian and the Canberra Times, while the annual number of articles almost doubled in The Age (Melbourne) and the Daily Telegraph (Sydney). Over the same period, global newspaper reporting of health and climate change increased significantly (Box 18).
5.1.2 In-depth analysis of newspaper coverage on health and climate change
The second part of this indicator provides a qualitative analysis of all the included articles published between 2015 and 2017. The overall contextual focuses of the articles included scientific announcement (20%), Australian or international events (19%), extreme climate event (17%), economic/business case (13%), health crisis (9%), agricultural/environmental crisis (7%), and undefined (14%). While the national newspapers focused more on economic and business cases, local sources highlighted scientific publications and extreme climate events. There was a clear lack of recommendations in the articles, with more than half (53%) not providing any recommendations for responding. For the newspapers that did provide recommendations, emphasis on mitigation or adaptation varied across the sources. The lack of communication on co-benefits (4%) could be an obstacle in promoting action on climate change.126 Although most articles had a neutral tone, more negative messages were expressed in some sources (Appendix, Table A14). This indicator suggests that Australian newspapers should provide recommendations for both adaptation and mitigation with a positive perspective, to recognise not only the risks but also the opportunities in dealing with health and climate change.
5.2 Health and climate change in scientific journals
A total of 288 Australia-related climate change and human health articles meeting database search criteria were published during 2008–2017. Publications grew rapidly and peaked with 79 papers published in 2014, and almost 50% of those characterised the climate change–health relationship (Appendix, Figure A11). In contrast to global efforts, the Australian publication record on climate change and human health has failed to maintain momentum, particularly since 2014 (Box 19). Research comprised 12% of total papers, and declined sharply after 2014, reflecting the hiatus in NHMRC funding of this field. Almost 17% of publications discussed the relationship between climatic events and health outcomes yet failed to mention climate change, a further 23% were commentaries, and 11% were reviews. The most prolific authors reported heat research9,10,127 and mental health research.27,39,40 The most cited article is that by Gasparrini and colleagues,127 with 237 citations as of May 2018.
5.3 Health and climate change in the Parliament of Australia
Australian parliamentary websites were searched for legislation, programs, statements, policy and speeches on climate change or human health. Those identified were then searched for an expanded set of search terms. No relevant bills were presented to parliament. A senate inquiry on extreme weather preparedness attracted interest in climate and health, with dozens of health sector submissions identifying critical gaps.
The Australian Government Department of Health website was also searched for programs, policies and statements on climate change. The National Environmental Health Strategy 2016–2020 included two paragraphs focused on climate change in its section on “challenges, threats and opportunities” with a supporting strategy, but listed only one current Environmental Health Standing Committee publication on climate change.128
Talberg and colleagues129 described Australia’s commitment to climate action over the past three decades as inconsistent and lacking in direction. During the time scale of this review, Australia moved from being a leader in reducing greenhouse gas emissions to abolishing government agencies dedicated to climate change mitigation and adaptation. Amid this change of policy direction, human health has remained absent in policy debates at the Australian Government level.
Since 2007, Australia’s response to climate change has featured prominently in national elections, with close scrutiny given to party policies. Arguably, several national political leaders have lost their position at least in part because of their policies on climate change (including Malcolm Turnbull as Leader of the Opposition in 2009, Prime Minister Kevin Rudd in 2010, Prime Minister Julia Gillard in 2013, and Prime Minister Malcolm Turnbull in 2018).
Conclusion: public and political engagement
The 50% decline in media stories about health and climate change in Australia during the period 2008–2017 is in striking contrast to the increase of 78% in newspaper coverage worldwide during the period 2007–2017.5 This means that many Australian people may be missing out on information that is readily accessible in other parts of the world. Relatedly, there has been an absence of political engagement with health and climate change in Australia during the same period. The national consultation for a National Strategy on Climate, Health and Well-being for Australia published by the Climate and Health Alliance130 has attracted the attention of all three major parties and, in the years ahead, could provide a foundation for broader national political engagement.
Conclusion: the Australian Countdown in 2018
Australia is vulnerable to the impacts of climate change on health, and policy inaction in this regard threatens Australian lives. Across a number of the indicators examined here, Australia has gone backwards and now lags behind other high income countries such as Germany and the UK. Prime examples of this include the persistence of a very high carbon-intensive energy system in Australia, and its slow transition to renewables and low carbon electricity generation. However, we also find some examples of good progress, such as heatwave forecast services and response planning. Given the overall poor state of progress on climate change and health in Australia, this country now has an enormous opportunity to take action and protect human health and lives. Australia has the technical knowhow and intellect to do this, and our annual updates of this assessment, with ongoing refinement of our indicators, will track Australia’s engagement with and progress on this vitally important issue.
Box 1 – Indicators assessed for the MJA–Lancet Australia Countdown, including alignment with and differences in numbering and naming from the Lancet 20175 and Lancet 20188 indicators
|
Lancet 2017 indicators |
MJA–Lancet Australia 2018 indicators |
Lancet 2018 indicators |
|||||||||||||
|
|
|||||||||||||||
|
Section 1: Climate change impacts, exposures and vulnerability |
|||||||||||||||
|
na |
1.1 Vulnerability to the heat-related risks of climate change |
||||||||||||||
|
1.1 Health effects of temperature change |
1.2 Health effects of temperature change |
||||||||||||||
|
1.2 Health effects of heatwaves |
1.3 Health effects of heatwaves |
||||||||||||||
|
1.3 Change in labour capacity |
1.4 Change in labour capacity |
||||||||||||||
|
na |
1.5 Health effects of extremes of precipitation (flood and drought) |
||||||||||||||
|
1.4 Lethality of weather-related disasters |
1.6 Lethality of weather-related disasters |
||||||||||||||
|
1.5 Global health trends in climate-sensitive diseases |
1.5. Trends in overall burden of climate-sensitive diseases |
1.7 Global health trends in climate-sensitive diseases |
|||||||||||||
|
1.6 Climate-sensitive infectious diseases |
1.8 Climate-sensitive infectious diseases |
||||||||||||||
|
1.7 Food security and undernutrition |
1.7 Food insecurity and malnutrition |
1.9 Food security and under-nutrition |
|||||||||||||
|
1.7.1 Vulnerability to undernutrition |
1.7.1 Prevalence of food insecurity |
1.9.1 Terrestrial food security and under-nutrition |
|||||||||||||
|
1.7.2 Marine primary productivity |
1.7.2 Prevalence of malnutrition |
1.9.2 Marine food security and under-nutrition |
|||||||||||||
|
1.8. Migration and population displacement |
1.10 Migration and population displacement |
||||||||||||||
|
na |
1.9 Mental health |
na |
|||||||||||||
|
Section 2: Adaptation planning and resilience for health |
|||||||||||||||
|
2.1 National adaptation plans for health |
2.1 Australian adaptation plans for health |
2.1 National adaptation plans for health |
|||||||||||||
|
2.2 City level climate change risk assessments |
|||||||||||||||
|
2.3 Detection and early warning of, preparedness for and response to health emergencies |
2.3 Detection, preparedness and response to health emergencies |
||||||||||||||
|
na |
2.4 Climate change adaptation to vulnerabilities from mosquito-borne diseases |
||||||||||||||
|
2.4 Climate information services for health |
2.5 Climate information services for health |
||||||||||||||
|
2.5 National assessment of vulnerability, impacts and adaptation for health |
2.6 National assessments of climate change impacts, vulnerability and adaptation for health |
||||||||||||||
|
2.6 Climate-resilient health infrastructure |
na |
||||||||||||||
|
See 4.9 |
2.7 Spending on adaptation for health and health-related activities |
||||||||||||||
|
See 4.10 |
2.8 Health adaptation funding from global climate financing mechanisms |
||||||||||||||
|
Section 3: Mitigation actions and health co-benefits |
|||||||||||||||
|
3.1 Carbon intensity of the energy system |
|||||||||||||||
|
3.2 Coal phase-out |
|||||||||||||||
|
3.3 Zero carbon emission electricity |
|||||||||||||||
|
3.4. Access to clean energy |
|||||||||||||||
|
3.5 Exposure to ambient air pollution |
|||||||||||||||
|
3.5.1 Exposure to air pollution in cities |
|||||||||||||||
|
3.5.2 Sectoral contributions to air pollution |
na |
||||||||||||||
|
3.5.3 Premature mortality from ambient air pollution by sector |
3.5.2 Premature mortality from ambient air pollution by sector |
||||||||||||||
|
3.6 Clean fuel use for transport |
|||||||||||||||
|
3.7 Sustainable travel infrastructure and uptake |
|||||||||||||||
|
3.8 Ruminant meat for human consumption |
|||||||||||||||
|
3.9 Health care sector emissions |
|||||||||||||||
|
na |
3.10 Soil organic carbon |
na |
|||||||||||||
|
Section 4: Economics and finance |
|||||||||||||||
|
See 4.4 |
4.1 Economic losses due to climate-related extreme events |
||||||||||||||
|
4.1 Investments in zero carbon energy and energy efficiency |
4.2 Investments in zero carbon energy and energy efficiency |
||||||||||||||
|
4.2 Investment in coal capacity |
4.3 Investment in new coal capacity |
||||||||||||||
|
See 4.5 |
4.4 Employment in low carbon and high carbon industries |
||||||||||||||
|
4.3 Funds divested from fossil fuels |
4.5 Funds divested from fossil fuels |
||||||||||||||
|
4.4 Economic losses due to climate-related extreme events |
See 4.1 |
||||||||||||||
|
4.5 Employment in low carbon and high carbon industries |
See 4.4 |
||||||||||||||
|
4.6 Fossil fuel subsidies |
|||||||||||||||
|
4.7 Coverage and strength of carbon pricing |
|||||||||||||||
|
4.8 Use of carbon pricing revenues |
|||||||||||||||
|
4.9 Spending on adaptation for health and health-related activities |
See 2.7 |
||||||||||||||
|
4.10 Health adaptation funding from global climate financing mechanisms |
4.10 Health adaptation funding from Australian climate financing mechanisms |
See 2.8 |
|||||||||||||
|
Section 5: Public and political engagement |
|||||||||||||||
|
5.1 Media coverage of health and climate change |
|||||||||||||||
|
5.1.1 Global newspaper reporting on health and climate change |
5.1.1 Australian newspaper reporting on health and climate change |
na |
|||||||||||||
|
5.1.2 In-depth analysis of newspaper coverage on health and climate change |
na |
||||||||||||||
|
5.2 Health and climate change in scientific journals |
5.2 Coverage of health and climate change in scientific journals |
||||||||||||||
|
5.3 Health and climate change in the United Nations General Assembly |
5.3 Health and climate change in the Parliament of Australia |
5.3 Engagement in health and climate change in the United Nations General Assembly |
|||||||||||||
|
na |
5.4 Engagement in health and climate change in the corporate sector |
||||||||||||||
|
|
|||||||||||||||
|
na = not applicable. |
|||||||||||||||
Box 2 – Mean summer warming relative to the 1986–2008 average temperature for Brisbane, Sydney and Melbourne
Box 3 – The association between heatwaves and non-accidental mortality in Brisbane, Sydney and Melbourne, 1988–2009
Box 4 – Change in length of heatwaves in Brisbane, Sydney and Melbourne, relative to the 1986–2008 average heatwave days
Box 6 – Aedes aegypti vectorial capacity averaged yearly for Australia (and Israel and Panama for comparison), 1950–2050, under two representative concentration pathways (RCPs): 2.6 (A) and 8.5 (B)
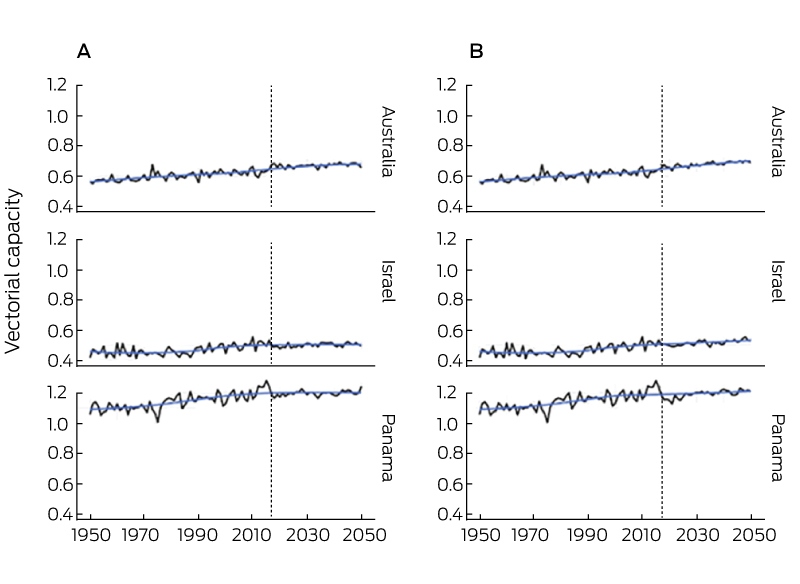
RCPs are plausible descriptions of how the future may develop, including emissions and atmospheric concentrations of greenhouse gases, based on assumptions about key driving forces (eg, rate of technological change, prices) and relationships. The RCP number indicates the climate change forcing of the scenario, with 2.6 being the lowest and 8.5 being the highest.
Box 7 – Average monthly Aedes aegypti vectorial capacity for Australia (and Israel and Panama for comparison), 1950–2050, under two representative concentration pathways (RCPs): 2.6 (A) and 8.5 (B)
Box 8 – Association between mean annual maximum temperature and suicide rate, by sex, in warmer (A) and cooler (B) Australian states and territories, 2007–2016
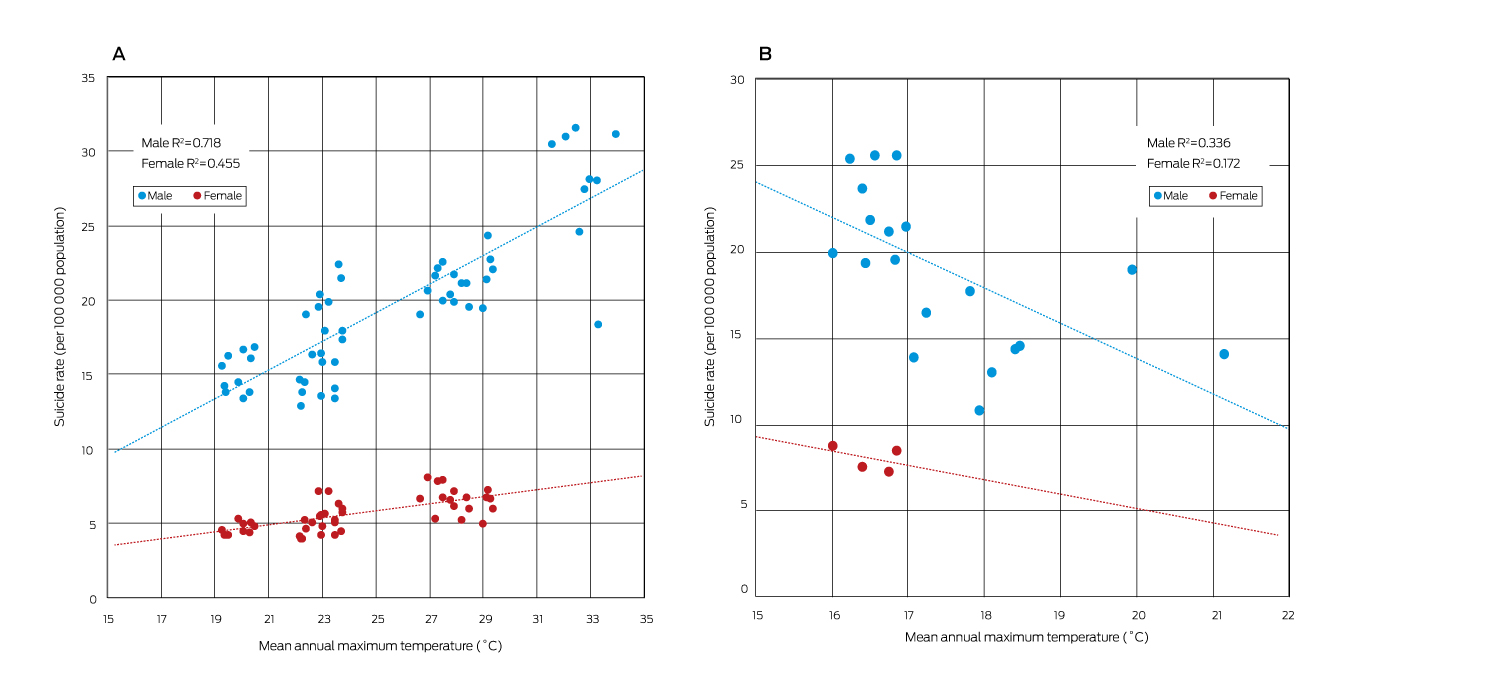
A: New South Wales, Victoria, Queensland, Western Australia, South Australia and Northern Territory. B: Tasmania and Australian Capital Territory.
Box 9 – Carbon intensity of total primary energy supply for Australia, selected countries and the world, and corresponding total carbon dioxide (CO2) emissions, 1971–2012
Box 10 – Share of electricity generation from renewable sources in Australia, Germany, the United Kingdom and the United States, and the Organisation for Economic Co-operation and Development (OECD) total, 1990–2015
Box 11 – Share of electricity generation from low carbon sources in Australia, Germany, the United Kingdom and the United States, and the Organisation for Economic Co-operation and Development (OECD) total, 1990–2015
Box 12 – Premature deaths from anthropogenic PM2.5 in Australian state and territory capital cities, and in the rest of each state and territory, 2015
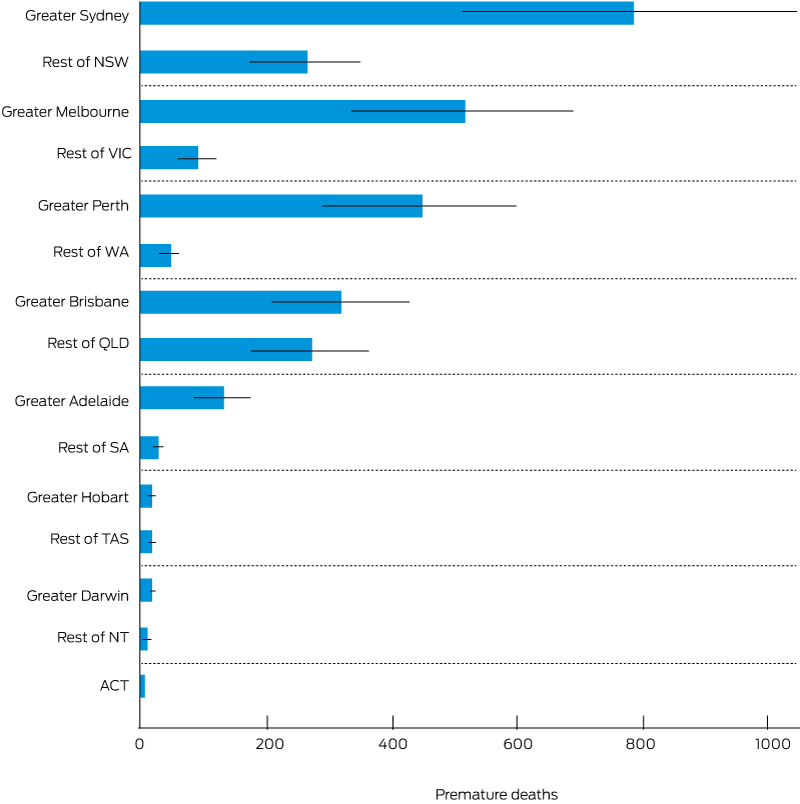
Thin lines are confidence intervals, which represent the statistical imprecision in the concentration-response function. There are a number of other uncertainties that must be considered. Generally, we have used parameters that are more likely to lead to underprediction of exposure and health impacts.
Box 13 – Investment in new generation and plant retirement for the Australian National Electricity Market for different fuel sources (coal, gas, wind and other) for financial years 1999–2000 to 2015–2016
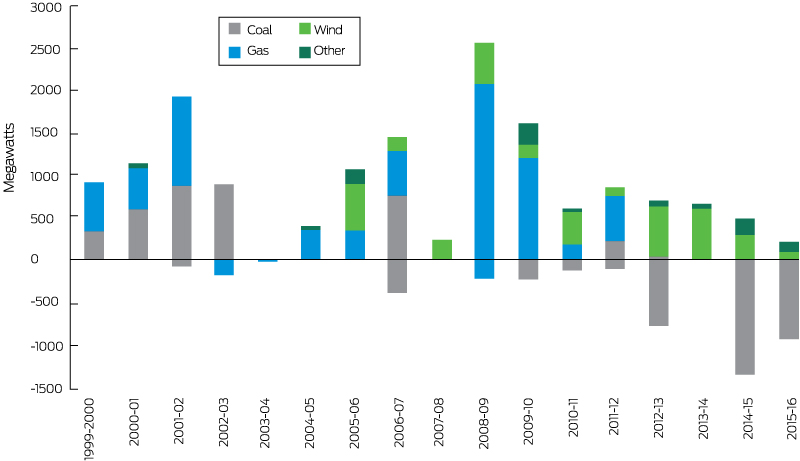
Source: Australian Energy Market Operator;109 Australian Energy Regulator.108
Box 14 – Fossil fuel energy generation withdrawals in Australia, 2011–2022
The figure reports retirements and withdrawals of coal- and gas-fired power plants. Gas-fired power plants include combined cycle gas turbines and open cycle gas turbines that have been retired, placed into cold storage or mothballed. The figures for the years 2018–2022 refer to announced withdrawals. For comparison, the average total generation capacity in the National Electricity Market between 2011 and 2018 was approximately 45 000 MW. Source: Australian Energy Regulator.108
Box 15 – Annual total insured economic losses (nominal) in Australia from bushfires, cyclones, flooding, hailstorms, storm flooding and tornados*
* Based on data from the Insurance Council of Australia Catastrophe Database: http://www.icadataglobe.com/access-catastrophe-data/.
Box 16 – Annual direct full-time equivalent (FTE) employment in renewable energy activities for Australia, New South Wales, Queensland and Victoria
Source: Australian Bureau of Statistics.113
Box 17 – Annual number of articles reporting on health and climate change in 13 Australian newspapers, 2008–2017
Box 18 – Total Australian and global newspaper reporting on health and climate change, 2008–2017
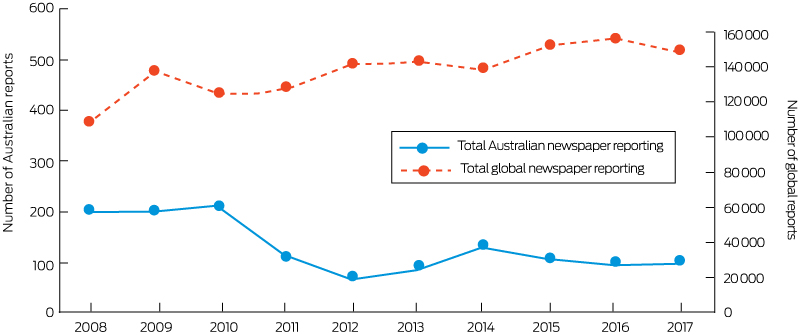
The number of global newspaper reports is based on data from Watts et al,5 including 18 newspapers across the world (but only two Australian newspapers). The number of Australian newspaper reports is based on 13 newspapers in the country.
Box 19 – Total Australian and global scientific publications on health and climate change, 2008–2017
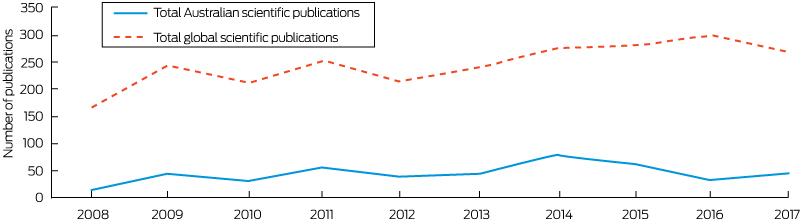
The number of global scientific publications is based on data from Watts et al5 using similar search methods.
Provenance: Not commissioned; externally peer reviewed.
- Ying Zhang1
- Paul J Beggs2
- Hilary Bambrick3
- Helen L Berry1
- Martina K Linnenluecke4
- Stefan Trueck4
- Robyn Alders5,6
- Peng Bi7
- Sinead M Boylan1
- Donna Green8
- Yuming Guo9
- Ivan C Hanigan10
- Elizabeth G Hanna11
- Arunima Malik12
- Geoffrey G Morgan13
- Mark Stevenson14
- Shilu Tong15,16
- Nick Watts17
- Anthony G Capon1
- 1 School of Public Health, University of Sydney, Sydney, NSW
- 2 Department of Environmental Sciences, Macquarie University, Sydney, NSW
- 3 School of Public Health and Social Work, Queensland University of Technology, Brisbane, QLD
- 4 Department of Applied Finance, Macquarie University, Sydney, NSW
- 5 International Rural Poultry Centre, Kyeema Foundation, Brisbane, QLD
- 6 Centre for Global Health Security, Chatham House, London, UK
- 7 School of Public Health, University of Adelaide, Adelaide, SA
- 8 Climate Change Research Centre, ARC Centre of Excellence for Climate Extremes, University of New South Wales, Sydney, NSW
- 9 Department of Epidemiology and Preventive Medicine, Monash University, Melbourne, VIC
- 10 University Centre for Rural Health, University of Sydney, Sydney, NSW
- 11 Climate Change Institute, Australian National University, Canberra, ACT
- 12 School of Physics, University of Sydney, Sydney, NSW
- 13 University Centre for Rural Health, University of Sydney, Lismore, NSW
- 14 Melbourne School of Population and Global Health, University of Melbourne, Melbourne, VIC
- 15 Department of Clinical Epidemiology and Biostatistics, Shanghai Jiao Tong University, Shanghai, China
- 16 Institute of Environment and Population Health, Anhui Medical University, Hefei, China
- 17 Institute of Global Health, University College London, London, UK
We thank Dr Elizabeth Ebert (Australian Bureau of Meteorology) for contributing indicator 2.4 (Climate information services for health). We also thank Dr Luke Knibbs (University of Queensland) who provided assistance with the PM monitor data for indicator 3.5.1 (Exposure to air pollution in cities). Indicator 3.9 (Health care sector emissions) builds on Malik et al ( 2018; 2: e27–e35) and we would like to acknowledge the co-authors of that publication: Prof Manfred Lenzen, Dr Forbes McGain and Scott McAlister. We would also like to acknowledge Fabiola Barba Ponce (Macquarie University).
Anthony Capon directs the human health and social impacts research node of the NSW Adaptation Research Hub.
- 1. Thien F, Beggs PJ, Csutoros D, et al. The Melbourne epidemic thunderstorm asthma event 2016: an investigation of environmental triggers, effect on health services, and patient risk factors. Lancet Planet Health 2018; 2: e255-e263.
- 2. Hanna EG, McIver LJ. Climate change: a brief overview of the science and health impacts for Australia. Med J Aust 2018; 208: 311-315. <MJA full text>
- 3. Costello A, Abbas M, Allen A, et al. Managing the health effects of climate change: Lancet and University College London Institute for Global Health Commission. Lancet 2009; 373: 1693-1733.
- 4. Watts N, Adger WN, Agnolucci P, et al. Health and climate change: policy responses to protect public health. Lancet 2015; 386: 1861-1914.
- 5. Watts N, Amann M, Ayeb-Karlsson S, et al. The Lancet Countdown on health and climate change: from 25 years of inaction to a global transformation for public health. Lancet 2018; 391: 581-630.
- 6. United Nations Framework Convention on Climate Change. The Paris Agreement. Bonn: UNFCCC, 2018. https://unfccc.int/process-and-meetings/the-paris-agreement/the-paris-agreement (viewed June 2018).
- 7. Zhang Y, Beggs PJ. The Lancet Countdown down under: tracking progress on health and climate change in Australia. Med J Aust 2018; 208: 285-286. <MJA full text>
- 8. Watts N, Amann M, Arnell N, et al. The 2018 report of the Lancet Countdown on health and climate change: shaping the health of nations for centuries to come. Lancet 2018; doi: 10.1016/S0140-6736(18)32594-7.
- 9. Guo Y, Li S, Liu DL, et al. Projecting future temperature-related mortality in three largest Australian cities. Environ Pollut 2016; 208: 66-73.
- 10. Xiang J, Bi P, Pisaniello D, Hansen A. The impact of heatwaves on workers’ health and safety in Adelaide, South Australia. Environ Res 2014; 133: 90-95.
- 11. Zander KK, Botzen WJW, Oppermann E, et al. Heat stress causes substantial labour productivity loss in Australia. Nat Clim Chang 2015; 5: 647-651.
- 12. Maloney SK, Forbes CF. What effect will a few degrees of climate change have on human heat balance? Implications for human activity. Int J Biometeorol 2011; 55: 147-160.
- 13. Kar-Purkayastha I, Clarke M, Murray V. Dealing with disaster databases – what can we learn from health and systematic reviews? PLoS Currents Disasters 2011; 3: RRN1272. doi: 10.1371/currents.RRN1272.
- 14. Blanchi R, Leonard J, Haynes K, et al. Environmental circumstances surrounding bushfire fatalities in Australia 1901-2011. Environ Sci Policy 2014; 37: 192-203.
- 15. Bi P, Hiller JE, Cameron AS, et al. Climate variability and Ross River virus infections in Riverland, South Australia, 1992-2004. Epidemiol Infect 2009; 137: 1486-1493.
- 16. Tong S, Bi P, Donald K, McMichael AJ. Climate variability and Ross River virus transmission. J Epidemiol Community Health 2002; 56: 617-621.
- 17. Tong S, Dale P, Nicholls N, et al. Climate variability, social and environmental factors, and Ross River virus transmission: research development and future research needs. Environ Health Perspect 2008; 116: 1591-1597.
- 18. Bannister-Tyrrell M, Williams C, Ritchie SA, et al. Weather-driven variation in dengue activity in Australia examined using a process-based modeling approach. Am J Trop Med Hyg 2013; 88: 65-72.
- 19. D’Souza RM, Becker NG, Hall G, Moodie KBA. Does ambient temperature affect foodborne disease? Epidemiology 2004; 15: 86-92.
- 20. Milazzo A, Giles LC, Zhang Y, et al. Heatwaves differentially affect risk of Salmonella serotypes. J Infect 2016; 73: 231-240.
- 21. Milazzo A, Giles LC, Zhang Y, et al. The effects of ambient temperature and heatwaves on daily Campylobacter cases in Adelaide, Australia, 1990–2012. Epidemiol Infect 2017; 145: 2603-2610.
- 22. Lake IR, Hooper L, Abdelhamid A, et al. Climate change and food security: health impacts in developed countries. Environ Health Perspect 2012; 120: 1520-1526.
- 23. Hochman Z, Gobbett DL, Horan H. Climate trends account for stalled wheat yields in Australia since 1990. Glob Change Biol 2017; 23: 2071-2081.
- 24. Australian Bureau of Statistics. Australian Health Survey: Nutrition - State and Territory results, 2011-12 (ABS Cat. No. 4364.0.55.009). Canberra: ABS, 2015. http://www.abs.gov.au/ausstats/abs@.nsf/Lookup/4364.0.55.009main+features12011-12 (viewed June 2018).
- 25. Australian Bureau of Statistics. Australian Aboriginal and Torres Strait Islander Health Survey: Nutrition Results - Food and Nutrients, 2012–13. Canberra: ABS, 2015. http://www.abs.gov.au/AUSSTATS/abs@.nsf/DetailsPage/4727.0.55.0052012-13?OpenDocument (viewed June 2018).
- 26. Gallegos D, Booth S, Kleve S, et al. Food insecurity in Australian households: from charity to entitlement. In: Germov J, Williams L, editors. A sociology of food and nutrition: the social appetite. 4th ed. Melbourne: Oxford University Press, 2017: 55-74.
- 27. Friel S, Berry H, Dinh H, et al. The impact of drought on the association between food security and mental health in a nationally representative Australian sample. BMC Public Health 2014; 14: 1102.
- 28. Australian Bureau of Statistics. Media release: more than half of adults are overweight and the numbers are increasing: ABS. Canberra: ABS, 2008. http://www.abs.gov.au/ausstats/abs@.nsf/Latestproducts/4719.0Media%20Release12004-05?opendocument&tabname=Summary&prodno=4719.0&issue=2004-05&num=&view= (viewed June 2018).
- 29. Australian Bureau of Statistics. National Health Survey: First Results, 2014-15 (ABS Cat. No. 4364.0.55.001). Canberra: ABS, 2015. http://www.abs.gov.au/ausstats/abs@.nsf/mf/4364.0.55.001 (viewed June 2018).
- 30. Australian Bureau of Statistics. Consumption of Food Groups from the Australian Dietary Guidelines - a Comparison of 1995 to 2011-12 (ABS Cat. No. 4364.0.55.012). Canberra: ABS, 2017. http://www.abs.gov.au/ausstats/abs@.nsf/Lookup/by%20Subject/4364.0.55.012∼2011-12∼Main%20Features∼Consumption%20of%20Food%20Groups%20from%20the%20Australian%20Dietary%20Guidelines%20-%20a%20comparison%20of%201995%20to%202011-12∼10003 (viewed June 2018).
- 31. Quiggin J. Drought, climate change and food prices in Australia. 2007. https://d3n8a8pro7vhmx.cloudfront.net/auscon/pages/1345/attachments/original/1474000113/Climate_change_and_food_prices_in_Australia.pdf (viewed Oct 2018).
- 32. Myers SS, Zanobetti A, Kloog I, et al. Increasing CO2 threatens human nutrition. Nature 2014; 510: 139-142.
- 33. Dong J, Gruda N, Lam SK, et al. Effects of elevated CO2 on nutritional quality of vegetables: a review. Front Plant Sci 2018; 9: 924.
- 34. McMichael C. Climate change-related migration and infectious disease. Virulence 2015; 6: 548-553.
- 35. McMichael C, Barnett J, McMichael AJ. An ill wind? Climate change, migration, and health. Environ Health Perspect 2012; 120: 646-654.
- 36. Schwerdtle P, Bowen K, McMichael C. The health impacts of climate-related migration. BMC Med 2018; 16: 1.
- 37. Maxwell SL, Venter O, Jones KR, Watson JEM. Integrating human responses to climate change into conservation vulnerability assessments and adaptation planning. Ann N Y Acad Sci 2015; 1355: 98-116.
- 38. Tasmanian Government Department of Premier and Cabinet. Climate Action 21: Tasmania’s Climate Change Action Plan 2017–2021. Hobart: Tasmanian Climate Change Office, 2017. http://www.dpac.tas.gov.au/__data/assets/pdf_file/0015/332106/Climate_Action_21_Tasmanias_Climate_Action_Plan_20172021_June_2018.pdf (viewed June 2018).
- 39. Berry HL, Waite TD, Dear KBG, et al. The case for systems thinking about climate change and mental health. Nat Clim Chang 2018; 8: 282-290.
- 40. Ding N, Berry H, O’Brien L. The effect of extreme heat on mental health – evidence from Australia. Int J Epidemiol 2015; 44: i64.
- 41. Williams MN, Hill SR, Spicer J. Do hotter temperatures increase the incidence of self-harm hospitalisations? Psychol Health Med 2016; 21: 226-235.
- 42. ACT Government, Environment and Planning Directorate. ACT climate change adaptation strategy: living with a warming climate. Canberra: ACT, 2016. https://www.environment.act.gov.au/__data/assets/pdf_file/0004/912478/ACT-Climate-Change-Adaptation-Strategy.pdf (viewed June 2018).
- 43. Australian Government. National Climate Resilience and Adaptation Strategy. Canberra: Commonwealth of Australia, 2015. http://www.environment.gov.au/climate-change/adaptation/strategy (viewed June 2018).
- 44. Government of South Australia. Towards a resilient state: the South Australian Government’s climate change adaptation action plan. Adelaide: Government of South Australia, 2018.
- 45. New South Wales Office of Environment and Heritage, Local Government NSW. NSW Local Government progress and needs in adapting to climate change: Final report. 2015. http://climatechange.environment.nsw.gov.au/∼/media/9DA9CAA0C3F3478087B6C39BA88324C4.ashx (viewed June 2018).
- 46. Western Australian Government Department of Environment and Conservation. Adapting to our changing climate. 2012. https://www.der.wa.gov.au/images/documents/your-environment/climate-change/adapting-to-our-changing-climate-october-2012.pdf (viewed June 2018).
- 47. Victorian Government. Victoria’s Climate Change Adaptation Plan: 2017–2020. Melbourne: State of Victoria, Department of Environment, Land, Water and Planning, 2016. https://www.climatechange.vic.gov.au/__data/assets/pdf_file/0024/60729/Victorias-Climate-Change-Adaptation-Plan-2017-2020.pdf (viewed June 2018).
- 48. Armstrong F, Cooke S, Rissik D, Tonmoy F. Queensland Climate Adaptation Strategy: Human Health and Wellbeing Climate Change Adaptation Plan for Queensland. Brisbane; Queensland Government, 2018.
- 49. Commonwealth Government. Protecting human health and safety during severe and extreme heat events: a national framework. PricewaterhouseCoopers, 2011.
- 50. Bureau of Meteorology. Indigenous Weather Knowledge: Map 2. Sub divisions within the key climate groups. Melbourne: Commonwealth of Australia, 2014. http://www.bom.gov.au/iwk/climate_zones/map_2.shtml (viewed June 2018).
- 51. Bureau of Meteorology. Indigenous Weather Knowledge: Map 1. The key climate groups. Melbourne: Commonwealth of Australia, 2014. http://www.bom.gov.au/iwk/climate_zones/map_1.shtml (viewed June 2018).
- 52. Victorian Government Department of Environment, Land, Water and Planning. Victoria’s Climate Change Framework. Melbourne: DELWP, 2018. https://www.climatechange.vic.gov.au/victorias-climate-change-framework (viewed June 2018).
- 53. Queensland Government Department of Environment and Heritage Protection. Queensland climate change response. 2018. https://www.qld.gov.au/environment/climate/response (viewed June 2018).
- 54. Western Australia Department of Water and Environmental Regulation. Adapting to climate change. 2018. https://www.der.wa.gov.au/your-environment/climate-change/254-adapting-to-climate-change (viewed June 2018).
- 55. Tasmanian Government Department of Premier and Cabinet. Climate change priorities. Hobart: Tasmanian Climate Change Office, 2018. http://www.dpac.tas.gov.au/divisions/climatechange/Climate_Change_Priorities (viewed June 2018).
- 56. New South Wales Government, Office of Environment and Heritage. Adapt NSW. Sydney: NSWOEH, 2018. http://climatechange.environment.nsw.gov.au/ (viewed June 2018).
- 57. Government of South Australia, Department of Environment, Water and Natural Resources. South Australia’s Climate Change Strategy 2015-2050: towards a low carbon economy. no date. https://www.environment.sa.gov.au/files/sharedassets/public/climate-change/sa-climate-change-strategy-2015-2050-towards-low-carbon-economy.pdf (viewed June 2018).
- 58. Australian Capital Territory (ACT) Government, Environment, Planning and Sustainable Development Directorate. Climate change adaptation and resilience. Canberra: EPSDD, 2017. http://www.environment.act.gov.au/cc/what-government-is-doing/climate-change-adaptation-and-resilience (viewed June 2018).
- 59. Tasmania Government Department of Premier and Cabinet. Adapting to climate change in Tasmania: issues paper. Hobart: Tasmanian Climate Change Office, 2012.
- 60. New South Wales Government, Office of Environment and Heritage. Towards a resilient Sydney: urban adaptation research synthesis. Sydney: NSWOEH, 2014.
- 61. Western Australia Department of Health. Health impacts of climate change: adaptation strategies for Western Australia. Perth: Department of Health, 2008. http://ww2.health.wa.gov.au/∼/media/Files/Corporate/general%20documents/Environmental%20health/Climate%20change/Health-impacts-of-climate-change.pdf (viewed June 2018).
- 62. City of Adelaide. Climate Change Adaptation: Action Plan 2013-2015. https://www.cityofadelaide.com.au/assets/documents/REPORT-Energy_Efficiency_Reports_Climate_Change.pdf (viewed Oct 2018).
- 63. Brisbane City Council. Brisbane. Clean, green, sustainable: 2017-2031. Brisbane: Brisbane City Council, 2017.
- 64. City of Darwin. Climate Change Action Plan 2011-2020. Darwin: Darwin City Council, 2011.
- 65. Hobart City Council. Hobart City Council Corporate Climate Change Adaptation Plan 2013-2016. Hobart: Southern Tasmanian Councils Authority, 2012.
- 66. City of Melbourne. City of Melbourne Climate Change Adaptation Strategy. Melbourne: Maunsell Australia Pty Ltd, 2008.
- 67. City of Perth. Towards an energy resilient city: strategic directions paper. Perth: City of Perth, 2014.
- 68. City of Sydney. Adapting for Climate Change: A long term strategy for the City of Sydney. Sydney: City of Sydney, https://www.cityofsydney.nsw.gov.au/__data/assets/pdf_file/0013/250123/2016-022571-Adapting-to-Climate-Change_accessible.pdf (viewed Oct 2018).
- 69. World Health Organization. International Health Regulations (2005) Monitoring framework - country profiles. Geneva: WHO, 2018. http://apps.who.int/gho/tableau-public/tpc-frame.jsp?id=1100 (viewed July 2018).
- 70. Nairn JR, Fawcett RJB. The Excess Heat Factor: a metric for heatwave intensity and its use in classifying heatwave severity. Int J Environ Res Public Health 2015; 12: 227-253.
- 71. Australian Red Cross. Telecross REDi (SA): calling vulnerable and isolated people during extreme weather events [website]. https://www.redcross.org.au/get-help/community-services/telecross/telecross-redi (viewed June 2018).
- 72. Nitschke M, Tucker G, Hansen A, et al. Evaluation of a heat warning system in Adelaide, South Australia, using case-series analysis. BMJ Open 2016; 6: e012125.
- 73. Coates L, Haynes K, O’Brien J, et al. Exploring 167 years of vulnerability: an examination of extreme heat events in Australia 1844–2010. Environ Sci Policy 2014; 42: 33-44.
- 74. Garnaut R. The Garnaut climate change review: final report. Cambridge: Cambridge University Press, 2008.
- 75. Stern N. The economics of climate change: the Stern review. Cambridge: Cambridge University Press, 2007.
- 76. Garnaut R. The Garnaut review 2011: Australia in the global response to climate change. Cambridge: Cambridge University Press, 2011.
- 77. Steffen W. The critical decade: climate science, risks and responses. Canberra: Climate Commission Secretariat, 2011.
- 78. Steffen W, Hughes L. The critical decade 2013: climate change science, risks and responses. Canberra: Climate Commission Secretariat, 2013.
- 79. Steffen W, Hughes L, Karoly D. The critical decade: extreme weather. Canberra: Climate Commission Secretariat, 2013.
- 80. Flannery T, Beale R, Hueston G (Climate Commission). The critical decade: international action on climate change. Canberra: Commonwealth of Australia, 2012.
- 81. Flannery T, Sahajwalla V (Climate Commission). The critical decade: generating a renewable Australia. Canberra: Commonwealth of Australia, 2012.
- 82. Flannery T, Beale R, Hueston G (Climate Commission). The critical decade: global action building on climate change. Canberra: Commonwealth of Australia, 2013.
- 83. Hughes L, McMichael T (Climate Commission). The critical decade: climate change and health. Canberra: Climate Commission Secretariat (Department of Climate Change and Energy Efficiency), 2011.
- 84. Cifuentes L, Borja-Aburto VH, Gouveia N, et al. Hidden health benefits of greenhouse gas mitigation. Science 2001; 293: 1257-1259.
- 85. Haines A, McMichael AJ, Smith KR, et al. Public health benefits of strategies to reduce greenhouse-gas emissions: overview and implications for policy makers. Lancet 2009; 374: 2104-2114.
- 86. International Energy Agency. Energy policies of IEA countries. Australia: 2018 review. IEA, 2018. http://www.iea.org/publications/freepublications/publication/EnergyPoliciesofIEACountriesAustralia2018Review.pdf (viewed June 2018).
- 87. International Energy Agency. IEA atlas of energy. http://energyatlas.iea.org (viewed June 2018).
- 88. CSIRO, Energy Networks Australia. Electricity network transformation roadmap: final report. Melbourne: ENR, 2017.
- 89. Clean Energy Council. Clean Energy Australia: report 2018. Melbourne: Clean Energy Council, 2018. https://www.cleanenergycouncil.org.au/policy-advocacy/reports/clean-energy-australia-report.html (viewed June 2018).
- 90. Australian Government, Department of the Environment and Energy. The Renewable Energy Target (RET) scheme. Canberra: Commonwealth of Australia, 2017. http://www.environment.gov.au/climate-change/government/renewable-energy-target-scheme (viewed June 2018).
- 91. Infrastructure Australia. Remote and Indigenous communities: Australian infrastructure plan. Canberra: Australian Government, 2016. http://infrastructureaustralia.gov.au/policy-publications/publications/files/IA_J16-2330_Fact_Sheet_Remote_and_Indigenous_v1.1.pdf (viewed June 2018).
- 92. Indigenous Business Australia. Renewable energy transition to benefit Indigenous Australians. Canberra: Australian Government, 2017. https://www.iba.gov.au/2017/06/renewable-energy-transition-benefit-indigenous-australians/ (viewed June 2018).
- 93. Pope III CA, Dockery DW. Health effects of fine particulate air pollution: lines that connect. J Air Waste Manage Assoc 2006; 56: 709-742.
- 94. van Donkelaar A, Martin RV, Brauer M, et al. Global estimates of fine particulate matter using a combined geophysical-statistical method with information from satellites, models, and monitors. Environ Sci Technol 2016; 50: 3762-3772.
- 95. World Health Organization. Health risks of air pollution in Europe – HRAPIE project: Recommendations for concentration–response functions for cost–benefit analysis of particulate matter, ozone and nitrogen dioxide. Copenhagen: WHO Regional Office for Europe, 2013.
- 96. ClimateWorks Australia. The state of electric vehicles in Australia. Melbourne: ClimateWorks Australia, 2017.
- 97. International Energy Agency. Global EV outlook 2017: two million and counting. Paris: IEA, 2017.
- 98. New South Wales Government, Transport for NSW. Open data: household travel survey. https://opendata.transport.nsw.gov.au/search?query=household%20travel%20survey (viewed July 2018).
- 99. Xia T, Nitschke M, Zhang Y, et al. Traffic-related air pollution and health co-benefits of alternative transport in Adelaide, South Australia. Environ Int 2015; 74: 281-290.
- 100. Wiedmann T. A review of recent multi-region input–output models used for consumption-based emission and resource accounting. Ecol Econ 2009; 69: 211-222.
- 101. Lenzen M. Errors in conventional and input-output-based life-cycle inventories. J Ind Ecol 2000; 4: 127-148.
- 102. Monger HC, Kraimer RA, Khresat S, et al. Sequestration of inorganic carbon in soil and groundwater. Geology 2015; 43: 375-378.
- 103. Sanderman J. Can management induced changes in the carbonate system drive soil carbon sequestration? A review with particular focus on Australia. Agric Ecosyst Environ 2012; 155: 70-77.
- 104. Australian Government. Australia: State of the Environment. Land (2016): Soil: carbon dynamics. Canberra: Commonwealth of Australia, 2017. https://soe.environment.gov.au/theme/land/topic/soil-carbon-dynamics (viewed June 2018).
- 105. New South Wales Government Department of Primary Industries. Increasing soil organic carbon of agricultural land. Orange: DPI, 2008. https://www.dpi.nsw.gov.au/agriculture/soils/soil-carbon/increasing-soil-organic-carbon-of-agricultural-land (viewed June 2018).
- 106. CSIROpedia. The Soil Carbon Research Program (SCaRP). http://csiropedia.csiro.au/soil-carbon-research-program/ (viewed June 2018).
- 107. Hohmeyer OH, Bohm S. Trends toward 100% renewable electricity supply in Germany and Europe: a paradigm shift in energy policies. Wiley Interdisciplinary Rev Energy Environ 2015; 4: 74-97.
- 108. Australian Energy Regulator. State of the energy market, May 2017. Melbourne: AER, 2017. https://www.aer.gov.au/publications/state-of-the-energy-market-reports/state-of-the-energy-market-may-2017 (viewed June 2018).
- 109. Australian Energy Market Operator. Generation Information Page. Melbourne: AEMO, 2018. http://aemo.com.au/Electricity/National-Electricity-Market-NEM/Planning-and-forecasting/Generation-information (viewed June 2018).
- 110. Arabella Advisors. The global fossil fuel divestment and clean energy investment movement. Washington, DC: Arabella Advisors, 2016. https://www.arabellaadvisors.com/wp-content/uploads/2016/12/Global_Divestment_Report_2016.pdf (viewed June 2018).
- 111. Hasson AEA, Mills GA, Timbal B, Walsh K. Assessing the impact of climate change on extreme fire weather events over southeastern Australia. Clim Res 2009; 39: 159-172.
- 112. Murphy BF, Timbal B. A review of recent climate variability and climate change in southeastern Australia. Int J Climatol 2008; 28: 859-879.
- 113. Australian Bureau of Statistics. Employment in renewable energy activities, Australia, 2016-17. (ABS Cat. No. 4631.0). Canberra: ABS, 2018. http://www.abs.gov.au/AUSSTATS/abs@.nsf/Lookup/4631.0Main+Features12016-17?OpenDocument (viewed June 2018).
- 114. Australian Government, Clean Energy Regulator. 2015-2016 Annual report: accelerating carbon abatement for Australia. Canberra: CER, 2016. http://www.cleanenergyregulator.gov.au/DocumentAssets/Documents/Clean%20Energy%20Regulator%20Annual%20report%20201516.pdf (viewed June 2018).
- 115. Coady D, Parry I, Sears L, Shang B. How large are global fossil fuel subsidies? World Dev 2017; 91: 11-27.
- 116. Schwanitz VJ, Piontek F, Bertram C, Luderer G. Long-term climate policy implications of phasing out fossil fuel subsidies. Energy Policy 2014; 67: 882-894.
- 117. Independent Pricing and Regulatory Tribunal New South Wales. Registry user guide. Energy savings scheme. Greenhouse gas reduction scheme. Sydney: IPART, 2014. https://www.ipart.nsw.gov.au/files/sharedassets/website/trimholdingbay/ggas_registry_-_registry_user_guide_-_26_february_2014.pdf (viewed June 2018).
- 118. Australian Government. Clean Energy Act 2011. No.131, 2011 as amended. Canberra: Federal Register of Legislation, 2011. https://www.legislation.gov.au/Details/C2013C00372 (viewed June 2018).
- 119. Australian Government. Carbon Credits (Carbon Farming Initiative) Rule 2015 made under section 308 of the Carbon Credits (Carbon Farming Initiative) Act 2011. Canberra: Federal Register of Legislation, 2017. https://www.legislation.gov.au/Details/F2017C00670 (viewed June 2018).
- 120. Australian Government. Part 1: Australian Government Budget Outcome. Table 4. Canberra: Commonwealth of Australia, 2013. http://www.budget.gov.au/2012-13/content/fbo/html/part_1.htm (viewed June 2018).
- 121. Australian Government. Part 1: Australian Government Budget Outcome. Fiscal Balance. Table 4. Canberra: Commonwealth of Australia, 2014. http://www.budget.gov.au/2013-14/content/fbo/html/01_part_1-03.htm (viewed June 2018).
- 122. Australian Government, Clean Energy Regulator. Regulatory deliverables. Annual report 2011-12. Canberra: CER, 2012. http://www.cleanenergyregulator.gov.au/About/Accountability-and-reporting/Annual-Reports/Annual%20report%202011–12/Regulatory-deliverables (viewed June 2018).
- 123. Lyster R. Australia’s Clean Energy Future Package: are we there yet? Legal Studies Research Paper No. 11/85. Sydney: University of Sydney, 2011. http://ssrn.com/abstract=1954238 (viewed June 2018).
- 124. National Climate Change Adaptation Research Facility. NCCARF Phase 2 project plan. Gold Coast: NCCARF, 2014.
- 125. O’Neill S, Williams HTP, Kurz T, et al. Dominant frames in legacy and social media coverage of the IPCC Fifth Assessment Report. Nat Clim Chang 2015; 5: 380-385.
- 126. Bain PG, Milfont TL, Kashima Y, et al. Co-benefits of addressing climate change can motivate action around the world. Nat Clim Chang 2016; 6: 154-157, 538.
- 127. Gasparrini A, Guo Y, Hashizume M, et al. Mortality risk attributable to high and low ambient temperature: a multicountry observational study. Lancet 2015; 386: 369-375.
- 128. McMichael A, Woodruff R, Whetton P, et al. Human health and climate change in Oceania: a risk assessment 2002. Canberra: Commonwealth Department of Health and Ageing, 2003.
- 129. Talberg A, Hui S, Loynes K. Australian climate change policy to 2015: a chronology. Department of Parliamentary Services Research Paper Series, 2015–16. Canberra: Parliament of Australia, 2016. http://parlinfo.aph.gov.au/parlInfo/download/library/prspub/4590624/upload_binary/4590624.pdf; fileType=application/pdf (viewed June 2018).
- 130. Climate and Health Alliance. National Consultation regarding a National Strategy on Climate, Health and Well-being for Australia: final consultation report. Melbourne: Climate and Health Alliance, 2017.
Christopher RStrakosch
Competing Interests: No relevant disclosures.
Prof Christopher RStrakosch
University of Queensland, Greenslopes Private Hospital