


The known: Health care ultimately generates 7% of national carbon emissions in Australia. A considerable proportion of the cost of health care in Australia is associated with pathology services (12% of Medicare spending).
The new: The overall carbon footprints of five common hospital pathology tests, measured as carbon dioxide equivalent (CO2e) emissions, ranged between 0.5 and 116 g CO2e, equivalent to driving a car between 3 m and 0.8 km.
The implications: Opportunities to reduce the carbon footprint of pathology testing are limited. The greatest environmental benefit can be achieved by reducing unnecessary testing. Environmental impact, together with cost‐effectiveness and health outcomes, should be considered when ordering tests.
Climate change is among the most important threats to human health in the 21st century.1 Health care itself is carbon‐intensive and therefore contributes to climate change;2 in Australia, it is the cause of 7% of national carbon dioxide equivalent (CO2e) emissions.3 The health sectors of 36 major countries are responsible for 4.4% of annual global CO2e emissions, and hospitals are the main sources of these emissions.4 More than half the CO2e emissions associated with the British National Health Service are caused indirectly by the use of consumable items, including pharmaceuticals and medical devices.5
Pathology services are responsible for considerable health care costs in Australia: during 2018–19, 12.4% of all Medicare spending ($3.0 billion) was for pathology services.6 As 12–44% of ordered pathology tests are not clinically indicated,7 calls to encourage evidence‐based testing and for physicians to be selective when ordering pathology tests have increased.8 These calls could be bolstered by evidence about the environmental effects of unnecessary testing.9
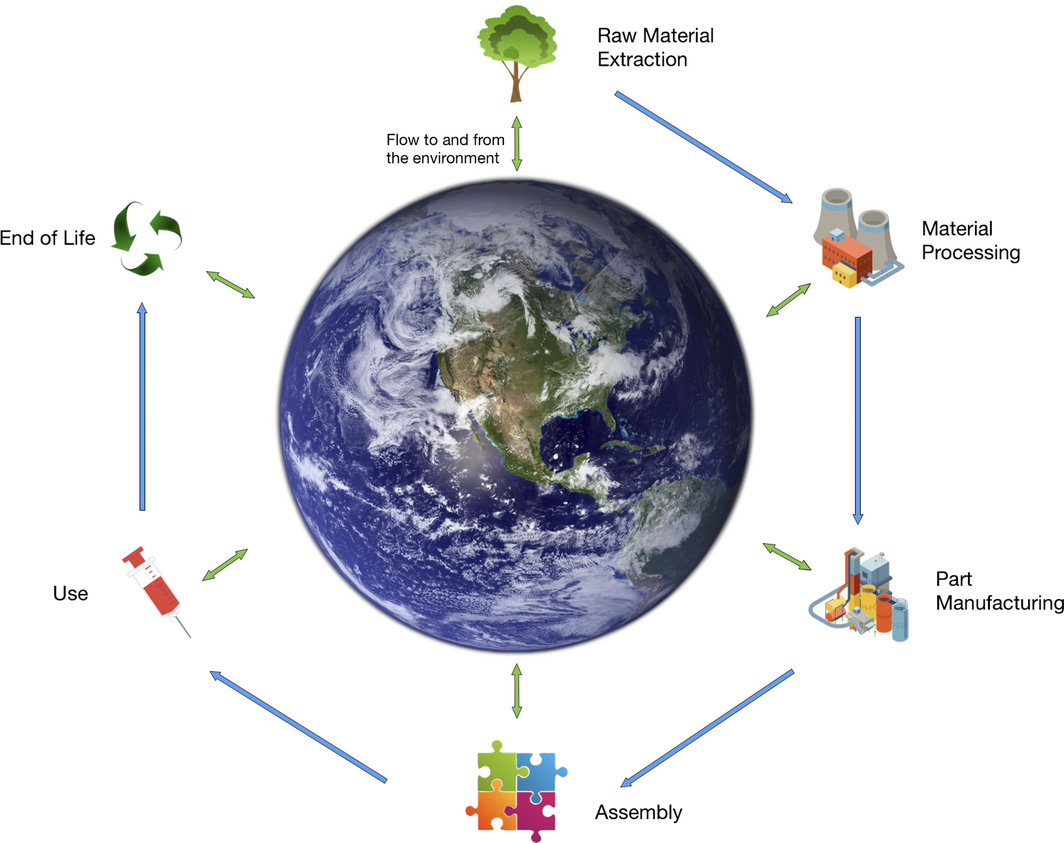
Life cycle assessment (LCA) is a method for estimating the environmental footprint of a product or service throughout its entire life cycle (including the impacts, for example, on CO2e emissions, water, and pollution) (Box 1). The international standard for LCA methodology prescribes assessment of raw material acquisition, processing and manufacturing, distribution and transportation, use, re‐use, and maintenance, and waste management and recycling.10 Impacts of anaesthetics, pharmaceutical products, and surgical techniques have been reported,11,12,13,14 but not the carbon footprint of pathology testing.
We therefore estimated the CO2e emissions associated with five pathology tests frequently ordered for routine monitoring of hospital patients: full blood examination; coagulation profile (activated partial thromboplastin time [aPTT] and international normalised ratio of prothrombin time [INR]); urea and electrolyte levels (U&E); C‐reactive protein concentration (CRP); and arterial blood gas testing (ABG). We focused on the carbon footprint (rather than other environmental effects) because of the increasing significance of climate change for human health.15
Methods
Study setting
We assessed the carbon footprint of five pathology tests (full blood examination, coagulation profile, U&E, CRP, ABG) undertaken in two university‐affiliated health service hospitals in Melbourne: Austin Hospital (Austin Health) and Sunshine Hospital (Western Health). More than 2000 pathology tests are ordered in each health service each day.
Study design
We performed a consequential process‐based LCA in accordance with the International Organization for Standardization (ISO) 14040 principles and framework.10 Consequential LCA measures the specific impact of an additional test (marginal or incremental impact) rather than the mean impact of all tests conducted, as calculated in an attributional analysis. For example, five people travel on a train that causes 100 kg CO2 emissions; in an attributional analysis, each person is held responsible for 20 kg emissions, but in a consequential analysis they are responsible only for the small net change in emissions associated with their using a train that would run regardless of whether they used it or not.
The functional unit of our study was the collection of a sample in a plastic vacutainer tube holder and collection tube and the analysis of a single blood sample in a hospital for full blood examination, coagulation profile, U&E, CRP, or ABG. As CRP tests are typically ordered together with U&E tests, the CRP impact analysis was limited to the additional power and reagents required (ie, excluding the impacts of sample collection and test consumables).
The system boundary defined what was included or excluded in our analyses (Box 2). We excluded capital infrastructure; as its environmental impact is amortised over decades and tens of millions of tests, its impact per test is negligible.
Study outcomes
The primary outcome was CO2e (in grams). For comparison, outcomes were also expressed as the distance driven in a standard Australian car16 that would produce the same amount of CO2e emissions.
Data collection
All data were collected between 1 November 2018 and 31 August 2019. The weights and composition of all materials used in each test were measured, as was the power required to undertake each test.
Most materials were weighed with a Digitech QM7259 scale (resolution, 0.01 g); for items exceeding 200 g, a Heller KSH66 scale (resolution, 1 g) was used. For phlebotomy, we sampled equipment used by major Australian pathology providers,17,18 including nitrile gloves, cotton swabs, alcohol swabs, BD vacutainers (plastic tubes and needles), syringes and adjuncts (serum separators, syringes, and sealable plastic specimen bags). For pathology testing, we sampled aliquot tubes and reagents and their packaging, including glass and plastic bottles, plastic cartridges, printed instructions, and cardboard boxes. The weights of all consumables required for sample collection, energy consumption, weights, and volumes of consumables and reagents used are summarised in the Supporting Information, table 1. Transport from place of manufacture was determined and included in the analysis for all items.
Three‐phase electrical power consumption by pathology analysers was sampled and logged every 15 seconds with a Hioki PW3365‐20 power meter for four days. Single‐phase power was sampled and logged every 30 seconds with a Watts Up? Pro power meter and Logger Pro 3.14.1.0 (Vernier) for four days. Marginal power use for a single test was estimated as including an additional minute of operation before the machine returned to standby mode; this estimate was derived from the time machine analysers took to pipette sequential samples, the time for completing a single test, and the time between sequential tests being completed. The exception was the blood gas analyser, with which single tests were performed. As this was a consequential analysis, we calculated electricity usage per test from the difference in power consumed during activity and mean standby power consumption.
Data analysis
Primary data from the two hospitals were weighted according to the number of tests performed at each hospital (Supporting Information, table 2). All life cycle impacts were modelled with SimaPro 9.0.0.27 (https://simapro.com). Background data on the environmental impacts of materials and energy were obtained from the consequential version of Ecoinvent 3.5, an international ISO 14044‐compliant database.19 Impact assessment was modelled with the European Commission International Reference Life Cycle Data system (ILCD; version 1.10) impact assessment method.20
Each model input was associated with an uncertainty value expressed as a log‐normal probability distribution, calculated with a pedigree matrix21 according to the reliability and completeness of the data and temporal and geographic proximity. The 95% confidence intervals (CIs) were calculated by Monte Carlo analysis (1000 runs, each generating a random value from within the range of the input distribution).
Twenty‐three distinct reagents were required for the five tests. Data were not available in the Ecoinvent database for fourteen of the thirty‐one chemicals contained in these reagents (eg, adenosine triphosphate). Further, the high purities and small volumes associated with fine chemical production may result in impacts up to 25 times as great as for comparable basic (low purity) chemical production.22 We therefore estimated a proxy value for fine chemicals that was used when values were not available in the database; we searched the Ecoinvent database for all chemicals contained in reagents, and determined the mean impact value for those for which data were available, and multiplied the resultant value by 25 to account for fine chemical production.22 The compositions of nine of the reagents used for full blood examination and coagulation profile were unavailable because of commercial confidentiality; we therefore calculated the mean proportional concentration of fine chemicals of known reagents (3.7%) and used this as a proxy value for the unknown reagents. The remaining volume of all reagents was assumed to be ultrapure water.
Sensitivity analyses
Given uncertainties about the impacts of chemicals in the pathology reagents, we performed sensitivity analyses in which alternative multiplication factors for the difference between basic and fine chemical production were applied (10–40) or alternative mean proportional concentrations of fine chemicals for unknown reagents were assumed (1–4%).
Ethics approval
The requirement for ethics approval of this observational study was waived by both health services (reference, Q 32631).
Results
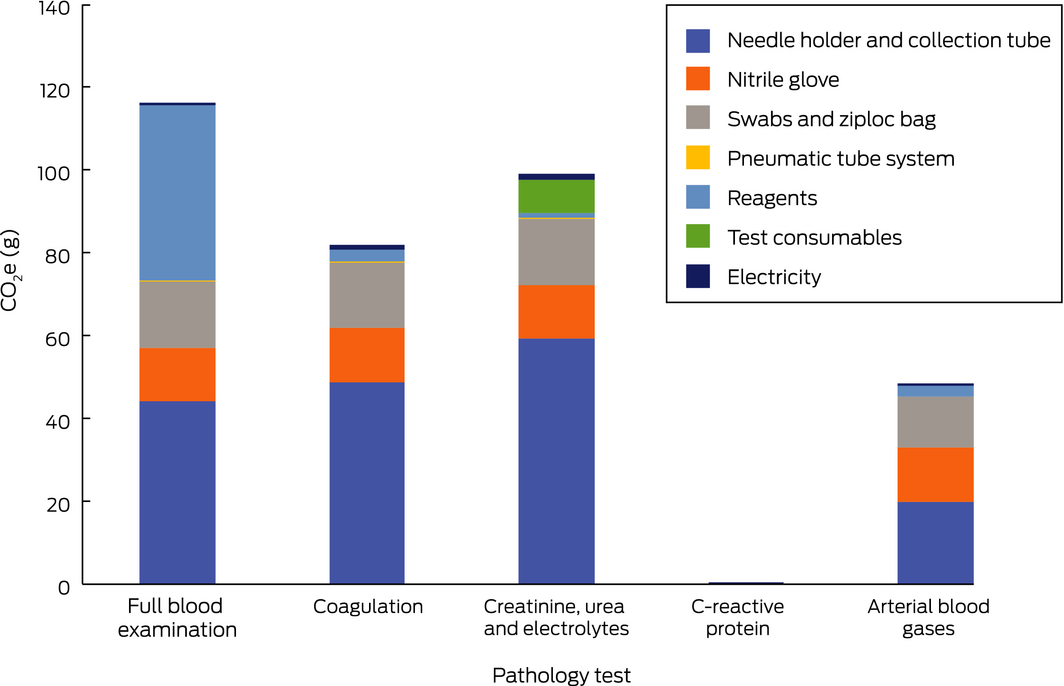
CO2e values for four of the five tests ranged between 49 g/test (95% CI, 45–53 g/test) for ABG and 116 g/test (95% CI, 101–135 g/test) for full blood examination; for the fifth (CRP), the value was small (0.5 g/test; 95%, 0.4–0.6 g/test) because the impact of sample collection was excluded. Expressed as distance driven in a car, the carbon impact of single tests ranged from 3 m for CRP to 770 m for full blood examination (Box 3).
For all tests except CRP, the main sources of CO2e emissions were sample collection consumables (swabs, gloves, vacutainer holders and collection tubes, specimen bags). The proportions of emissions attributable to sample collection were 63% (74 of 116 g) for full blood examination, 90% (89 of 99 g) for U&E, 94% (46 of 49 g) for ABG, and 95% (78 of 82 g) for coagulation profile. As CRP was generally ordered together with U&E, it had no separate emissions impact during the collection phase (Box 4).
Differences in the contributions of sample collection to total CO2e were explained by the differing volumes, and therefore polyethylene terephthalate (PET) content, of the respective collection tubes. Further, adjuncts such as anticoagulants and serum separators contributed to emissions (data not shown). The lower carbon impact of sample collection for ABG reflects the fact that a single syringe and needle is used for each test; the other tests each require a vacutainer holder and collection tube.
CO2e emissions associated with power use during the laboratory analysis stage of full blood examination, coagulation profile, U&E, and CRP were similar, ranging between 0.2 and 1.4 g CO2e per test. In contrast, the impacts of reagents and their packaging ranged from 0.3 g for CRP and 0.9 g CO2e per test for U&E to 42.1 g CO2e per test for full blood examination. The impact of consumables for U&E (8 g CO2e/test), particularly pipettes, aliquot tubes, and polypropylene caps, was considerably higher than that of reagents (Box 4). Coagulation assessment does not require aliquot tubes, samples being taken directly from collection tubes, and the laboratory impact for this test is dominated by reagents and their packaging (2.9 g CO2e) (Box 4).
The higher level of laboratory‐related CO2e emissions associated with full blood examination was related to the number and volume of reagents needed (38.6 mL, compared with 0.15 mL for CRP); reagent transport from Singapore explained 5.0 g CO2e per test, exceeding those for ABG reagents transported from Poland (2.6 g CO2e) and the reagent components of the other tests (U&E, 1.1 g; CRP and coagulation profile, each 1.3 g CO2e/test).
In sensitivity analyses, changing the factor used to account for the difference between basic and fine chemical production did not affect our findings, except those for full blood examination: reducing the factor from 25 to 10 reduced the overall impact by 16%, from 116 g to 97 g (95% CI, 88–108 g) CO2e per test. Similarly, reducing the assumed fine chemical concentration from 3.7% to 1% resulted in an 18% reduction in overall impact for full blood examination (to 96 g CO2e per test; 95% CI, 86–106 g) (Box 5).
Discussion
We report for the first time the life cycle carbon footprint of five common hospital pathology tests. The CO2e emissions associated with two haematology tests (full blood examination, coagulation profile) were similar, but those associated with biochemistry tests (U&E, CRP, ABG) differed according to whether additional venepuncture and collection were needed. The carbon footprints of the tests were principally associated with blood sample collection (including test tube plastics) rather than reagents or power use. The estimated CO2e emissions for each test were equivalent to those of driving a standard Australian car between 3 m (CRP) and 770 m (full blood examination). While the greenhouse gas impact of individual tests is relatively small, 17.8 million haematology and 56.2 million biochemistry tests were funded by Medicare during 2018–19.23
Our findings at two hospitals in Melbourne probably reflect the carbon footprint of pathology tests undertaken at other metropolitan hospitals in Australia. The footprints of community pathology tests will be different because of factors such as road transport and the different analysers used. Despite variability in pathology testing between laboratories, the limited number of reagents used and the dominant impacts of sample collection in our study suggest that our CO2e emission findings are generalisable to the same pathology tests undertaken elsewhere. Sample collection was the dominant cause of CO2e emissions, and major variability in items used for phlebotomy is unlikely. Finally, as CRP assessment can be undertaken with blood collected for U&E, we attributed all venepuncture consumables to U&E, as this test is routine. Point‐of‐care testing, however, is likely to have a different impact and could be assessed in a separate investigation.
Environmental sustainability is often described as a hierarchy of waste reduction: avoid, reduce, re‐use, and recycle. Previous LCA studies have focused on re‐using and recycling rather than reducing.14,24 For pathology testing, however, opportunities for re‐using or recycling items are limited by factors such as infection control. Changing the composition of blood collection and storage equipment will not markedly reduce CO2e emissions if substitutes are of similar carbon intensity. Further, improving the energy efficiency of analysis devices and using electricity from renewable sources will have only a limited impact on the carbon footprint of pathology testing. The main opportunities for reducing waste and CO2 emissions involve changing the behaviour of clinicians to avoid and reduce unnecessary pathology testing.
In certain circumstances, not testing may entail a risk of adverse outcomes for the patient, but appropriate testing is important; in particular, ordering tests only when the outcome will inform clinical decision making and patient care. Pathology testing is often not clinically indicated7 and unneeded testing can produce higher numbers of false positive results, leading to further unnecessary testing, overdiagnosis of disease, and unnecessary and potentially harmful treatment.25,26 Each element in this cascade also has an associated detrimental environmental impact. Excessive testing may be driven by a number of factors other than the clinician, and these factors could be targeted to reduce the carbon costs of tests.27,28,29
Limitations
Primary data for the manufacture of phlebotomy equipment were unavailable, so we assumed typical industry methods of moulding and forming. Similarly, primary data for the manufacture of reagents were unavailable, and we instead made conservative estimates.
Conclusion
It was recently commented that “… eliminating unnecessary care reduces unnecessary resource use and emissions. Such partnerships could be encouraged to bring environmental stewardship into the health care quality discourse.”9 Together with data on the health outcomes of pathology testing and its cost‐effectiveness, our environmental data provide robust evidence for clinicians to consider when choosing pathology tests, supporting a more sustainable and healthy future for our patients.
Box 2 – System boundary of our life cycle assessment of the carbon footprint of pathology tests, showing processes and systems included in or excluded from our study
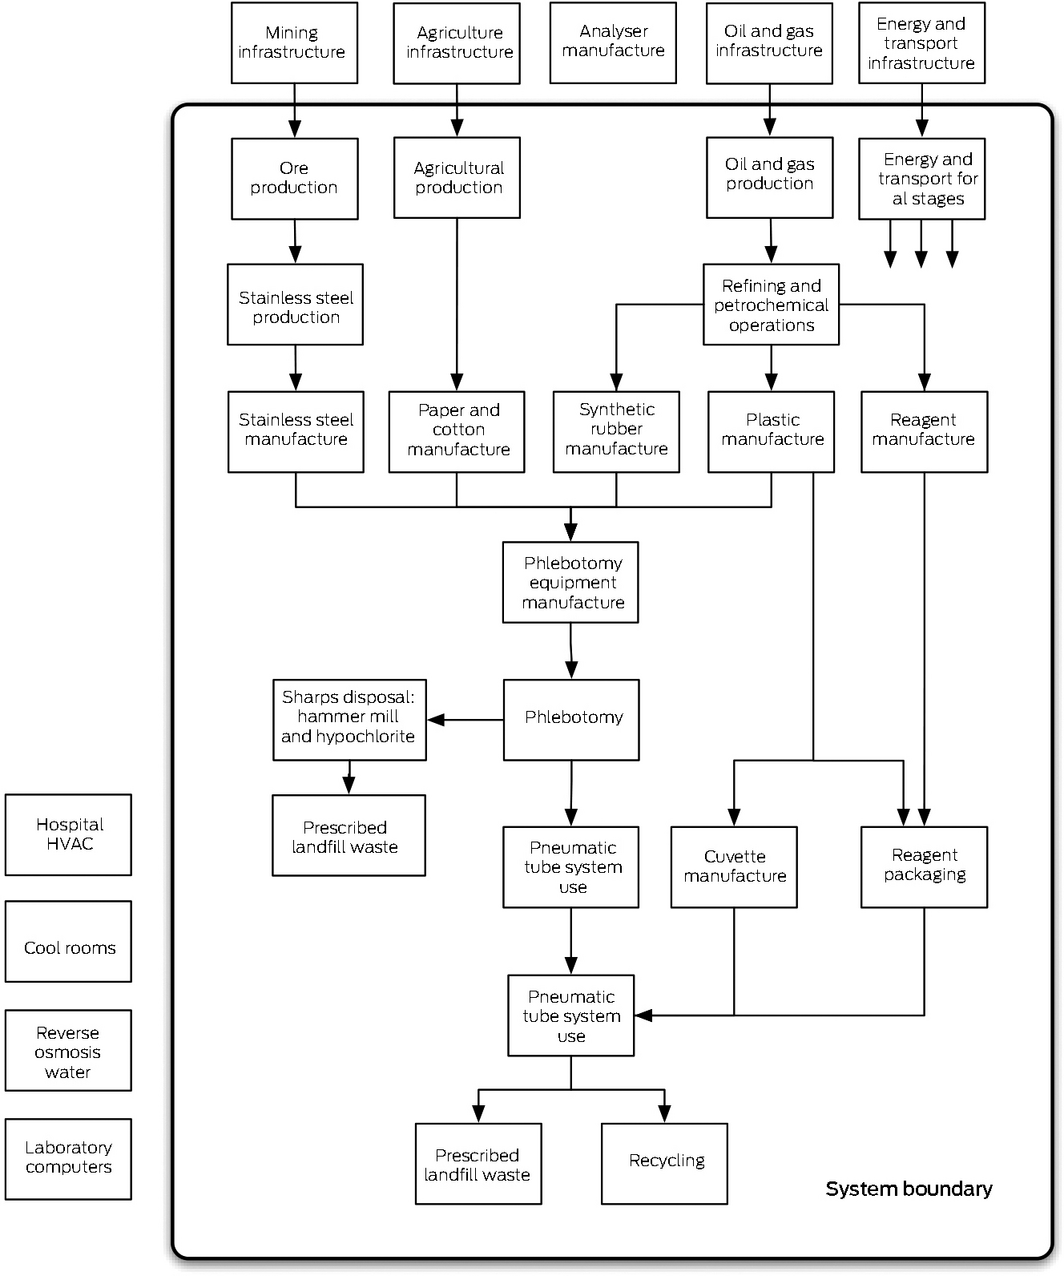
HVAC = heating, ventilating, and air conditioning.
Box 3 – Carbon dioxide equivalent (CO2e) emissions for five common hospital pathology tests, with distance driven in a standard car producing equivalent emissions
|
|
Mean CO2e (g) |
Equivalent distance in car (km/1000 tests) |
|||||||||||||
|
|
|||||||||||||||
|
Full blood examination |
116 (101–135) |
770 |
|||||||||||||
|
Coagulation profile |
82 (73–91) |
540 |
|||||||||||||
|
Urea and electrolytes |
99 (84–113) |
650 |
|||||||||||||
|
C‐reactive protein* |
0.5 (0.4–0.6) |
3 |
|||||||||||||
|
Arterial blood gases |
49 (45–53) |
320 |
|||||||||||||
|
|
|||||||||||||||
|
CI = confidence interval. * Ordered in conjunction with urea and electrolyte assessment. |
|||||||||||||||
Box 4 – Carbon dioxide equivalent (CO2e) emissions associated with single pathology tests, by test component
Box 5 – Carbon emissions (CO2e; in grams) for five common hospital pathology tests: sensitivity analyses
|
Fine chemical multiplication factor |
10 |
15 |
20 |
25* |
30 |
||||||||||
|
|
|||||||||||||||
|
Full blood examination |
98 |
104 |
110 |
116 |
122 |
||||||||||
|
Coagulation profile |
81 |
82 |
82 |
82 |
82 |
||||||||||
|
Urea and electrolytes |
99 |
99 |
99 |
99 |
99 |
||||||||||
|
C‐reactive protein† |
0.5 |
0.5 |
0.5 |
0.5 |
0.5 |
||||||||||
|
Arterial blood gases |
49 |
49 |
49 |
49 |
48 |
||||||||||
|
Unknown reagent concentration |
1% |
2% |
3% |
3.7* |
4% |
||||||||||
|
Full blood examination |
96 |
103 |
111 |
116 |
118 |
||||||||||
|
Coagulation profile |
81 |
82 |
82 |
82 |
82 |
||||||||||
|
|
|||||||||||||||
|
* Factor applied in major analysis. † Ordered in conjunction with urea and electrolyte assessment. |
|||||||||||||||
Received 11 November 2019, accepted 25 February 2020
- Scott McAlister1
- Alexandra L Barratt2
- Katy JL Bell2
- Forbes McGain1,3
- 1 The University of Melbourne, Melbourne, VIC
- 2 Sydney School of Public Health, University of Sydney, Sydney, NSW
- 3 Western Health, Melbourne, VIC
Funding for this investigation (data collection, life cycle assessment analysis, report writing) was provided by the Victorian Department of Health and Human Services, Choosing Wisely Australia, and by a National Health and Medical Research Council Centre for Research Excellence grant (Alexandra Barratt: 1104136). Scott McAlister is supported by a National Health and Medical Research Council PhD scholarship. Cathy Cockshott provided access to the Sunshine Hospital pathology laboratory, and Nick Crinis to the Austin Hospital pathology laboratory, to allow collection of data about analysers and reagents.
No relevant disclosures.
- 1. Landrigan PJ, Fuller R, Acosta NJR, et al. The Lancet Commission on pollution and health. Lancet 2018; 391: 462–512.
- 2. Eckelman MJ, Sherman J. Environmental impacts of the US health care system and effects on public health. PLoS One 2016; 11: e0157014.
- 3. Malik A, Lenzen M, McAlister S, McGain F. The carbon footprint of Australian health care. Lancet Planet Health 2018; 2: 27–35.
- 4. Pichler PP, Jaccard IS, Weisz U, Weisz H. International comparison of health care carbon footprints. Environ Res Lett 2019; 14: 064004.
- 5. Sustainable Development Unit. Natural resources footprinting technical annex. June 2018. https://www.sduhealth.org.uk/policy-strategy/reporting/natural-resource-footprint-2018.aspx (viewed Oct 2019).
- 6. Australian Department of Human Services. All Medicare by MBS category processed from July 2018 to June 2019. http://medicarestatistics.humanservices.gov.au/statistics/mbs_group.jsp (viewed Feb 2020).
- 7. Zhi M, Ding EL, Theisen‐Toupal J, et al. The landscape of inappropriate laboratory testing: a 15‐year meta‐analysis. PLoS One 2013; 8: e78962.
- 8. Cassel CK, Guest JA. Choosing wisely: helping physicians and patients make smart decisions about their care. JAMA 2012; 307: 1801–1802.
- 9. Sherman JD, MacNeill A, Thiel C. Reducing pollution from the health care industry. JAMA 2019; 322: 1043–1044.
- 10. International Organization for Standardization. ISO 14040:2006. Environmental management. Life cycle assessment: principles and framework. 2nd edition. Geneva: ISO, 2006.
- 11. Sherman J, Le C, Lamers V, Eckelman M. Life cycle greenhouse gas emissions of anesthetic drugs. Anesth Analg 2012; 114: 1086–1090.
- 12. McAlister S, Ou Y, Neff E, et al. The environmental footprint of morphine: a life cycle assessment from opium poppy farming to the packaged drug. BMJ Open 2016; 6: e013302.
- 13. Eckelman M, Mosher M, Gonzalez A, Sherman J. Comparative life cycle assessment of disposable and reusable laryngeal mask airways. Anesth Analg 2012; 114: 1067–1072.
- 14. Thiel CL, Eckelman MJ, Guido R, et al. Environmental impacts of surgical procedures: life cycle assessment of hysterectomy in the US. Environ Sci Technol 2015; 49: 1779–1786.
- 15. Haines A, Ebi K. the imperative for climate action to protect health. N Engl J Med 2019; 380: 263–273.
- 16. National Transport Commission. Carbon dioxide emissions intensity for new Australian light vehicles 2018 (information paper). June 2019. https://www.ntc.gov.au/sites/default/files/assets/files/Carbon%20dioxide%20emissions%20intensity%20for%20new%20Australian%20light%20vehicles%202018.pdf (viewed Nov 2019).
- 17. Douglas Hanly Moir Pathology. Pathology collection guide for doctors. 2019. https://www.dhm.com.au/media/Multisite8303/dhm_pathology-collection-guide-for-doctors_2019.pdf (viewed Feb 2020).
- 18. Dorevitch Pathology. Preanalytical systems tube guide, version 3.0 (document no. IS‐COL‐003). Oct 2016. http://www.dorevitch.com.au/siteassets/dorevitch/2-practitioners/specimen-collection-guides/dp0450v2-preanalytical-system-tube-guide-web.pdf (viewed Feb 2020).
- 19. Wernet G, Bauer C, Steubing B, et al. The ecoinvent database version 3 (part I): overview and methodology. Int J Life Cycle Assess 2016; 21: 1218–1230.
- 20. European Commission Joint Research Centre: Institute for Environment and Sustainability. International Reference Life Cycle Data System (ILCD) handbook: recommendations for life cycle assessment in the European context (EUR 24571 EN). Luxembourg: Publications Office of the European Union, 2011. https://eplca.jrc.ec.europa.eu/uploads/ILCD-Recommendation-of-methods-for-LCIA-def.pdf (viewed Jan 2020).
- 21. Ciroth A, Muller S, Weidema B, Lesage P. Empirically based uncertainty factors for the pedigree matrix in ecoinvent. Int J Life Cycle Assess 2016; 21: 1338–1348.
- 22. Wernet G, Conradt S, Isenring HP, et al. Life cycle assessment of fine chemical production: a case study of pharmaceutical synthesis Int J Life Cycle Assess 2010; 15: 294–303.
- 23. Australian Department of Human Services. Medicare item reports. http://medicarestatistics.humanservices.gov.au/statistics/mbs_item.jsp (viewed Feb 2020).
- 24. Thiel CL, Woods NC, Bilec MM. Strategies to reduce greenhouse gas emissions from laparoscopic surgery. Am J Public Health 2018; 108 (Suppl 2): S158–S164.
- 25. Bell KJL, Doust J, Glasziou P, et al. Recognizing the potential for overdiagnosis: are high‐sensitivity cardiac troponin assays an example? Ann Intern Med 2019; 170: 259.
- 26. Bjørn Morten H. Too much technology. BMJ 2015; 350: h705.
- 27. Spelman D. Inappropriate pathology ordering and pathology stewardship. Med J Aust 2015; 202: 13–15. https://www.mja.com.au/journal/2015/202/1/inappropriate-pathology-ordering-and-pathology-stewardship
- 28. Pathirana T, Clark J, Moynihan R. Mapping the drivers of overdiagnosis to potential solutions. BMJ 2017; 358: j3879.
- 29. Rao GG, Crook M, Tillyer ML. Pathology test: is the time for demand management ripe at last? J Clin Pathol 2003; 56: 243–248.
Abstract
Objectives: To estimate the carbon footprint of five common hospital pathology tests: full blood examination; urea and electrolyte levels; coagulation profile; C‐reactive protein concentration; and arterial blood gases.
Design, setting: Prospective life cycle assessment of five pathology tests in two university‐affiliated health services in Melbourne. We included all consumables and associated waste for venepuncture and laboratory analyses, and electricity and water use for laboratory analyses.
Main outcome measure: Greenhouse gas footprint, measured in carbon dioxide equivalent (CO2e) emissions.
Results: CO2e emissions for haematology tests were 82 g/test (95% CI, 73–91 g/test) for coagulation profile and 116 g/test (95% CI, 101–135 g/test) for full blood examination. CO2e emissions for biochemical tests were 0.5 g/test CO2e (95% CI, 0.4–0.6 g/test) for C‐reactive protein (low because typically ordered with urea and electrolyte assessment), 49 g/test (95% CI, 45–53 g/test) for arterial blood gas assessment, and 99 g/test (95% CI, 84–113 g/test) for urea and electrolyte assessment. Most CO2e emissions were associated with sample collection (range, 60% for full blood examination to 95% for coagulation profile); emissions attributable to laboratory reagents and power use were much smaller.
Conclusion: The carbon footprint of common pathology tests was dominated by those of sample collection and phlebotomy. Although the carbon footprints were small, millions of tests are performed each year in Australia, and reducing unnecessary testing will be the most effective approach to reducing the carbon footprint of pathology. Together with the detrimental health and economic effects of unnecessary testing, our environmental findings should further motivate clinicians to test wisely.