


Globally, 2022 was the eighth warmest year on record, with a persistent La Niña event resulting in a cooler year than would otherwise have been the case. In Australia, the La Niña event contributed to 2022 being the ninth‐wettest year on record. Sydney had its wettest year on record in 2022, with its 2530 mm of rainfall being 121% higher than the average in recent decades.1 Records continued to fall in 2023, with the hottest June on record, 3–10 July being the hottest week the world has ever recorded, and the global average temperature for the month of July being the highest on record for any month — heatwaves and wildfires were seen across the Northern Hemisphere.2,3 Global average temperature inches closer and closer to 1.5°C above pre‐industrial levels despite clear authoritative warnings that crossing this threshold risks unleashing far more severe climate change impacts than we have already seen,4,5,6 including more frequent and severe droughts, heatwaves and rainfall.7
The goal of the Paris Agreement, a legally binding international treaty on climate change, to which Australia is a Party, is to hold “the increase in the global average temperature to well below 2°C above pre‐industrial levels” and pursue efforts “to limit the temperature increase to 1.5°C above pre‐industrial levels”.7,8 Recognising the need to track progress towards this goal and that human health is central to the climate change issue, the Lancet Countdown, an international interdisciplinary research collaboration, has conducted annual global assessments of the links between health and climate change since 2017.5 The MJA–Lancet Countdown on health and climate change in Australia was established in 2017 and produced its first national assessment in 2018 and annual updates in 2019, 2020, 2021 and 2022.9,10,11,12,13
The 2023 MJA–Lancet Countdown report represents the work of 14 institutions (11 Australian, one United States, one New Zealand, and one Vietnamese) in collaboration with University College London, brought together by an established partnership between The Lancet and the Medical Journal of Australia. The collaboration tracks the links between public health and climate change across five domains: health hazards, exposures and impacts; adaptation, planning and resilience for health; mitigation actions and health co‐benefits; economics and finance; and public and political engagement.
In this, the sixth report of the MJA–Lancet Countdown, we track progress on an extensive suite of indicators across these five domains, accessing, assessing and presenting the latest data and further refining and developing our analyses.
Methods
We tracked progress on health and climate change in Australia across 25 indicators within the five broad domains (Box 1). Where possible, we adopted the methods used by the Lancet Countdown, including those used in its 2023 report.5 Where more appropriate for an Australia‐focused assessment, or where it was possible to refine or improve on the original method as more precise and comprehensive data or methods were available at the national level, the method for the Australian indicators was modified or an alternative method was used. As an annual report, it is necessary for the indicators to be based on data that are produced annually and that are available to the authorship team by about May each year (preferably for the previous year), such that the required analysis can be completed and the annual manuscript can be written ready for submission to the MJA by the end of August.
Consistent with developments in the Lancet Countdown reports of 2021 and 2022,14,15 Section 3 introduces a new indicator, Energy system and health (indicator 3.1), which merges the previous three indicators in this area (Carbon intensity of the energy system; Coal phase‐out; and Zero carbon emission electricity). We also include three text boxes this year. The first discusses climate change impacts on Aboriginal and Torres Strait Islander health and wellbeing, including potential methods that could be used for a future indicator in this area. In recognition of Australia's position and relationships within the Western Pacific region, the second text box discusses health and climate change in New Zealand — building on our profile of this country in our 2022 report13 and continuing our transition to an Oceania focus — and the third text box discusses health and climate change in Vietnam. Our selection of Vietnam was based on the opportunity to profile a Western Pacific country not currently included in the reporting by other Lancet Countdown regional centres5 and within the MJA–Lancet Countdown collaboration's current capacities.
Full details of our methods, data and caveats are provided for each indicator in the Supporting Information and are numbered accordingly. We also briefly summarise the method for each indicator within the text here.
Section 1: Health hazards, exposures and impacts
Climate change presents a broad range of hazards to human health, and its impacts, including both disease and death, can be direct or indirect. This section tracks health‐relevant exposures to climate hazards in Australia, including exposure of vulnerable populations to heatwaves, the risk of heat stress and physical activity, exposure to very high and extreme bushfire danger, and the extent and intensity of drought. We consider the most recent year for which data are available, but also, more importantly, the overall trends over recent decades.
Exposure of vulnerable populations to heatwaves
Multiple studies in recent years have shown the effects of heatwaves on excess ambulance demand, hospital admissions and mortality in several sites across Australia.16,17,18 This indicator tracks change in a measure of heatwave intensity — the excess heat factor — as it applies to human health.19,20 The excess heat factor is based on three‐day‐averaged daily mean temperatures. Box 2 shows the Australian averaged accumulated excess heat factor over the past 20 heatwave seasons (November–March).
Calculating two trends through these data (the 20 years presented, and a longer 50‐year trend extending from 1973–1974 to 2022–2023) enables an assessment of long term change, which demonstrates a 35% increase in excess heat factor over this 20‐year period, as well as an understanding of the more recent shorter term change, with a 12% rise seen over the past 20 heatwave seasons. Weighting the accumulated excess heat factor according to the population density has a somewhat different result, with the 50‐year and 20‐year heatwave season accumulated excess heat factor rise being 28% and –2%, respectively (Supporting Information 1.1). The 20‐year trend changes are smaller than those reported in the 2020, 2021 and 2022 MJA–Lancet Countdowns,11,12,13 in part because the three summers 2020–2021 to 2022–2023 were noticeably cooler than the 2019–2020 summer. This situation will likely reverse with the 2023–2024 El Niño‐dominated summer.
Heat and physical activity
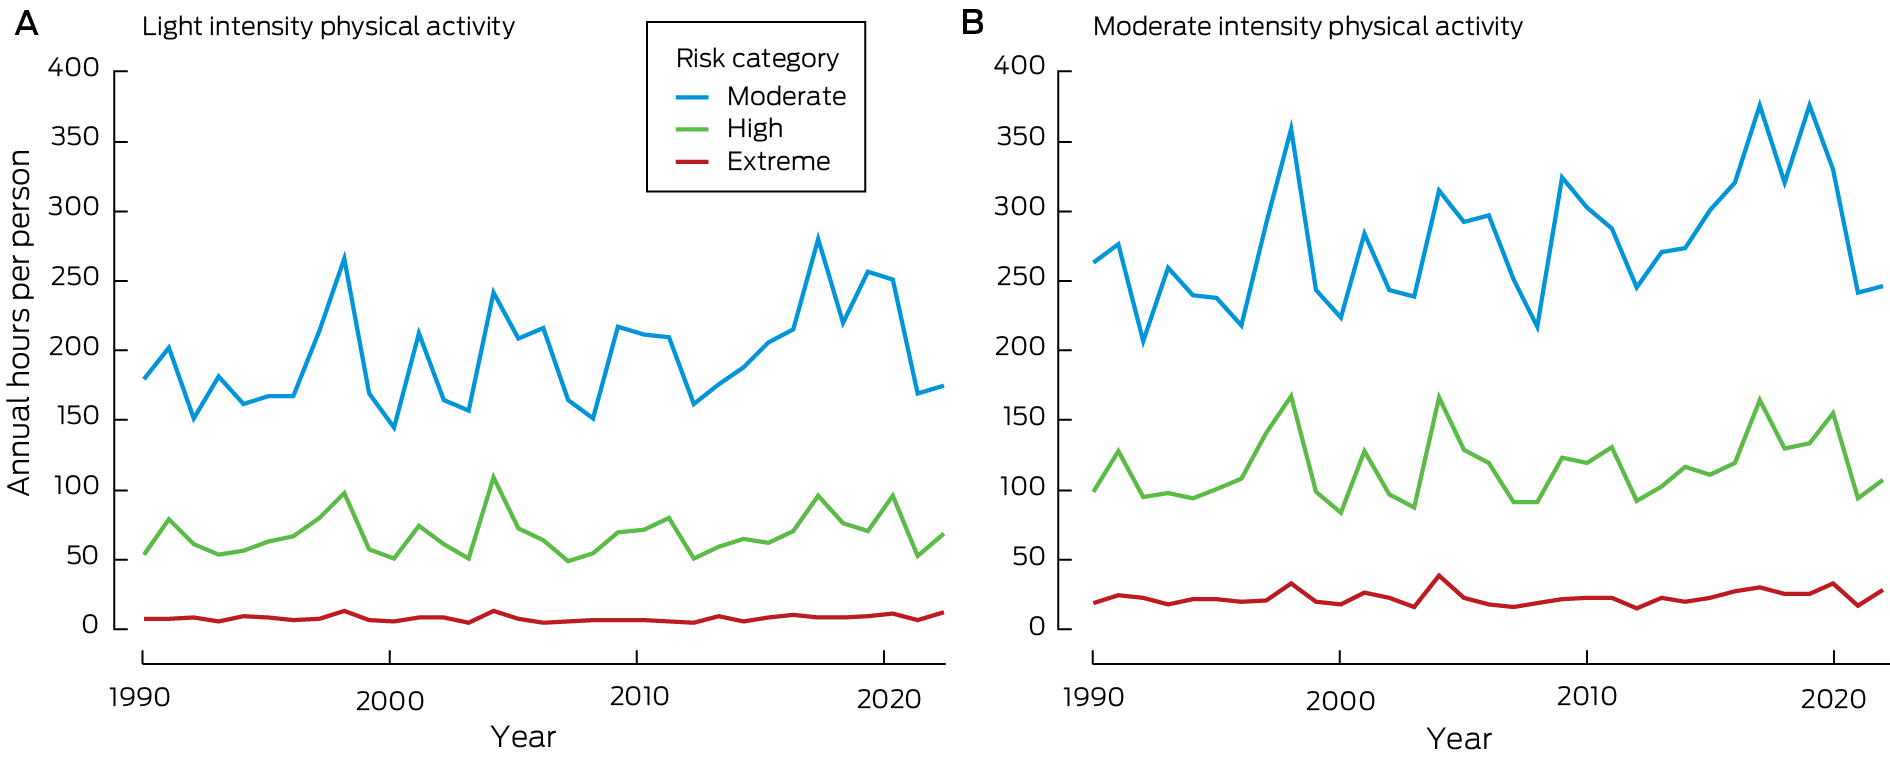
Physical and sporting activities are an important part of life in Australia. They can contribute significantly to both physical and mental health as well as strengthening communities and driving positive social change.21,22 This indicator follows the estimated heat stress risk of people participating in outdoor physical and sporting activities across Australia and in large cities within each state and territory. As detailed in the Sports Medicine Australia Extreme Heat Policy, moderate risk indicates that additional rest breaks should be undertaken. High risk requires the additional implementation of active cooling strategies (eg, water dousing), and extreme risk indicates that activities should be suspended.23 The policy splits sports into five risk classification groups according to the combined effects of exercise intensity and clothing/equipment worn.23 This indicator focuses on the first risk group “light intensity physical activity”, which includes leisurely walking, and the third risk group “moderate intensity physical activity”, which includes soccer, tennis, netball and similar sports and activities.
For light intensity physical activity, conditions across Australia in 2022 led to 174.8, 68.3 and 12.5 hours per person above the moderate, high and extreme heat stress risk threshold, respectively (Box 3, A). Comparing five‐year averages from 2018–22 to a baseline of 1991–95, the average number of annual hours per person above the moderate, high and extreme risk threshold, was 41.7 (+ 24.1%), 9.9 (+ 15.7%), and 1.7 (+ 21.0%) higher in 2018–22. For moderate intensity physical activity, conditions in 2022 led to 246.1, 108.1 and 29.4 hours per person above the moderate, high and extreme heat stress risk threshold, respectively (Box 3, B). In 2018–2022 compared with 1991–1995, the average values above the moderate, high and extreme heat stress risk thresholds were 58.4 (+ 23.9%), 20.8 (+ 20.1%), and 4.0 (+ 18.0%) annual hours per person higher for moderate intensity physical activity.
Bushfires
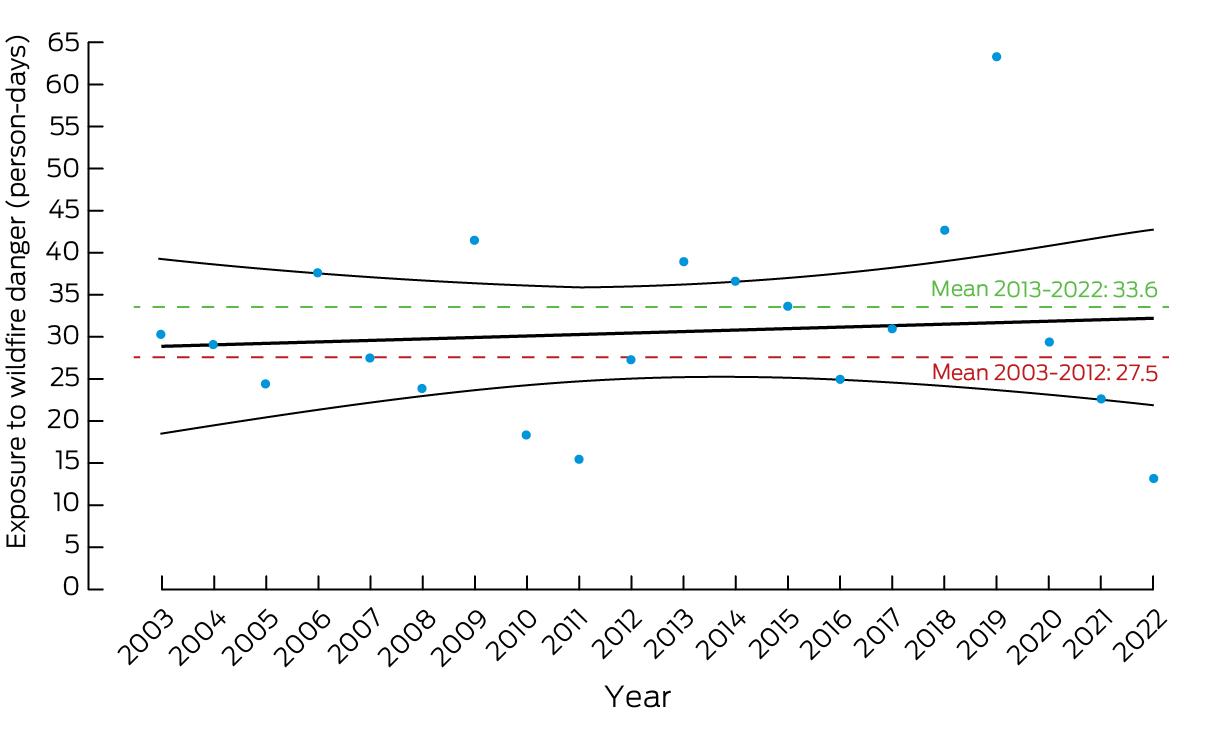
Bushfires can significantly impact human health, directly or indirectly, through direct exposure to fires or from the smoke emitted by the burnt landscape.24,25 Mental health and wellbeing are also greatly affected, as people live through traumatic experiences such as the threat of the potential loss of life and property. Anxiety, post‐traumatic stress disorder and depression are among the most reported mental health problems.26 Exposure to high bushfire danger is calculated based on satellite data (Supporting Information 1.3) and represents the number of days within a year in which people were exposed to very high or extremely high bushfire danger (fire danger index ≥ 5 on a scale of 1–6).27 After the 2019–20 Black Summer bushfires, Australians have been exposed to lower bushfire danger conditions (Box 4). Nevertheless, the overall trend shows an increase over time in the exposure to very high or extremely high bushfire danger, with average annual exposure in the past ten years (2013–2022) considerably increasing to 33.6 days per person from 27.5 days per person in the previous ten years (2003–2012).
Drought
Drought is one of the most important climate extremes in Australia, with substantial adverse impacts on both physical and mental health. The intensity of droughts was determined in this indicator by employing the standardised precipitation evapotranspiration index (SPEI). The SPEI utilises monthly rainfall and temperature data to capture the combined impacts of temperature rise and aridity. Its purpose is to quantify the deviation from a baseline climate (1950–2005) and measure the occurrence of drought beyond average conditions. As shown in Supporting Information, figure A1, during Autumn 2023, Australia was generally dry, with rainfall that was 10.1% below the average.28 Much of coastal and northern New South Wales, adjacent areas of southern Queensland, and north‐eastern South Australia experienced below‐average rainfall during the autumn season. May 2023 was Australia's second‐driest May on record. For Western Australia, May rainfall was 88% below the 1961–1990 average, and the lowest on record.29
Conclusion
The heat‐related indicators in this section show the short‐lived influence of the La Niña event in 2022, with all being lower than was the case just a few years ago during the most recent El Niño conditions. However, the long term trend for all four indicators is upwards — to increasing exposure to these climate hazards. Although data and methodological limitations prevented the reintroduction of an Indigenous health and climate change indicator this year, Box 5 discusses climate change impacts on Aboriginal and Torres Strait Islander health and wellbeing, including potential methods that could be used for a future indicator in this area.
Section 2: Adaptation, planning and resilience for health
Australia last conducted a national climate change assessment in 2008. Since then, various states and territories and smaller jurisdictions have undertaken their own assessments in a range of sectors, more recently with health being included as a focus for some state and territory governments in recognition of the substantial health implications associated with climate change. With some large scale catastrophic events (floods, bushfires) having occurred — bringing major consequences for health and wellbeing, and mass population displacement — there is a growing acknowledgement that improved data, planning and adaptation will enable better response to disasters when they occur and alleviate future risks to health.
Health adaptation plans and assessments
The National Climate Risk Assessment, currently underway, provides a framework that will inform a National Adaptation Plan, including priorities for strengthening climate adaptation and resilience, and enabling consistent monitoring of climate risks across Australia.38 This plan builds on the National Climate Resilience and Adaptation Strategy 2021–2025 that supports efforts across four domains (including a social domain).
Encouragingly, at state and territory level, the NSW Climate Change Adaptation Strategy39 commits the NSW Government to the publication of a whole‐of‐society adaptation action plan based on a climate change risk and opportunity assessment. This plan will align with a range of adaptation metrics, such as the number of people hospitalised because of heat stress or poor air quality due to bushfires.
In December 2022, the WA Government released Climate Resilient WA: Directions for the state's Climate Adaptation Strategy,40 which set the foundations for WA's Climate Adaptation Strategy, released in 2023 (https://www.wa.gov.au/government/publications/climate‐adaptation‐strategy). In addition, a health sector adaptation plan, currently in preparation, will assess climate risks to health and wellbeing, and actions to enhance the climate resilience of the health sector and the wider community (such plans already exist in some states, such as Queensland and Victoria).
With a change of national government in 2022 and as severe climate events are being observed, policy makers are taking increased interest in the research, including widespread consultation by the newly established National Health, Sustainability and Climate Unit on a National Health and Climate Strategy, which was published in 2023 (https://www.health.gov.au/sites/default/files/2023‐12/national‐health‐and‐climate‐strategy.pdf).
Despite considerable progress, translating the increasing scientific evidence of the health effects of climate change in Australia into cross‐sectoral and health system specific policy action remains a challenge. Considering the public health impacts on communities, co‐designing with Aboriginal and Torres Strait Islander and other communities41 is a key enabler of effective adaptation planning in Australia.
Climate information for health
The Bureau of Meteorology's routine heatwave and ultraviolet radiation information services are available to the public and health sector on its website, mobile app, and other channels. Web traffic to the heatwave website (http://www.bom.gov.au/australia/heatwave) during the period 1 November 2022 to 31 March 2023, measured using Google Analytics, showed 112 512 unique views (an average of 745 views/day), an increase of about 8% from the 2021–2022 heatwave season of 104 612 (692 views/day). The past several years have been dominated by La Niña conditions and much milder than the 20‐year peak conditions that occurred in 2018–2019 (see indicator 1.1 Exposure of vulnerable populations to heatwaves) and the Black Summer of 2019–2020. Web traffic to the website during the 2019–2020 heatwave season was 180 113, which was about 60% higher than the 2022–2023 season. The 20‐year peak of 2018–2019 attracted 210 093 unique views (1391 views/day), which was about 87% higher than the 2022–2023 season. In all cases, web visits peaked on days with record temperatures or heatwaves.
National smoke forecasts to assist Australian fire agencies with their planned burn decisions are being developed in collaboration with the Commonwealth Scientific and Industrial Research Organisation (CSIRO) and fire agencies. These were used by state health authorities to help inform air quality advice to the community during the 2019–20 Black Summer bushfires.
The Bureau of Meteorology, together with the Victorian Department of Health, and the University of Melbourne and Deakin University, provide thunderstorm asthma forecasts in Victoria during its grass pollen season, October–December.
Detection, preparedness and response to health emergencies
The International Health Regulations (2005)42 (IHRs) are an instrument of international law designed to prevent, protect against, control and provide a public health response to potential public health emergencies and the international spread of infectious disease. With weather and climate causing or contributing to many public health emergencies and the spread of many infectious diseases, the IHRs serve as an important indicator of national climate change and health adaptive capacity. Countries report to the World Health Assembly on the implementation of the IHRs across 15 capacities.
For this indicator, we track Australia's reported implementation of the health emergency management capacity from 2018 to 2022. Australia's score for this capacity remained at 80% in 2022, having dropped to this level for the first time in 2021 since it was introduced by the World Health Organization (WHO) in 2018 (Box 6). For continuity with previous MJA–Lancet Countdown reports,10,12 we also report Australia's surveillance and public health human resources capacities. While the latter remained at 80% in 2022, the former increased to 100%, up from 80% in 2021 and the highest it has been over the five‐year period. We also highlight that Australia's zoonotic diseases capacity has been well below 100% over this period, and that the current 60% is below the global average. However, Australia's health services provision capacity remained at 100% in 2022 (Supporting Information 2.3).
Migration and displacement
The impacts of climate change contribute to population displacement, migration and resettlement, with consequences for human health.44 This indicator tracks population exposure to future sea level rise of one metre, and forced population displacement due to weather‐related disaster.
Based on 2022 population data, 167 743 people in Australia live less than one metre above sea level, an increase of almost 4000 on the number in our previous annual report.13 Coastal adaptation strategies include protection of vulnerable areas, accommodation of risks through enhanced coping capacity, and retreat of populations — with rising sea levels, retreat of low‐lying coastal settlements will become more urgent.45
In 2021, 48 937 people were forcibly displaced by weather‐related disasters in Australia, including floods (n = 42 139), storms (n = 5569), and bushfires (n = 1229).46 There is an upward trajectory in weather‐related displacement, even adjusting for population increase (Box 7). With more frequent and intense extreme weather events in Australia, such as floods and bushfires, and with a rapidly closing window to limit global warming to below 2°C,48,49 climate change will contribute to forced displacement and associated health risk.
Bushfire adaptation
As highlighted elsewhere in this report (eg, indicator 1.3 Bushfires) and in our 2020 report that focused on Australia's 2019–20 Black Summer,11 bushfires are a major climate‐related extreme event with direct and indirect consequences for human health. To track progress on bushfire adaptation in Australia, we analyse aerial and terrestrial firefighting capacity (Box 8). Although National Aerial Firefighting Centre aircraft services have increased since 2007–08, from just over 30 to the current 161, the number of volunteer firefighters and support staff in Australia has decreased since 2015–16 and is currently at its lowest point since the Productivity Commission started reporting on this area of government services in 2009–10 (Supporting Information 2.5).
Conclusion
Previous MJA‐Lancet Countdown reports have consistently noted Australia's complete lack of progress nationally in health assessment and adaptation, with some scattered progress among states and territories. This year, however, marks a welcome step‐change in the Australian Government's activity in this space, with consultations now underway for both a multi‐sectoral National Climate Change Risk Assessment, and the publication of a National Health and Climate Strategy. This change of direction is long overdue but has the potential to help Australia avoid some of the worst consequences of climate change on population health and wellbeing in the future. There have been some significant opportunities to learn from experienced major events both within Australia (such as the Black Summer bushfires of 2019–20 and the extensive flooding in southeast Queensland and northern NSW in 2022), as well as from recent international significant events such as the extreme heat in the northern hemisphere summer of 2023. Adaptation planning and disaster response will be reliant on availability and access to quality climate information, wide ranging expertise from across multiple sectors, and effective communication. Future reports will look at the progress being made in the development and implementation of the forthcoming national assessment and the health and climate strategy.
Section 3: Mitigation actions and health co‐benefits
Australia's energy system continues to be a major source of greenhouse gas emissions and air pollution. Although there has been some overall progress in reducing the carbon intensity of Australia's energy system, Australia faces challenges in transitioning to a low carbon economy, particularly in terms of phasing out the use of coal. The country's renewable energy generation is increasing, but it lags behind that of other nations. This section also examines clean household energy adoption, exposure to particulate matter air pollution in cities, sustainable transport, and diet‐related health impacts, as well as the health care sector's greenhouse gas emissions and the need for concrete actions to reduce its environmental footprint. Policy makers must prioritise the implementation of measures to address climate change with a view towards achieving health co‐benefits through sustainable practices and a focus on renewable energy sources, cleaner transport options, and healthier dietary habits.
Energy system and health
Energy systems play a significant role in generating greenhouse gas emissions and also contribute substantially to air pollution.15 Consistent with previous reports, we define the carbon intensity of the energy system as “the tonnes of CO2 emitted for each unit of primary energy supplied” (tCO2‐e).12 The latest available data now extend to 2021 for Australia, Brazil, Germany and the United States, and up to 2020 for the People's Republic of China and for India (Supporting Information, figure A3). The previous report showed a substantial decrease in the carbon intensity of total primary energy supply due to the COVID‐19 pandemic, but the new data confirm that a rebound did occur in 2021. Overall, the carbon intensity of Australia's energy system is in decline; however, Australia continues to exhibit the highest carbon intensity in its total primary energy supply compared with the analysed countries and has not yet made any substantial progress towards decarbonising the energy system.
Coal phase‐out remains of critical importance for Australia due to the dominant role of coal in the country's energy system, alongside oil and gas (Box 9). In 2022, Australia passed the Climate Change Act, which sets somewhat more ambitious targets than previous policies for emissions reductions by 2030 and achieving net zero by 2050.51 The Australian Government plans to achieve about 80% renewable energy in the electricity grid by 2030.52 Individual states (eg, Queensland) have also announced plans to transition away from coal.52 Electricity generation from low carbon energy sources (solar, wind, hydroelectricity) is on the rise in Australia. However, coal still accounts for two‐thirds of domestic energy production, one‐third of total energy supply, and over half of electricity generation (a decrease from 80% in 2005).53 In addition, Australia continues to hold a significant position as coal producer and is actively developing coal reserves for export.53 After the COVID‐19 pandemic, global trade in coal has rebounded.53 In the international market, Australia's coal is expected to gain market share in countries like Japan and South Korea as they seek alternatives to Russian coal.52 It is evident that a substantial acceleration of the coal phase‐out is crucial if Australia is to transition to a lower carbon economy.
We previously reported that 17% of Australia's electricity came from renewable energy sources in 2018. This figure increased to over 20% in 2019, to over 30% in 2021, and to 35.9% in 2022.12,54,55 While this is a substantial increase over the course of only a few years, Australia continues to lag behind other countries such as Germany or the United Kingdom that were well above 40% already in previous years.12
Clean household energy
In 2022, 310 000 new rooftop solar systems were added in Australia (nearly the same capacity as Australia's Eraring power station), meaning that household solar contributes to about one‐quarter of total renewable energy generation.56 Over 50 000 household batteries were installed in 2022 in Australia,56 up from 34 731 in 2021 and 23 796 in 2020.57 However, evidence regarding the use of unsustainable fuels and technologies for cooking, heating and lighting for Australia's remote and Indigenous communities is again lacking, alongside data on improvements regarding access to renewable energy sources.
Exposure to particulate matter air pollution in cities
This indicator uses information on average concentrations of fine particulate matter (PM2.5) air pollution in Australian cities. These were obtained for 2000–2020 from the National Air Pollution Monitor Database from the Centre for Air Pollution, Energy and Health Research58 derived from each state and territory government. Data for 2021–2023 were obtained from the Air Quality Visualisation System (AQVx) Application Programming Interface developed by AirRater and the Centre for Air Pollution, Energy and Health Research.59 Averages for cities were then averaged into state level monthly and annual time‐series, which are shown together in Box 10. The average city exposure in Australia has generally declined over time but has major fluctuations as a result of bushfires and dust storms. Some states experience significant seasonal variations — due to the dry season in the Northern Territory and the use of wood heaters in the cooler southern regions (for further information, see the Supporting Information).
The annual average PM2.5 concentrations in Australian cities were lower than in cities from many other countries, which can be as high as 35 μg/m3 annual average.60 However, they were still generally above the latest WHO annual air quality guideline of 5 μg/m361 but mostly below the Australian advisory reporting standard of 8 μg/m3, with the exceptions being due to years of high bushfire smoke or dust storm exposure, and in Western Australia where there are many sources of fine particulate matter from both natural and human emissions.
Sustainable and healthy transport
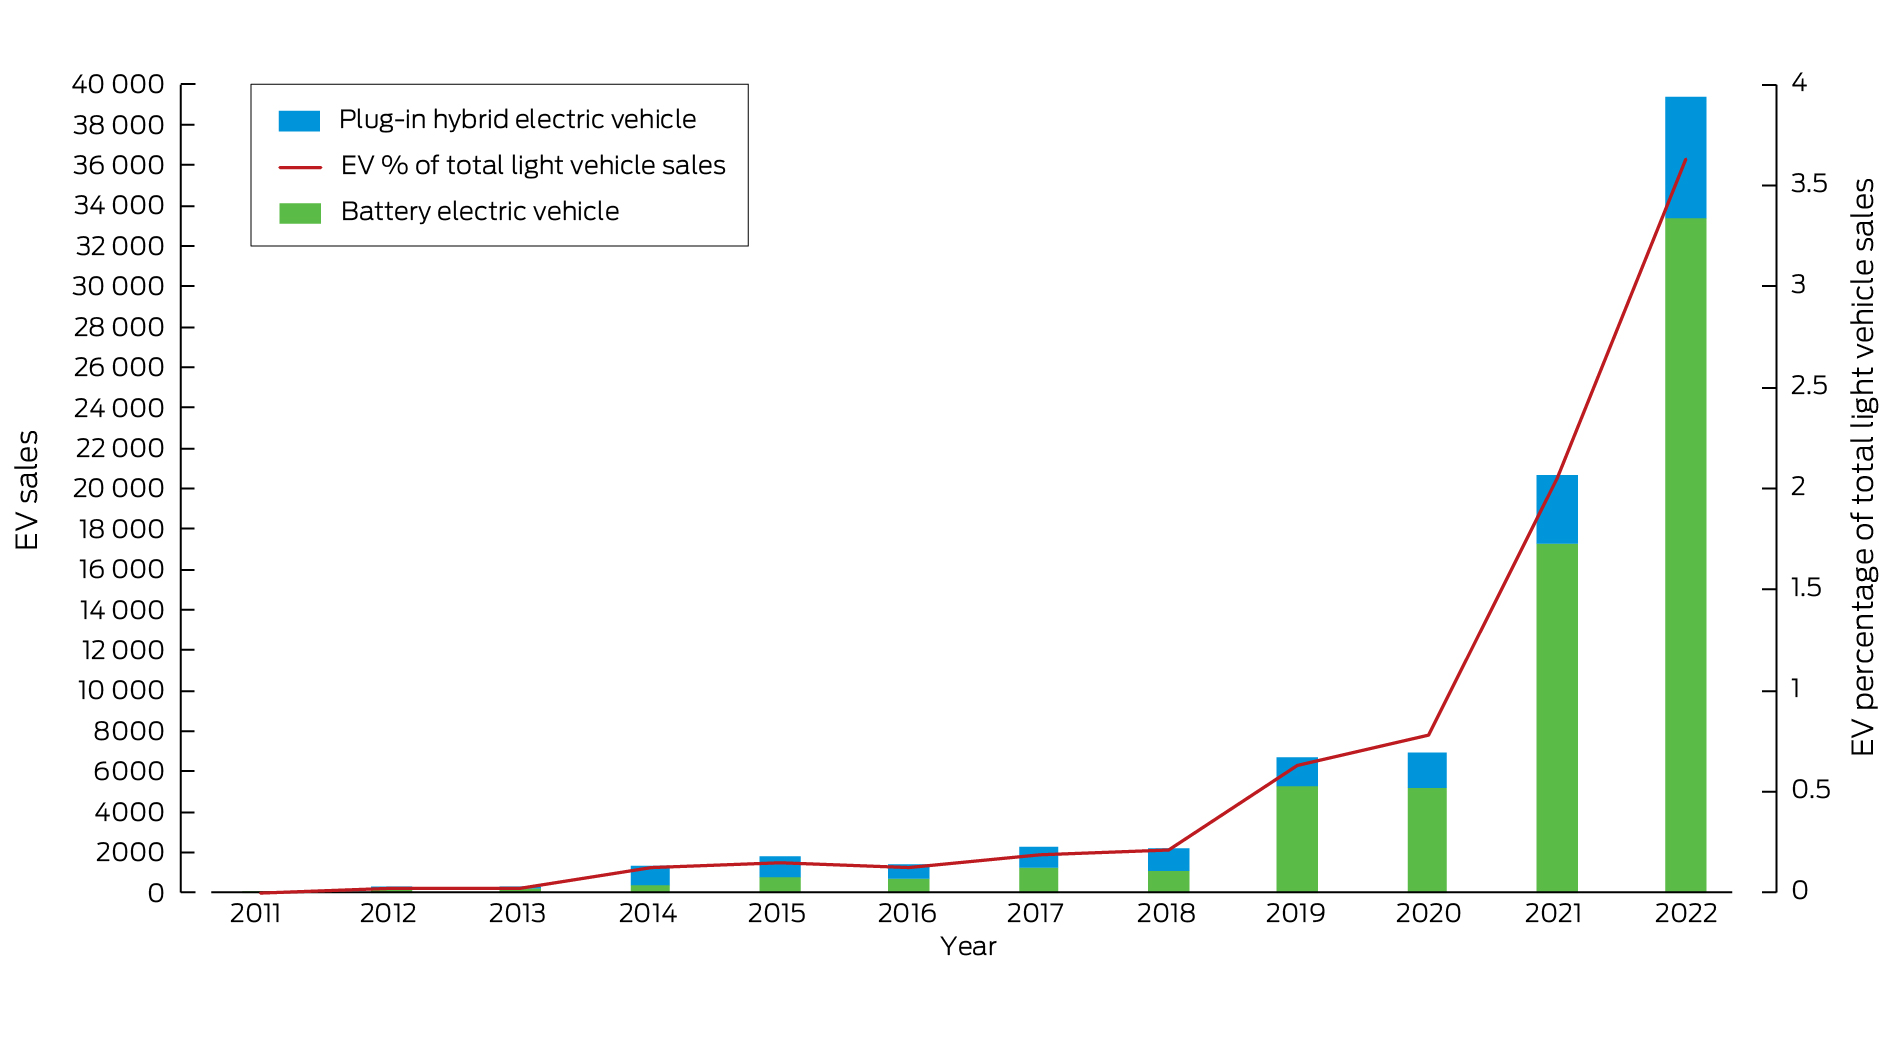
Sustainable and active transport is a key component of the mitigation of climate change and has a range of co‐benefits such as improving local air quality and physical fitness. As highlighted in Box 11, there has been a continued, albeit small, decline in fossil fuels beyond the decline observed due to the impact of the COVID‐19 pandemic. Fossil fuels still play a significant and leading role in the transport sector. The use of electricity continues to increase, especially over the past decade (Box 12).64 The increase in electricity is a direct impact of the increasing electric vehicle (EV) market in recent years. The sale of EVs has almost doubled over the past year, growing from 20 665 in 2021 to 39 347 in 2022 (Box 12).63 However, EVs still only accounted for 3.8% of all new vehicle sales in Australia in 2022, which is substantially behind the global average of 14% and the leading country Norway where 87% of new cars are electric.65
Although states and territories have offered rebates and incentives for EVs (with states such as Victoria no longer providing such incentives), there remains a lack of federally funded incentive programs for the purchase of EVs except for import tax discounts and fringe benefits tax exemptions.66 The most important impediment to reducing our current emissions is the lack of fuel‐efficiency standards that would require car makers to supply more EVs to the market to meet the strict emissions limits for their entire fleet. Australia is lagging most Organisation for Economic Co‐operation and Development (OECD) countries in not enacting such a policy. To reach its 2030 and 2050 decarbonisation targets, Australia needs to urgently invest in EV infrastructure, rebates and national fuel efficiency standards, along with other proactive policies (including incentive programs).
Emissions from agricultural production and consumption
Australia is a major producer and exporter of agricultural products. Animal products constitute the vast majority of greenhouse gas emissions, driven by methane produced by cattle and sheep (Box 13). Beef production is the largest single source, accounting for 54% of total production emissions in 2020, or around 1.8 tCO2‐e per person, with sheep and goat meat contributing 24% and dairy products 17%.
Emissions associated with net consumption within Australia reduced 44% between 1995 and 2020. However, total production emissions have only fallen 16% during this time, as modest reductions in domestic consumption of high carbon intensity foods, especially beef and lamb, have been largely offset by increased exports to Asia, Europe and the US.67 This presents a challenge to Australia's commitments to net zero agriculture by 2050, not only to reduce emissions but also to safeguard food production against extreme weather in the years ahead.68
Diet and health co‐benefits
This indicator presents the deaths attributable to dietary risks in 2019 and 2020 in Australia. In that time period, the total number of diet‐related deaths in Australia was 87 166. High red meat and processed meat consumption significantly contributed to this (accounting for 20%), as did insufficient consumption of fruit and vegetables (29%). Ninety‐four per cent of Australian adults do not meet the recommendations for daily fruit and vegetable consumption.69 Thousands of lives could be saved in Australia each year by increasing fruit and vegetable consumption and lowering population level meat consumption. Adherence to the dietary guidelines would also have positive environmental impacts — evidence shows that diets consistent with Australian dietary guidelines have a much lower climate footprint.70
Health care sector emissions
This indicator presents a snapshot of emissions from Australia's health care sector. In 2020, Australia's total emissions were 28.9 Mt, which includes emissions from a range of greenhouse gases that are emitted directly by the health sector, and emissions resulting from the demand of goods and services for running health care operations. Such analysis of direct as well as indirect impacts of Australia's health sector is made possible by input–output analysis, as outlined in the methods and data in the 2023 Lancet Countdown report.5
In comparison to Australia's health sector emissions in 2019 (22.1 Mt),13 there has been a 30% increase in total emissions in 2020 and a 28% increase in per capita emissions from 878.3 kg per capita in 2019 to 1125.2 kg per capita in 2020. Interestingly, Australia is ranked eleventh highest in the world in terms of the nation's health care sector position with respect to its per capita greenhouse gas emissions.5 There is an urgent need to act to ensure implementation of concrete actions and commitments for carbon reduction practices in the health sector.71
Conclusion
The indicators show that, overall, Australia has made some progress towards mitigating its carbon intensity and achieving health co‐benefits. However, Australia is still highly dependent on coal. Clean household energy solutions, such as rooftop solar systems and household batteries, show promise. Nevertheless, it is important to note that we currently do not have enough data to evaluate these indicators for remote and Indigenous communities, where there is likely a gap in uptake. Exposure to particulate matter air pollution in cities is generally decreasing, but extreme events persist due to bushfires and dust storms. Sustainable transportation options such as EVs are gaining some momentum, but more robust policies and incentives are essential to accelerate uptake. Changes in dietary options can positively impact health outcomes and the environment. The health care sector's emissions have significantly increased, necessitating urgent action to reduce its carbon footprint. The findings underscore the importance of concerted efforts to mitigate climate change while promoting public health.
Section 4: Economics and finance
This section reports the financial cost of climate‐related extreme events and investigates existing economic and financial mechanisms to reduce carbon emissions and protect human health from the impacts of climate change. We focus on recent developments regarding the transition of the energy sector to a higher share of generation from renewables. Indicators measure investment in coal and clean energy generation, employment in the renewable energy sector and high carbon industries, as well as funds divested from assets involved in the extraction of fossil fuels or energy generation from fossil fuels. We also report trends in economic losses due to climate‐related extreme events, as well as developments on carbon pricing and the use of revenues from pricing carbon emissions.
Economic losses due to climate‐related extreme events
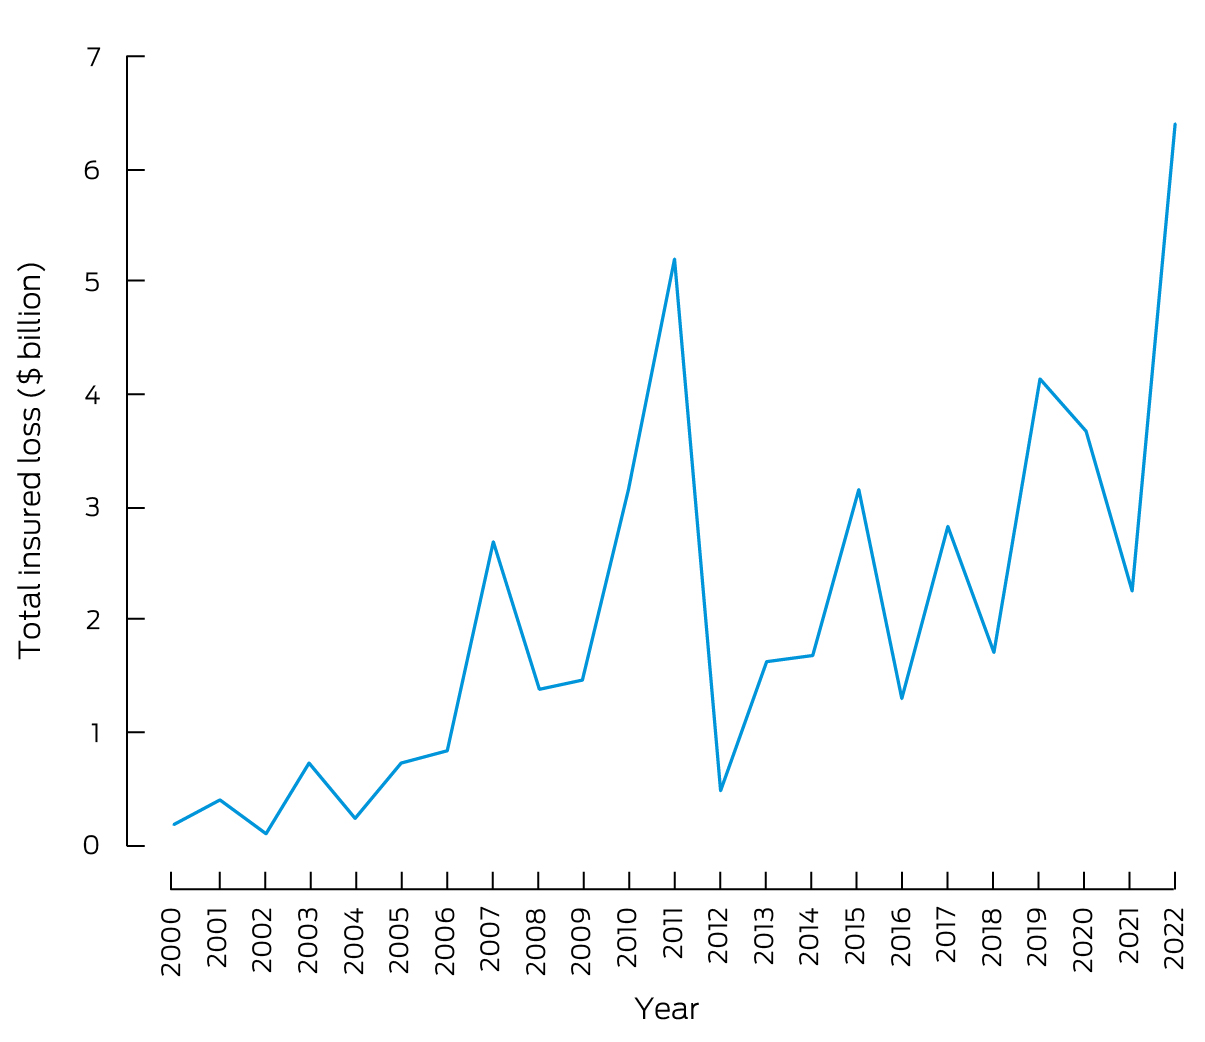
This indicator tracks the total insured economic losses from climate‐related disaster events and is based on numbers provided by the Insurance Council of Australia.72 Box 14 plots inflation‐adjusted (base year 2011) cumulative annual insured losses arising from bushfires, cyclones, flooding, hailstorms, storm flooding, and tornadoes. For 2022, actual total annual insured losses from catastrophes were $7.168 billion — the highest amount on record (equivalent to $6.411 billion after adjustment for inflation, as shown in Box 14). Losses could mainly be attributed to the record‐breaking floods across NSW and southeast Queensland in February and March 2022, where along with substantial damage to properties and infrastructure, 23 deaths were reported. Other major events included severe flooding events across Victoria, Tasmania and NSW in October 2022 and in central west NSW in December 2022. Building on our profile of health and climate change in New Zealand in our 2022 report,13 Box 15 discusses the economic costs and health impacts of the unprecedented rains and floods that hit this country in the first half of 2023.
Clean energy investment
This indicator reports investment in new coal and renewable zero carbon energy based on generation capacity in the Australian National Electricity Market (NEM). According to the latest report of the Australian Energy Regulator80 and the Australian Energy Market Operator (AEMO),81 currently there is no planned investment in new coal‐fired generation, while since 2013 over 2300 MW of black coal and 2500 MW of brown coal generation assets have been removed from the market (Box 16). Investment in renewable generation has accelerated: more than 12 500 MW of new utility scale solar, wind and battery investment has been added to the NEM over a four‐year period up to 2022.80 Based on data provided by the AEMO,81 between January 2022 and May 2023, another 2600 MW of solar capacity and 950 MW of wind generation capacity has been added. These numbers illustrate the substantial growth in variable renewable energy generation in Australia. However, reliability gaps will exist in all mainland NEM regions in the next decade, based on currently existing and committed developments only.82 Therefore, significant additional investment in large scale variable renewable energy generation and storage will be required.
Employment in low carbon and high carbon industries
This indicator reports full‐time equivalent (FTE) employment in low carbon and high carbon industries. Unfortunately, there has been no update for direct FTE employment in renewable energy activities in Australia by the Australian Bureau of Statistics since 2020. The latest estimate is available for the 2018–19 financial year, suggesting an FTE employment of 26 850.83 Supporting Information, figure A4 illustrates the substantial growth in FTE employment in the renewable sector since 2015–16 that can be expected to continue.
Employment in the mining sector was chosen as a key representative for employment in high carbon industries. FTE employment in mining operations has increased by 5.8% to about 200 000 for the 2021–22 financial year.84 The figures indicate that FTE employment in the mining sector in Australia has been growing and is substantially higher than FTE employment in the renewable energy sector. However, the Parliament of Australia85 reports that, according to Australian Bureau of Statistics Labour Account data, the number of people employed in the coal mining industry across Australia has been reduced by 26.2% between 2013–14 and 2021–22 from 46 400 to 34 300.
Funds divested from fossil fuels
We provide two indicators for tracking divestment from fossil fuels in Australia. The first indicator tracks the number of companies and organisations that have partially or entirely committed to divest themselves of assets involved in the extraction of fossil fuels and generation of energy from fossil fuels. Data from the Global Fossil Fuel Divestment Commitments Database86 suggest only a small increase to 215 divesting institutions in Australia over the past 12 months. Only two of these 215 are health care institutions.
The second indicator measures the withdrawal of capacity from coal‐fired emission intensive generation. According to the AEMO Integrated System Plan,87 currently announced closure timings imply that 8.4 GW of the current 23 GW of coal capacity in the NEM will withdraw by 2030, suggesting significant divestment from fossil fuels. In April 2023, Liddell power station in NSW with a total installed capacity of 2000 MW was decommissioned, while the retirement of several additional major coal‐fired plants has been scheduled for upcoming years.81 This includes the planned closure of Eraring (2880 MW, NSW) in 2025, Yallourn power station (1450 MW, Victoria) in 2028, and Vales Point B (1320 MW, NSW) in 2029.
Net value of fossil fuel subsidies and carbon prices
The expansion of the European Union's Carbon Border Adjustment Mechanism currently impacts only about one per cent of Australia's export industry. It is, however, the first signal for carbon‐intensive export countries, such as Australia, that if the federal government does not set ambitious emission reduction targets, they will be set internationally.88
Using the standard data sources for 2021, Australia's total fossil fuel subsidies were reported to be $8 billion.89 This subsidy figure is contested — a recent report from the Australia Institute suggests that the total assistance to fossil fuel producers and major users from all governments was $11.6 billion in 2021–22.90 In 2021, the total carbon price revenues were reported to be zero.91
The total emissions of CO2 were reported to be 465 Mt for 2021.92 The calculation of the subsidy per tonne of CO2 (subsidy/emissions) therefore equals $17.20 per tonne of CO2, with a carbon price per tonne of CO2 of zero. The net carbon price (the carbon price less the subsidy) equals $–17.20 per tonne of CO2.
Australia does not currently have an explicit carbon price. In 2023, Australia announced the implementation of the Safeguard Mechanism Emissions Trading Scheme (ETS) that came into effect on 1 July 2023. This scheme commenced in 2016, but was reformed in 2023 to include carbon credits, and only applies to industrial facilities that emit more than 100 000 tonnes of CO2 per year.93 Under this ETS, facilities can purchase Australian carbon credit units for $75 per tonne in 2023–24, with this price increasing each year.
Conclusion
The indicators illustrate a continued trend of rising economic losses from climate‐related extreme events such as bushfires, floods and storms. The indicators also show an acceleration in investment in generation capacity from renewables, while generation from fossil fuels has been further reduced and there are plans to shut down more major coal‐fired power plants in the near future. However, to ensure the reliability of the electricity system, significant additional investment in renewable generation and storage beyond existing and already committed projects will be required. The indicators also show that employment in the mining sector has further increased, while Australia has still not introduced a price on carbon emissions.
Section 5: Public and political engagement
Engagement of political leaders and communities is a precondition for action on health and climate change — for efforts to reduce health harms from climate change that is now unavoidable, and for efforts to curb greenhouse gas emissions and limit the extent of future climate change. The indicators reported in this section track engagement in health and climate change by media, governments, researchers, and research funders. This year, the methods used for these indicators in previous reports have again been adopted.
Media coverage of health and climate change
This indicator continues tracking the coverage of health and climate change content in 13 Australian national and regional major newspapers and Australian Broadcasting Cooperation (ABC) online news and transcripts. Data from 2008 to 2022 were retrieved from the Factiva media database. The total number of newspaper articles on health and climate change in 2022 (306) increased by 65% compared with 2021 (186) (Box 17), which was much higher than the global average increase of 12% in the same period.5 Compared with 10 years ago, the number of articles increased 3.25 times. The 2022 increase was partially due to the Australian federal election held in May 2022, where climate change was a clear focus of the political debate. The ABC online content on health and climate change in 2022 also increased by 50% compared with 2021. However, there is little mention of the co‐benefits of climate change mitigation and less focus on more disadvantaged or more marginalised groups such as Indigenous people.
Scientific engagement in health and climate change
The number of scientific publications on health and climate change in Australia continued to surge in 2022. We adopted the same methods as we did in 2022 using Scopus databases to search for relevant publications.13 We identified 407 new scientific publications in 2022, a 75% increase from 2021 (233). In contrast, the global number of scientific papers on health and climate change dropped by 8% in the same period.5 Compared with the number of publications 15 years ago, there was a 23‐fold increase (Supporting Information, figure A5). This indicates a growing interest and research capacity in the Australian scientific community on the topic. Original research articles accounted for 68% of the total publications (276 of 407). Most of the studies focused on health impact assessments and fewer studies on co‐benefits and community level adaptation. Very few (less than 2%) of the studies focused on Indigenous populations. Heat, bushfires and floods were the most focused exposures, while mental health, One Health, maternal health and birth outcomes were the most studied health outcomes. There was increasing research on net zero emission health systems.
Government engagement in health and climate change
Government engagement on health and climate change is an indication of the importance placed on the issue by decision makers.94 This indicator reports on government engagement by tracking bills, legislation, committees and inquiries in the parliaments of the Commonwealth of Australia and all eight states and territories. In 2022, the Parliament of Australia continued to show little engagement on climate change as a health issue. The issues of climate change and of health remain siloed in their respective portfolios with little acknowledgement of the interaction between the two. There was no legislation introduced to parliament that addressed climate change as a health issue, nor were there any committees or inquiries (Supporting Information, table A1). However, one bill — the Regulator Performance Omnibus Bill 2022 — mentioned greenhouse gases and health, although it did not refer to any explicit connection. There was more engagement on climate health in the state and territory parliaments compared with the national parliament. Five bills were introduced and 31 inquiries were held across the jurisdictions on climate health related topics (Supporting Information, tables A2 and A3).
Health and climate change research funding
Research on health and climate change in Australia is fundamental to Australia's understanding of and response to this critical issue. This indicator tracks the annual number of funded and not‐funded National Health and Medical Research Council (NHMRC) health and climate change grant applications from 2000 to 2022 (Box 18). The most recent year (2022) saw a considerable decrease in health and climate change grant applications compared with the previous three years (2019–2021), with a total of 12 applications. Compared with 2021, the success rate in 2022 also decreased substantially, to less than 10%, with just one of the 12 applications being funded (Supporting Information 5.4).
Conclusion
In 2022, there was more Australian media attention on health and climate change than in 2021, as measured by the number of articles on this topic in major newspapers and in ABC online content. This increase was partly attributable to media attention to climate change during the 2022 national election campaign. There was a 75% increase in scientific publications about health and climate change in Australia in 2022 compared with 2021. Only 2% of these articles address health and climate change issues for Indigenous people. In comparison with 2019–2021, there were less health and climate change grant applications to the NHMRC in 2022, with a success rate of less than 10%. While the national parliament showed limited evidence of engagement with climate change as a health issue in 2022, state and territory parliaments were more engaged. Having assessed Australia's progress on health and climate change in detail in this and the previous four sections, and in recognition of Australia's position in and relationships within the Western Pacific region, we also provide here for the first time a snapshot of health and climate change in Vietnam (Box 19), with which Australia can be compared.
Conclusion: the MJA–Lancet Countdown in 2023
This sixth report of the MJA–Lancet Countdown on health and climate change in Australia is particularly significant because it has captured the extreme floods of 2022, thus completing a picture of Australia's drought‐to‐flood cycle. Our earlier reports captured the other extreme — drought — in particular, the 2017–2019 drought, including its record low rainfalls, record high temperatures, heatwaves, and the unprecedented 2019–20 Black Summer bushfires.9,10,11,153 Climate change is making such extremes more frequent and intense.
The 2022 floods (and those of 2021) have had substantial health and economic impacts. In addition to deaths directly due to drowning, the 2021 floods alone resulted in the displacement of over 42 000 Australians. The 2022 floods across the eastern states of Australia were the major contributor to insured losses from climate‐related catastrophes of over $7 billion — the highest amount on record. Such losses are now driving up insurance premiums for all Australians and adding to the broader cost of living crisis.154
Australia is making some progress with respect to health and climate change. In 2022, the Australian Government increased its commitment to reduce greenhouse gas emissions, to 43% below 2005 levels by 2030, and the number of EV sales almost doubled compared with 2021. Advances are also being made in high level health and climate change adaptation planning, with the Australian Government releasing its National Health and Climate Strategy, adding to plans that have already been published by a number of states.
Overall, however, the urgency of substantial further enhancements in Australia's mitigation and adaptation responses to the enormous health and climate change challenge cannot be overstated. Australia's energy system, and its health care sector, currently emit an unreasonable and unjust proportion of greenhouse gases into the atmosphere.
Our inclusion of a profile of health and climate change in Vietnam in this report reveals interesting and important differences and similarities with Australia. Like Australia, Vietnam is exposed to a range of worsening climate extremes such as floods and droughts. However, research shows that in Vietnam the health impacts of these are experienced disproportionately by children, and its health sector currently has very limited capacity to respond and adapt to the escalating climate–health emergency. Vietnam's increasing incidence of dengue fever due to rising temperatures also serves as a timely reminder of the ongoing presence of this disease in Australia and the risk of its expansion here with climate change.
As the Lancet Countdown enters its second, and most critical phase, in the leadup to 2030, the depth and breadth of our assessment of health and climate change will be augmented to increasingly examine Australia in its regional context155 and to better measure and track key issues in Australia such as mental health and Aboriginal and Torres Strait Islander health and wellbeing.
Box 1 – The five sections and 25 indicators of the 2023 MJA–Lancet Countdown report
|
Section |
Indicator |
||||||||||||||
|
|
|||||||||||||||
|
1 Health hazards, exposures and impacts |
1.1 Exposure of vulnerable populations to heatwaves |
||||||||||||||
|
1.2 Heat and physical activity |
|||||||||||||||
|
|
1.3 Bushfires |
||||||||||||||
|
|
1.4 Drought |
||||||||||||||
|
2 Adaptation, planning and resilience for health |
2.1 Health adaptation plans and assessments |
||||||||||||||
|
2.2 Climate information for health |
|||||||||||||||
|
|
2.3 Detection, preparedness, and response to health emergencies |
||||||||||||||
|
|
2.4 Migration and displacement |
||||||||||||||
|
|
2.5 Bushfire adaptation |
||||||||||||||
|
3 Mitigation actions and health co‐benefits |
3.1 Energy system and health |
||||||||||||||
|
3.2 Clean household energy |
|||||||||||||||
|
|
3.3 Exposure to particulate matter air pollution in cities |
||||||||||||||
|
|
3.4 Sustainable and healthy transport |
||||||||||||||
|
|
3.5 Emissions from agricultural production and consumption |
||||||||||||||
|
|
3.6 Diet and health co‐benefits |
||||||||||||||
|
|
3.7 Health care sector emissions |
||||||||||||||
|
4 Economics and finance |
4.1 Economic losses due to climate‐related extreme events |
||||||||||||||
|
|
4.2 Clean energy investment |
||||||||||||||
|
|
4.3 Employment in low carbon and high carbon industries |
||||||||||||||
|
|
4.4 Funds divested from fossil fuels |
||||||||||||||
|
|
4.5 Net value of fossil fuel subsidies and carbon prices |
||||||||||||||
|
5 Public and political engagement |
5.1 Media coverage of health and climate change |
||||||||||||||
|
|
5.2 Scientific engagement in health and climate change |
||||||||||||||
|
|
5.3 Government engagement in health and climate change |
||||||||||||||
|
|
5.4 Health and climate change research funding |
||||||||||||||
|
|
|||||||||||||||
|
|
|||||||||||||||
Box 2 – Nationally averaged Australian heatwave season (November–March) accumulated excess heat factor (EHF) for the past 20 heatwave seasons (2003–2004 to 2022–2023)*
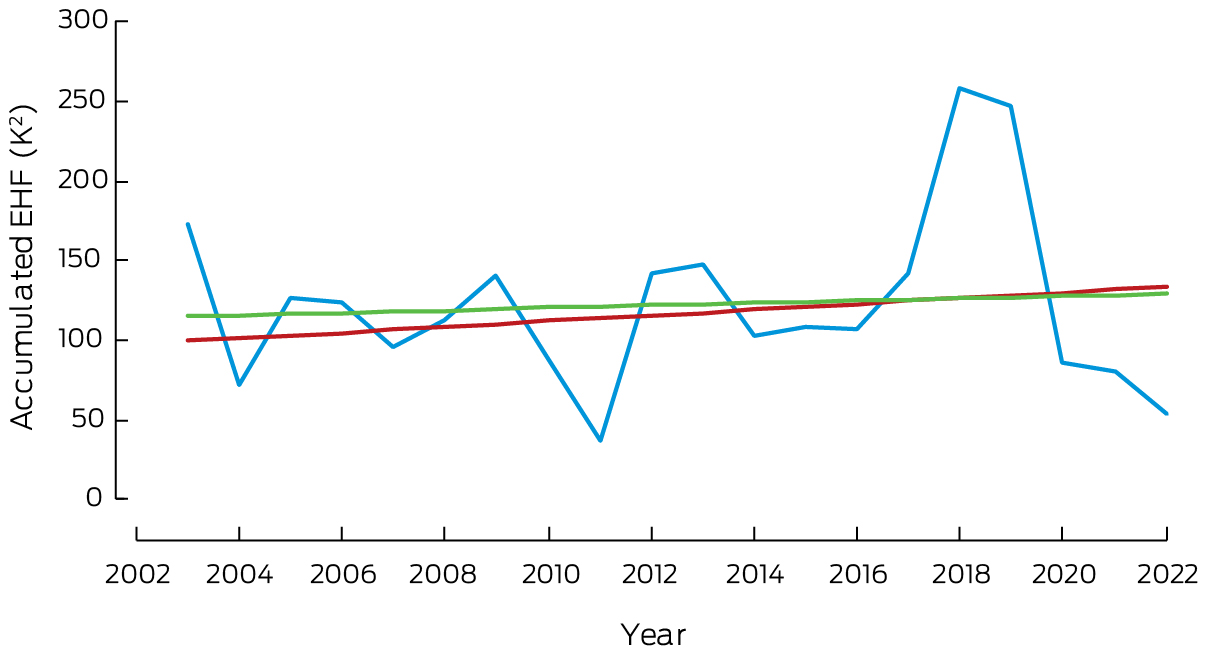
* The blue line shows accumulated EHF by year. The red trend line is calculated over the past 50 heatwave seasons (1973–1974 to 2022–2023); the green trend line is calculated over the past 20 heatwave seasons.
Box 3 – Annual hours per person from 1990 to 2022 across Australia that exceeded the moderate, high and extreme heat stress risk threshold as defined by the 2021 Sports Medicine Australia Extreme Heat Policy23 for light intensity (A) and moderate intensity (B) physical activity
Box 4 – Average annual days per person exposure to very high or extreme bushfire danger in Australia, 2003–2022 (blue dots), showing trend with 95% confidence intervals for the entire time period (black lines), and the mean for the 10‐year periods 2003–2012 (dashed red line) and 2013–2022 (dashed green line)
Box 5 – Measuring climate change impacts on Aboriginal and Torres Strait Islander health and wellbeing
- Healthy Country is a key determinant of Aboriginal and Torres Strait Islander wellbeing.30 Protecting and looking after Country is a reciprocal responsibility central to Aboriginal and Torres Strait Islander culture.
- The destructive impact of colonisation continues to ripple through generations of Aboriginal and Torres Strait Islander communities. Forced separation from land and families and widescale exploitation and degradation of the environment has disrupted connection to Country and culture. However, important Knowledge systems about complex ecological systems and how to care for Country have survived.31
- With climate change, communities have noticed reduced reliability of seasonal cues with fruits flowering at different times and extended heat and other extreme conditions affecting quality and availability of bush resources.32 In other communities, encroaching seawater is washing over important cultural and burial sites and contaminating fresh water supplies.33,34 Underpinning climate worries is a deep sense of fear, uncertainty and lack of control over caring for Country responsibilities that are manifesting in poor emotional and social wellbeing outcomes for communities.34
- Climate impacts have sharpened the focus on the need for Aboriginal and Torres Strait Islander‐led initiatives to draw on diverse knowledge systems for effective, inclusive, place‐based adaptation planning.31 This will require community access to Country, trusting and respectful relationships between all stakeholders, and strong cultural governance over the use and control of Indigenous cultural and intellectual property (ICIP).31
- An Aboriginal and Torres Strait Islander health and climate indicator is essential for monitoring progress in addressing climate change impacts. In line with Indigenous Data Sovereignty (IDS) principles, it is imperative that the indicator reflects concepts valued by Aboriginal and Torres Strait Islander people.35
- Previously, the MJA–Lancet Countdown used measures of cardiovascular and long term respiratory conditions, rates of household overcrowding, and lack of access to primary care providers as indicators of climate vulnerability.12 However, they are indirect measures and are underpinned by non‐Indigenous concepts of health and wellbeing.
- There is an increase in community driven and derived measures to better describe the interconnectedness between cultural and environmental domains and wellbeing.36,37 The MJA–Lancet Countdown series aims to draw upon this work in line with IDS and ICIP principles. For example, the Mayi Kuwayu study of Aboriginal and Torres Strait Islander Wellbeing is a national, longitudinal cohort study that explores how cultural practice (such as connection to Country) is related to health and wellbeing.36 The What Matters 2 Adults study (WM2A) has developed a national wellbeing measure based on the preferences and values of Aboriginal and Torres Strait Islander adults. Findings from WM2A highlight the stark impact of environmental degradation and destruction of land and sacred sites.37 Participants commented that protection of the environment was paramount to their wellbeing, due to the deep and reciprocal relationship they have with Country.37
- The WM2A and Mayi Kuwayu studies provide contextual, holistic approaches that could be drawn upon to derive indicator/s of access to Country and culture that climate change threatens. Most importantly, utilising Aboriginal and Torres Strait Islander driven and governed datasets will change the narrative on Indigenous health and wellbeing and contribute to shared learning to address climate change impacts and adaptation.
Box 6 – International Health Regulations (2005) monitoring framework annual average capacity scores for Australia, the WHO Western Pacific Region and the globe, for zoonotic events and the human–animal interface, surveillance, human resources, national health emergency framework, and health service provision, 2018–2022
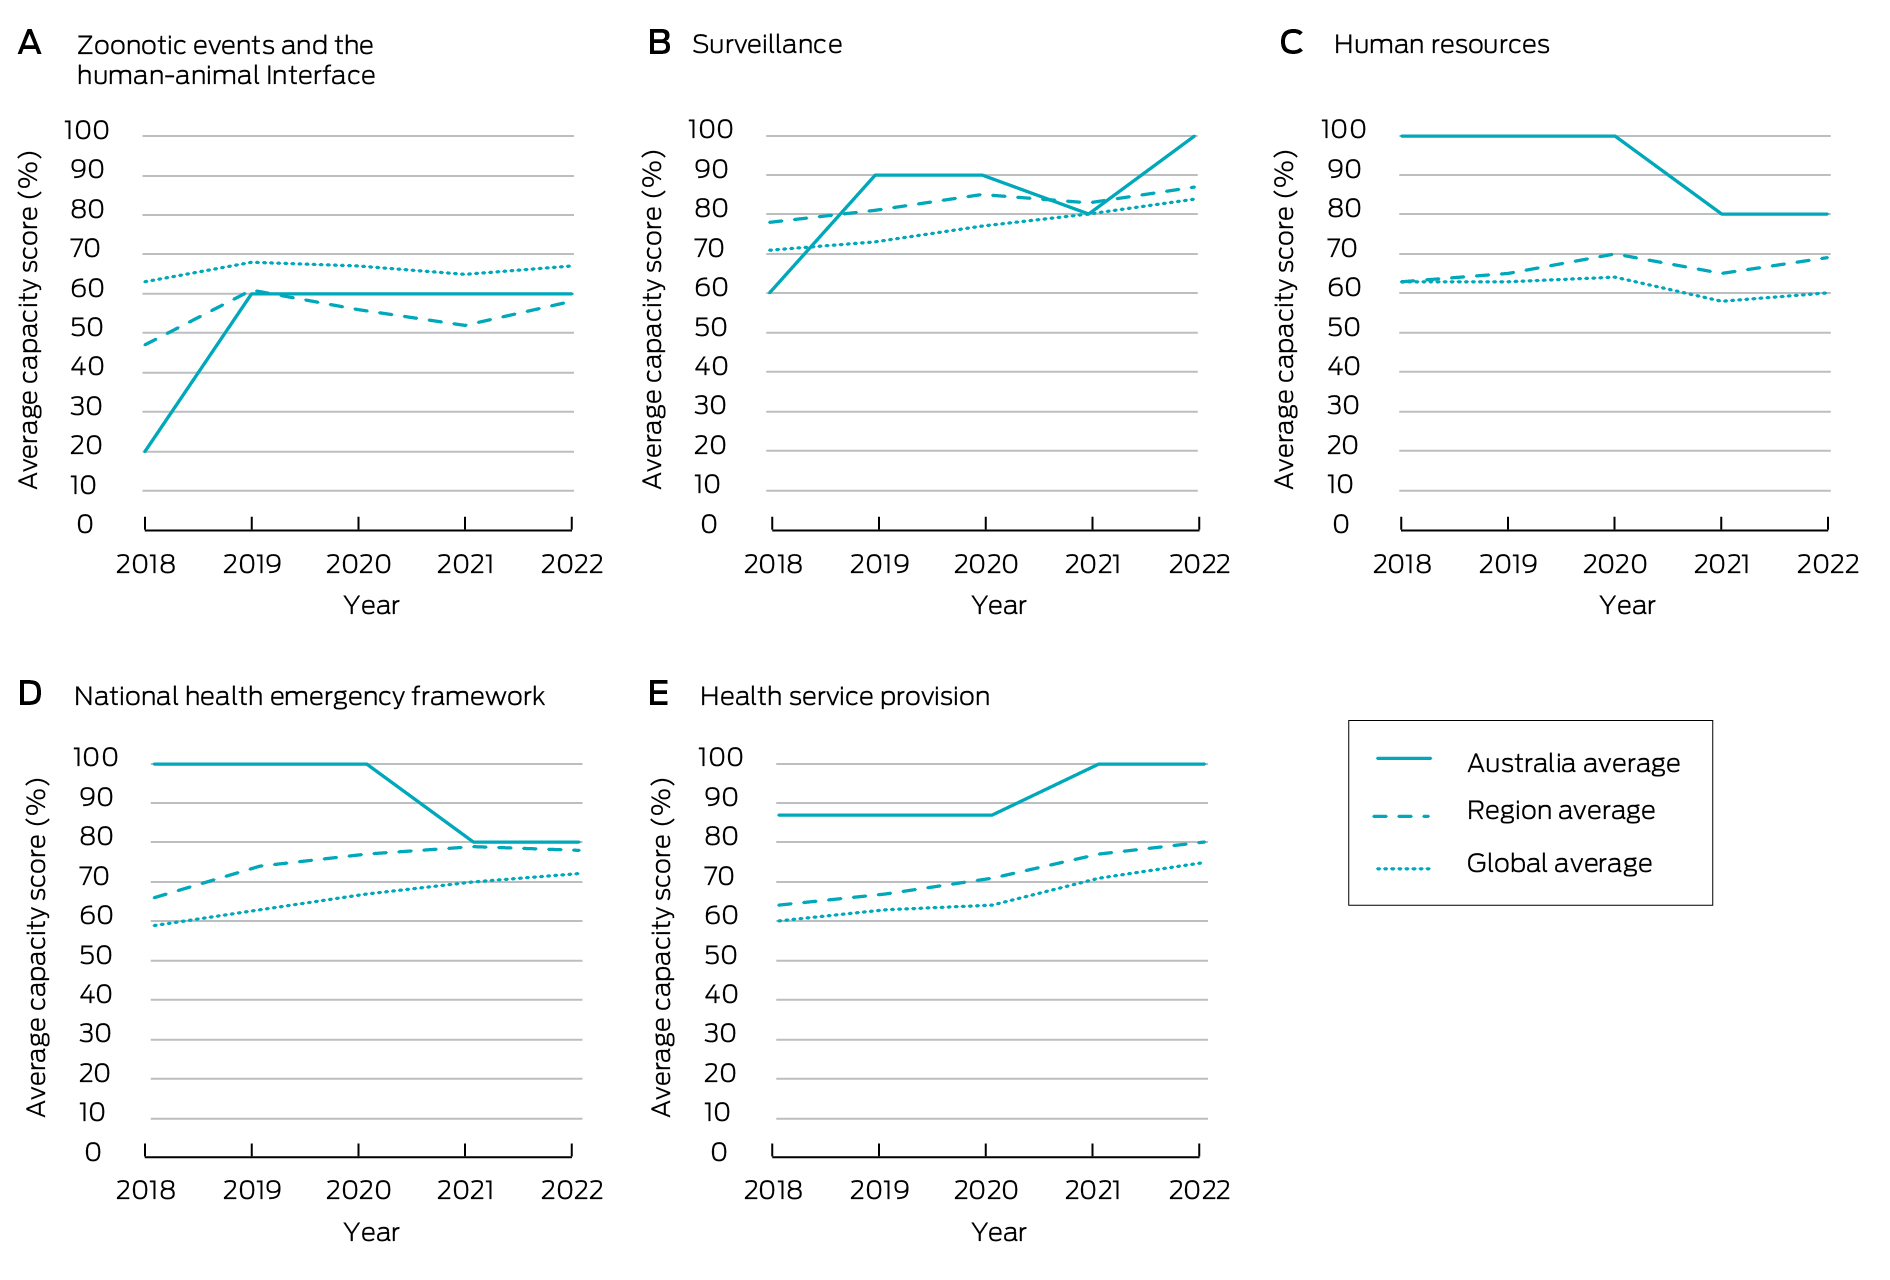
Data source: World Health Organization.43
Box 7 – Annual displacement caused by weather‐related disaster in Australia, 2008–2021*
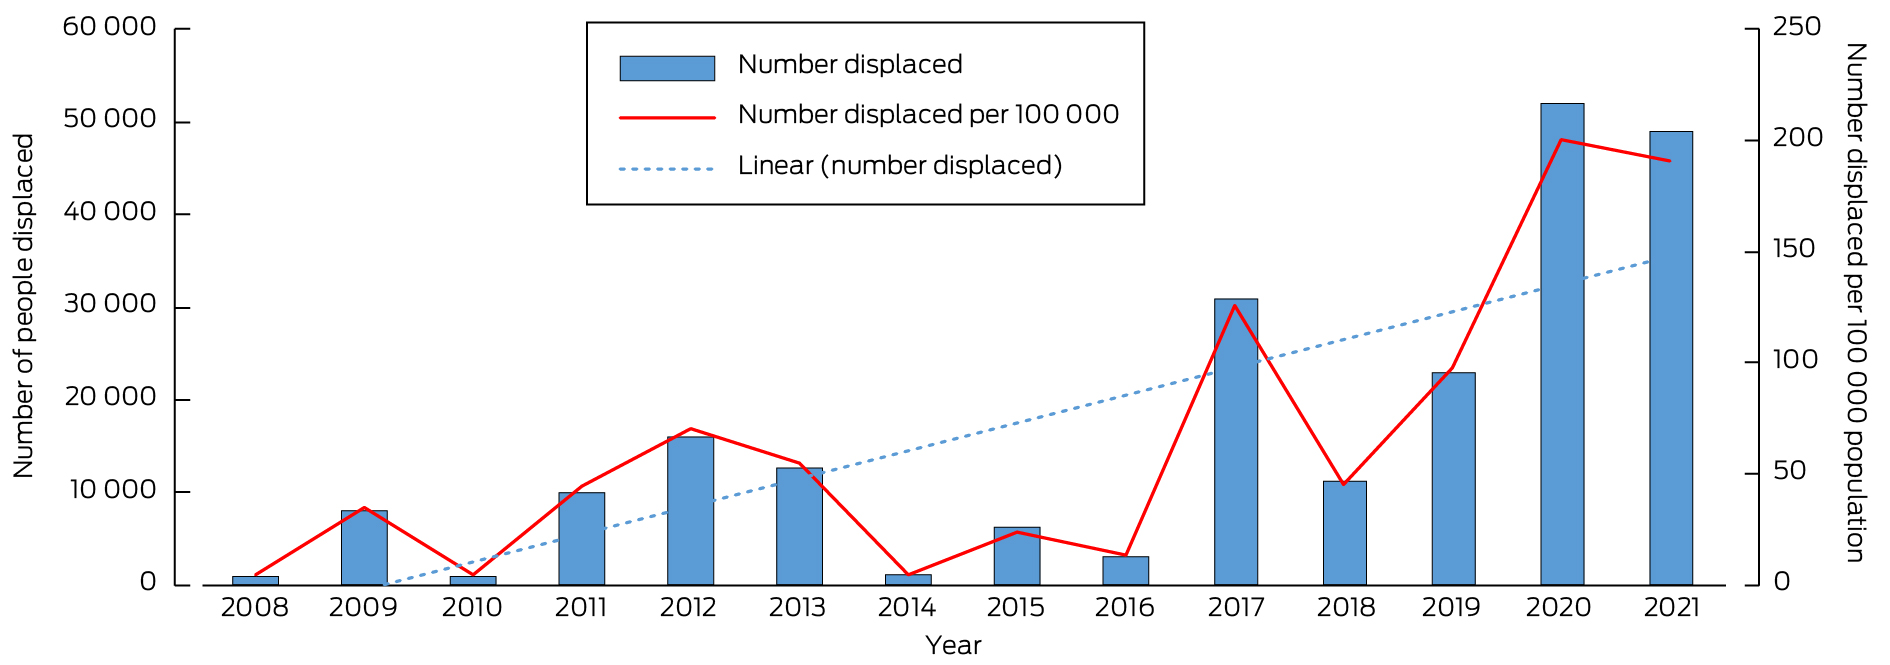
* The blue dotted line is the linear trend line of the number displaced from 2008 to 2021. Data sources: Internal Displacement Monitoring Centre;46 World Bank.47
Box 8 – Annual number of National Aerial Firefighting Centre (NAFC) aircraft services and volunteer firefighters and support staff in Australia from 2007–08 to 2022–23*
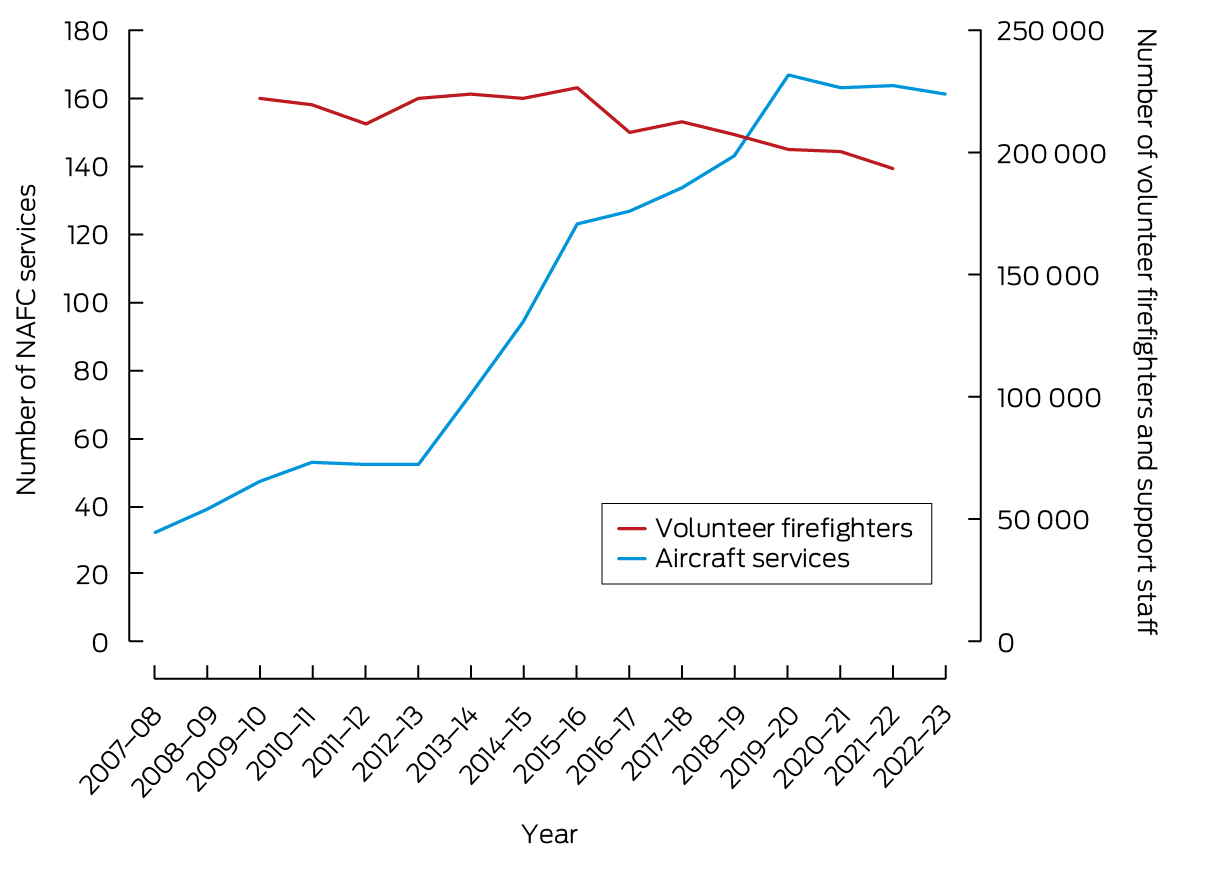
* NAFC aircraft services represent the number of aircraft in Australia available to fight bushfires. Note that some aircraft double up for the north and south of the country; for example, an aircraft might run in Queensland then move to Tasmania as a separate service. A service is usually exclusive to NAFC use, mostly for 84 or 96 days each summer (some services run longer). Data sources: NAFC; Productivity Commission.50
Box 9 – Total energy supply by source, Australia 1990–2021*
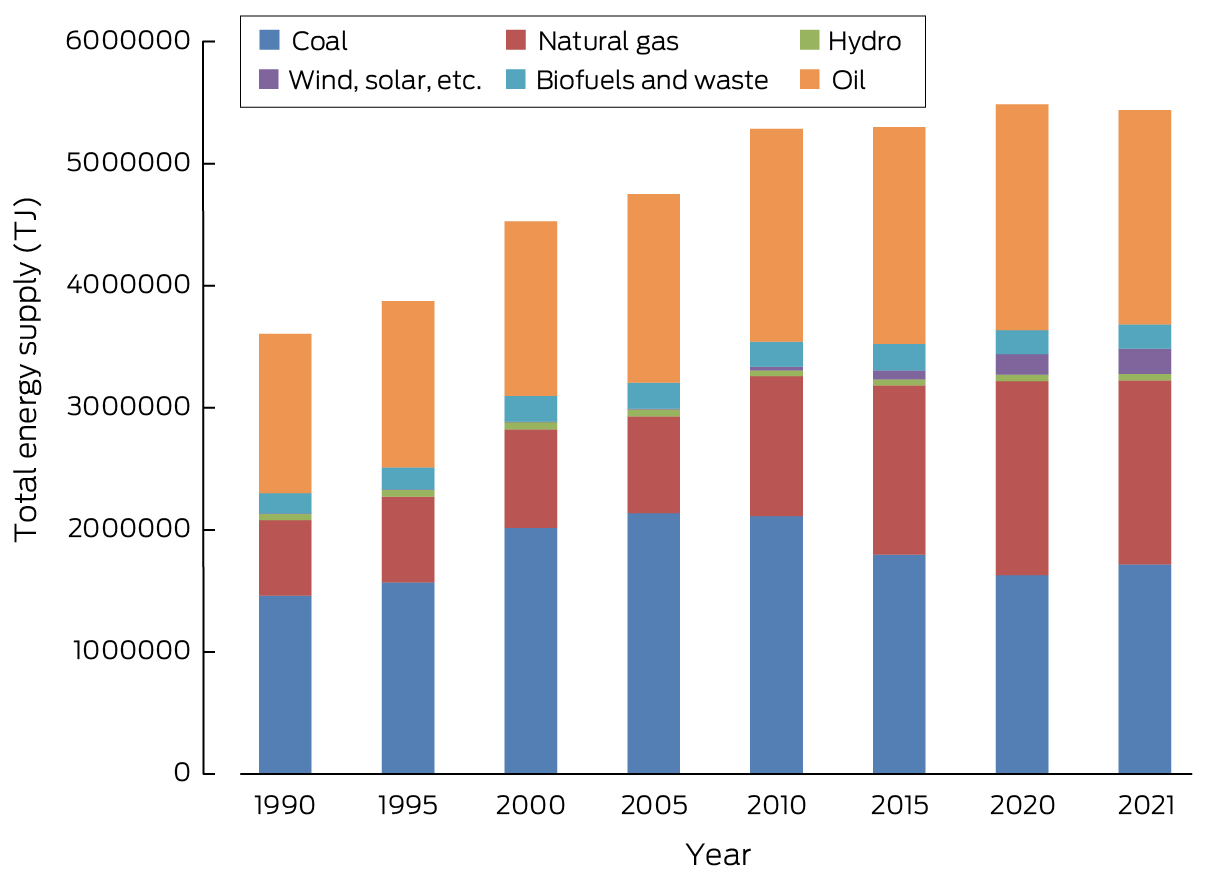
TJ = terajoules.* Note the five‐yearly spacing between all the columns except the two on the right which are just one year apart. Data source: International Energy Agency.
Box 10 – Annual and monthly average airborne particulate matter less than 2.5 μm in diameter (PM2.5) for cities with > 100 000 people in each Australian state and territory from 2000 to May 2023*
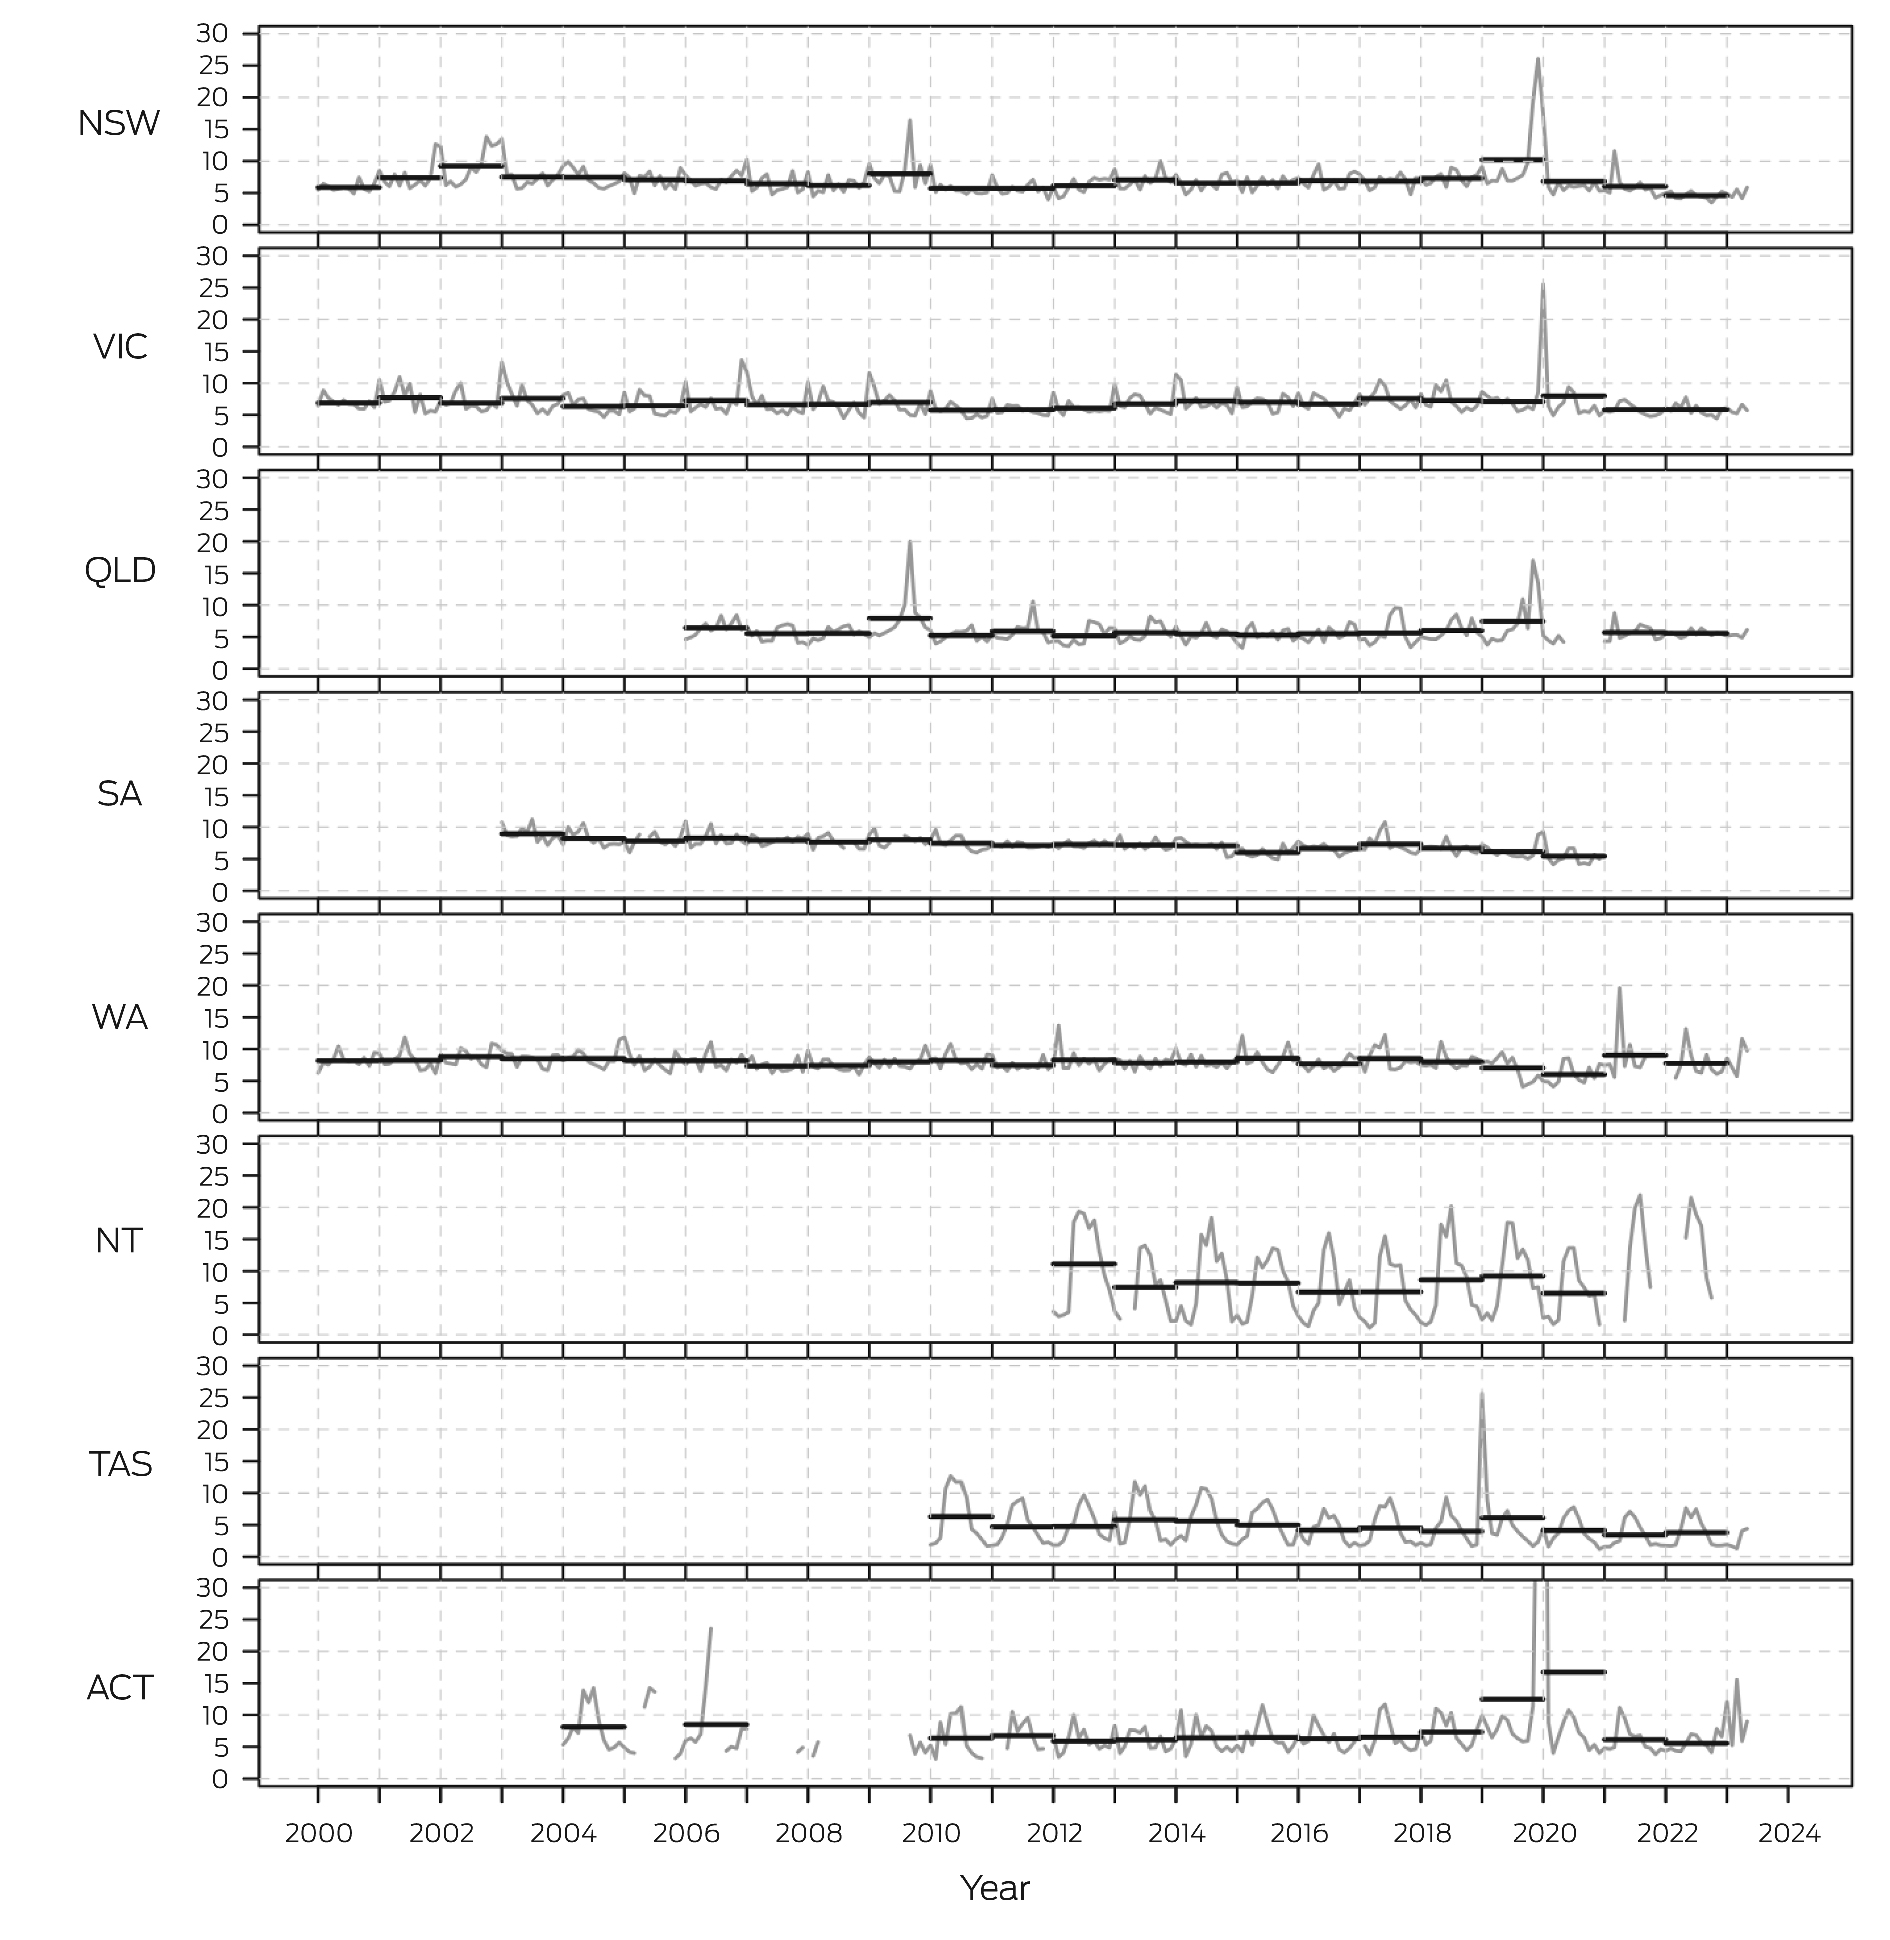
ACT = Australian Capital Territory; NSW = New South Wales; NT = Northern Territory; QLD = Queensland; SA = South Australia; TAS = Tasmania; VIC = Victoria; WA = Western Australia.* Annual average is the black horizontal lines and monthly average is the grey lines; PM2.5 units are μg/m3. Data sources: relevant state and territory government authorities,58,59 and Australian Bureau of Statistics.
Box 11 – Annual (financial year) Australian transport energy consumption by fuel types, 2011–12 to 2020–21
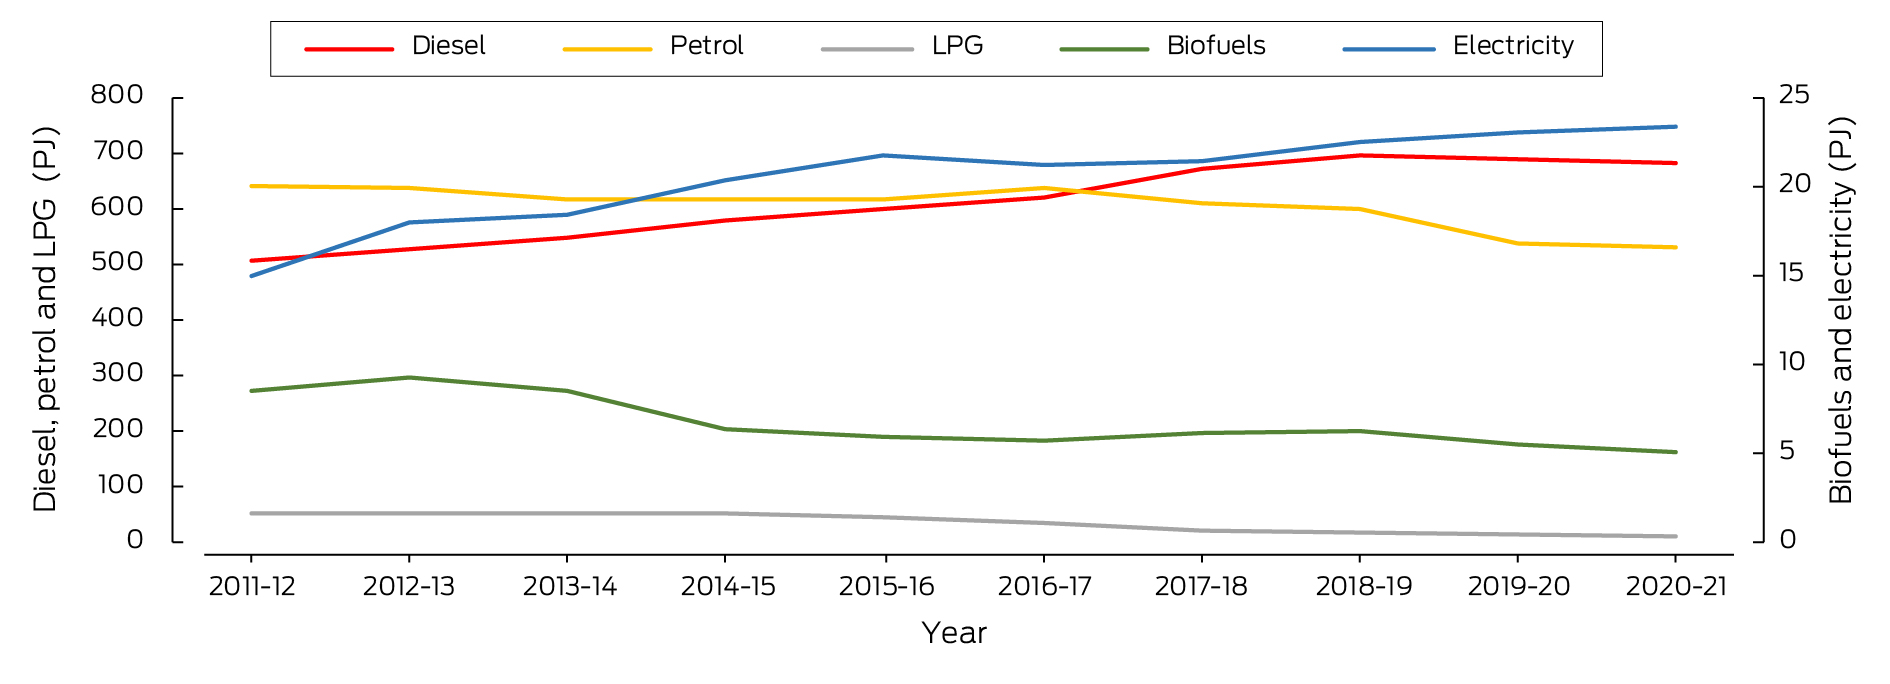
LPG = liquid propane gas; PJ = petajoules.Data sources: Electric Vehicle Council;62,63 Department of Climate Change, Energy, the Environment and Water;64 Federal Chamber of Automotive Industries.
Box 13 – Greenhouse gas emissions from food production in Australia by commodity between 1995 and 2020
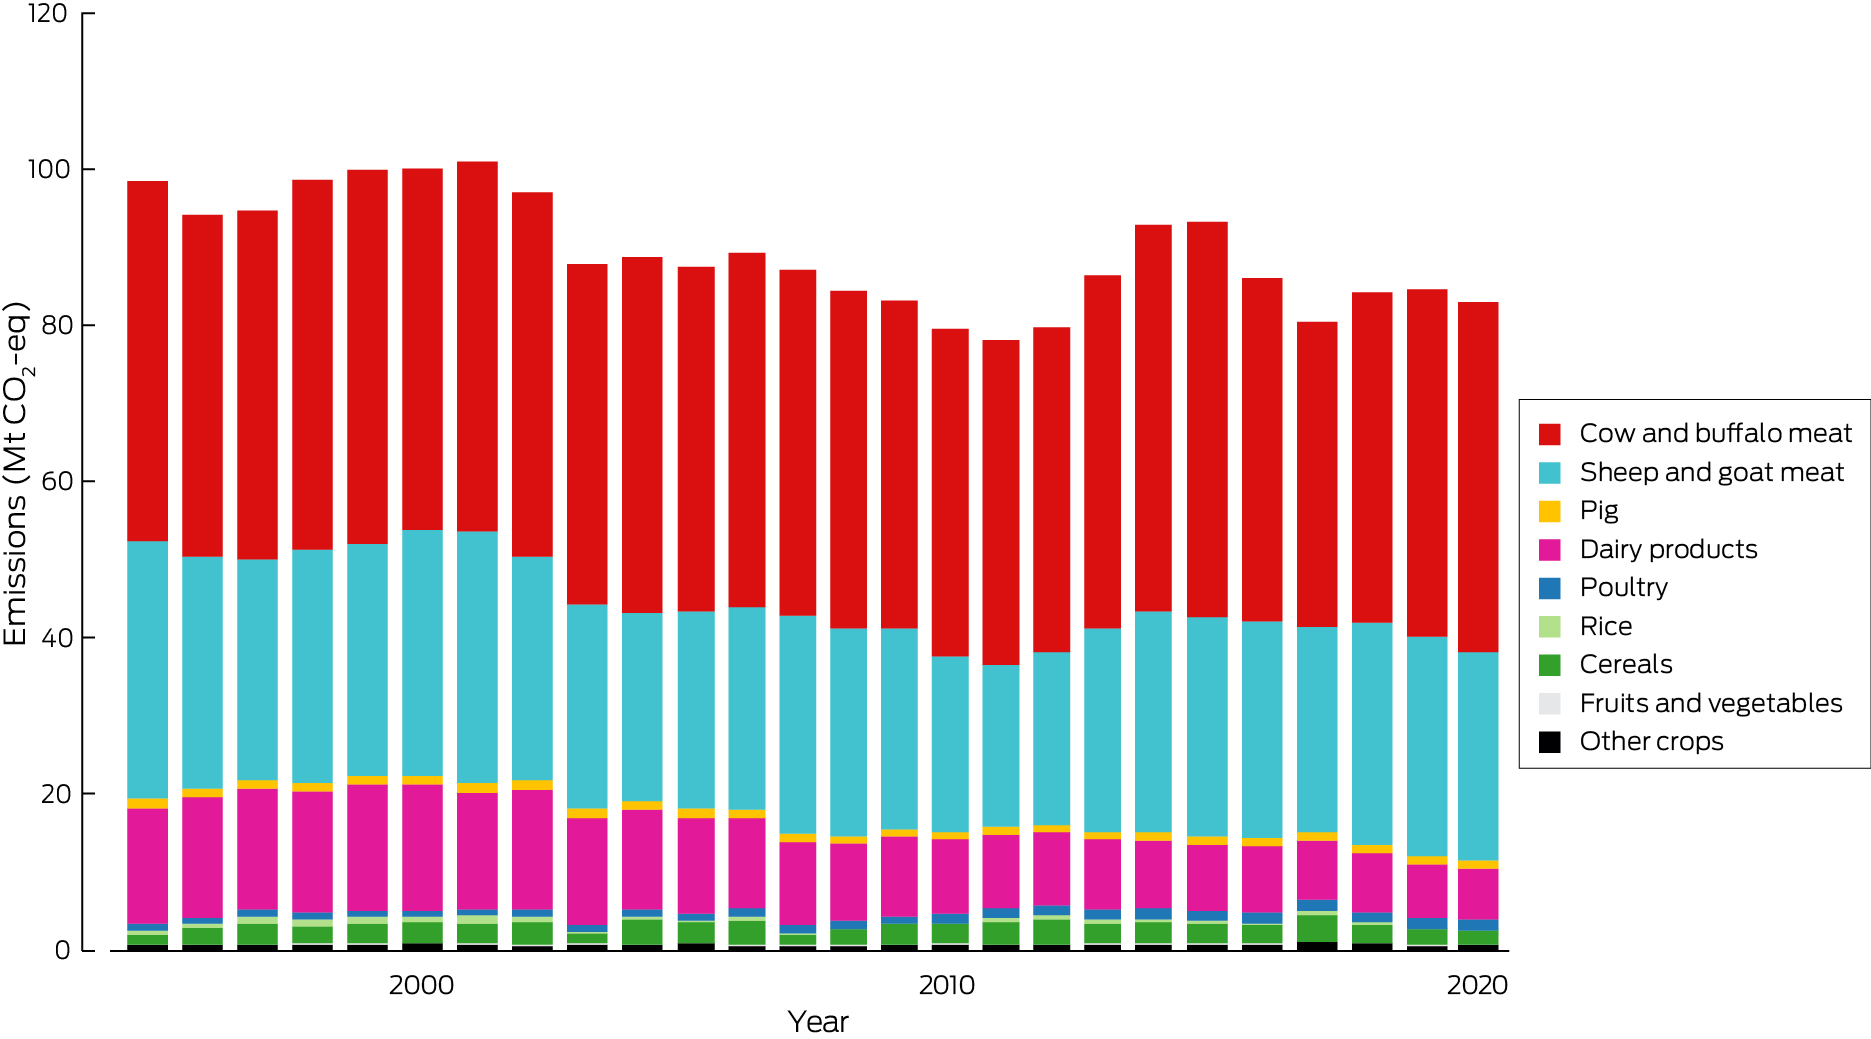
Mt CO2‐eq = million tonnes of carbon dioxide equivalent.
Box 14 – Annual inflation‐adjusted total insured economic losses in Australia from bushfires, cyclones, flooding, hailstorms, storm flooding and tornadoes for the period 2000–2022 based on Insurance Council of Australia historical catastrophe data72
Box 15 – Unprecedented rains and floods in New Zealand and their impacts on health
The 2022 MJA–Lancet Countdown report reported “the major climate‐related health risks in New Zealand result from heavy rainfall and flooding”.13 This was demonstrated in 2023, when the beginning of the year was marked in northern areas by the arrival of ex‐tropical cyclone Hale, and weeks of heavy rain and flooding. In extraordinary conditions in Auckland in late January, a month's worth of rain fell in a day.73 A civil emergency was declared, four people drowned within two hours, and more than 500 homes were damaged so badly they were uninhabitable. Two weeks later ex‐tropical cyclone Gabrielle struck the east coast of the North Island, and caused what is likely to be the most expensive climate‐related disaster in New Zealand's history. There was large‐scale flooding, slips and destructive landslides, especially in Tairawhiti and Hawkes Bay, with damage compounded by large amounts of forestry debris carried in the flood waters.74 The volume and intensity of rain and the rapidity of the flooding were unprecedented. In three months following Gabrielle, further rain has caused more slips and further disruption, due to water‐logged soils and sediment‐loaded waterways. In total, there have been 11 deaths from drowning and injuries, nearly 225 000 people lost power at the height of the storms, and thousands were cut off from essential supplies, with many trapped in wrecked homes. In June 2023, it was estimated by the NZ Treasury that the costs so far of repairing damage from the 2023 storms would fall between NZ$9 billion and NZ$14.5 billion.75,76Despite widespread exposure to heavily contaminated floodwaters, there have been no outbreaks reported of gastro‐intestinal illness. However, increased numbers of leptospirosis cases were reported in Hawkes Bay.74,77 Given population displacement, loss of housing and social and economic hardship caused by acute disruption, and the costs of recovery long term, it is expected that mental health problems will emerge in the months following. These events exacerbate inequities for rural communities, which already carry avoidable and unfair burdens of ill health.78 La Niña conditions have raised temperatures and affected rainfall in the region in 2022–23, but climate change has undoubtedly contributed also. A World Weather Attribution study found a rainfall event as severe as that experienced in Tairawhiti and Hawkes Bay is about four times more likely to happen than it was when the world was 1.2°C cooler than it is today.79
Box 16 – Annual new investment and capacity withdrawal in the Australian National Electricity Market for different fuel sources (black coal, brown coal, gas, hydroelectricity, wind, solar and battery) from 2013 to 2023
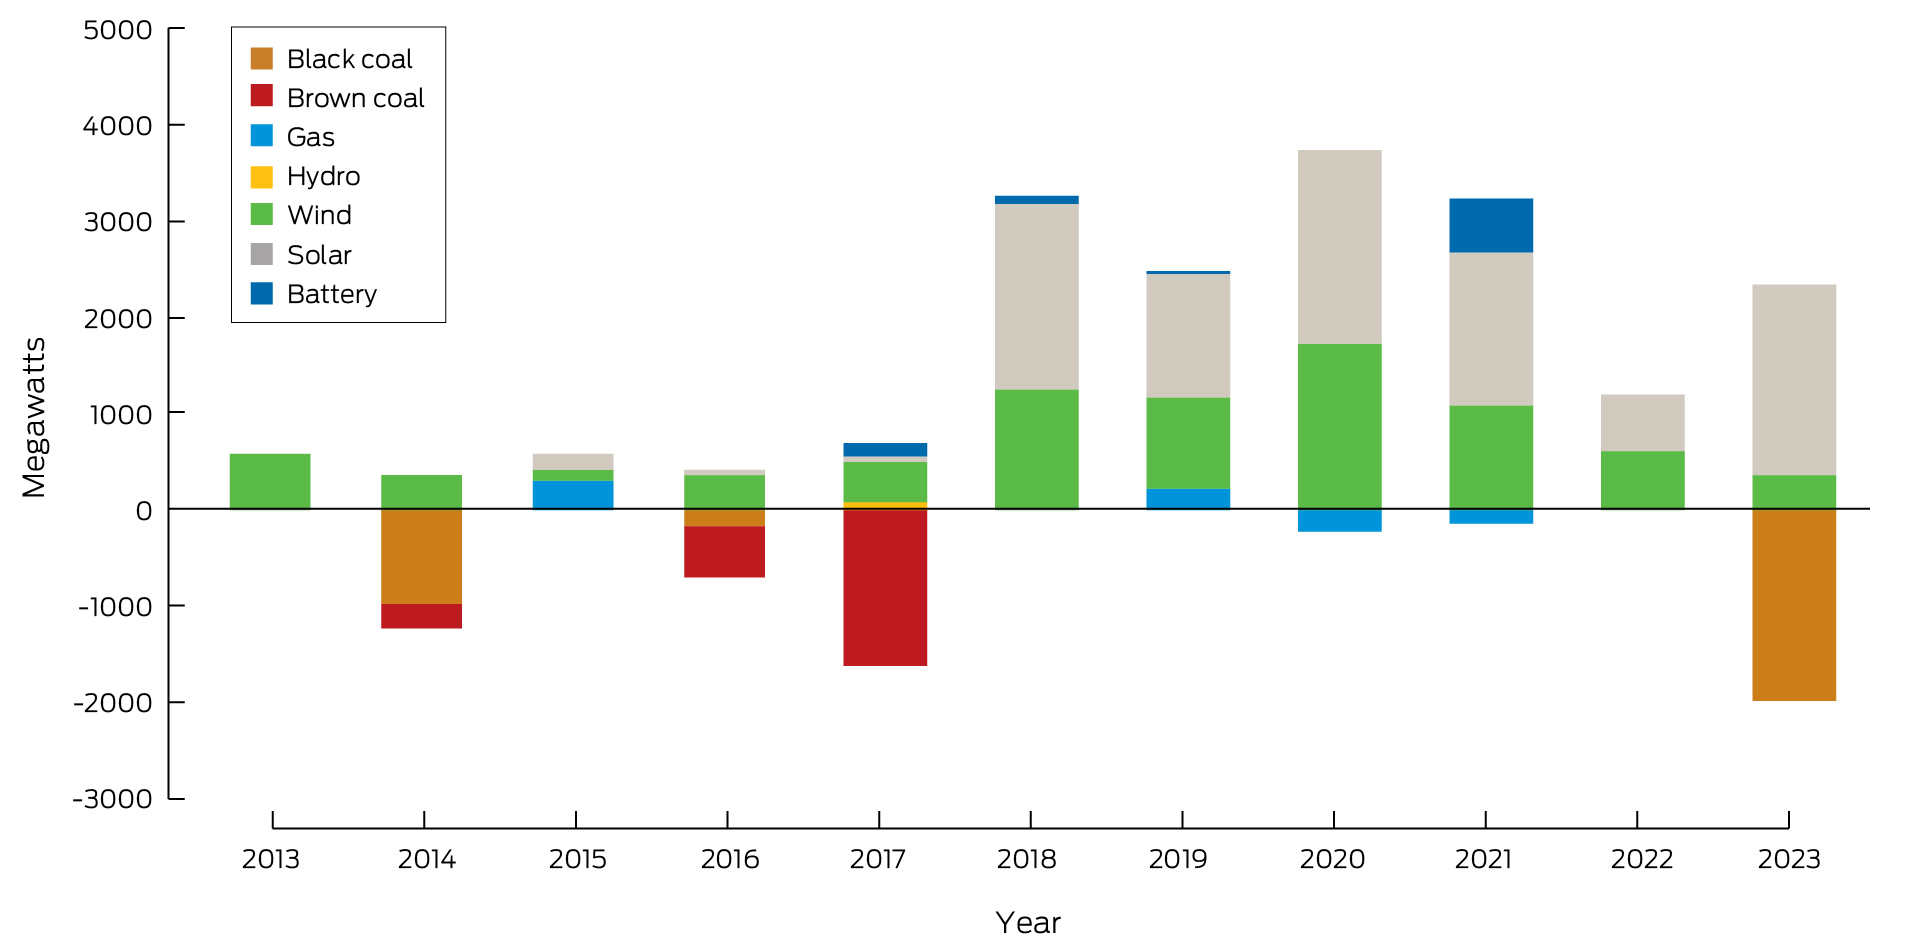
Data sources: Australian Energy Regulator (AER);80 Australian Energy Market Operator.81 Note: In its latest report, the AER has changed its reporting from financial years to calendar years and it has also changed numbers a little compared with previously published values. As such, the columns in this figure differ to some extent from those in our previous reports and are not directly comparable.
Box 17 – Annual number of media articles on health and climate change by covered regions in Australia, 2008–2022
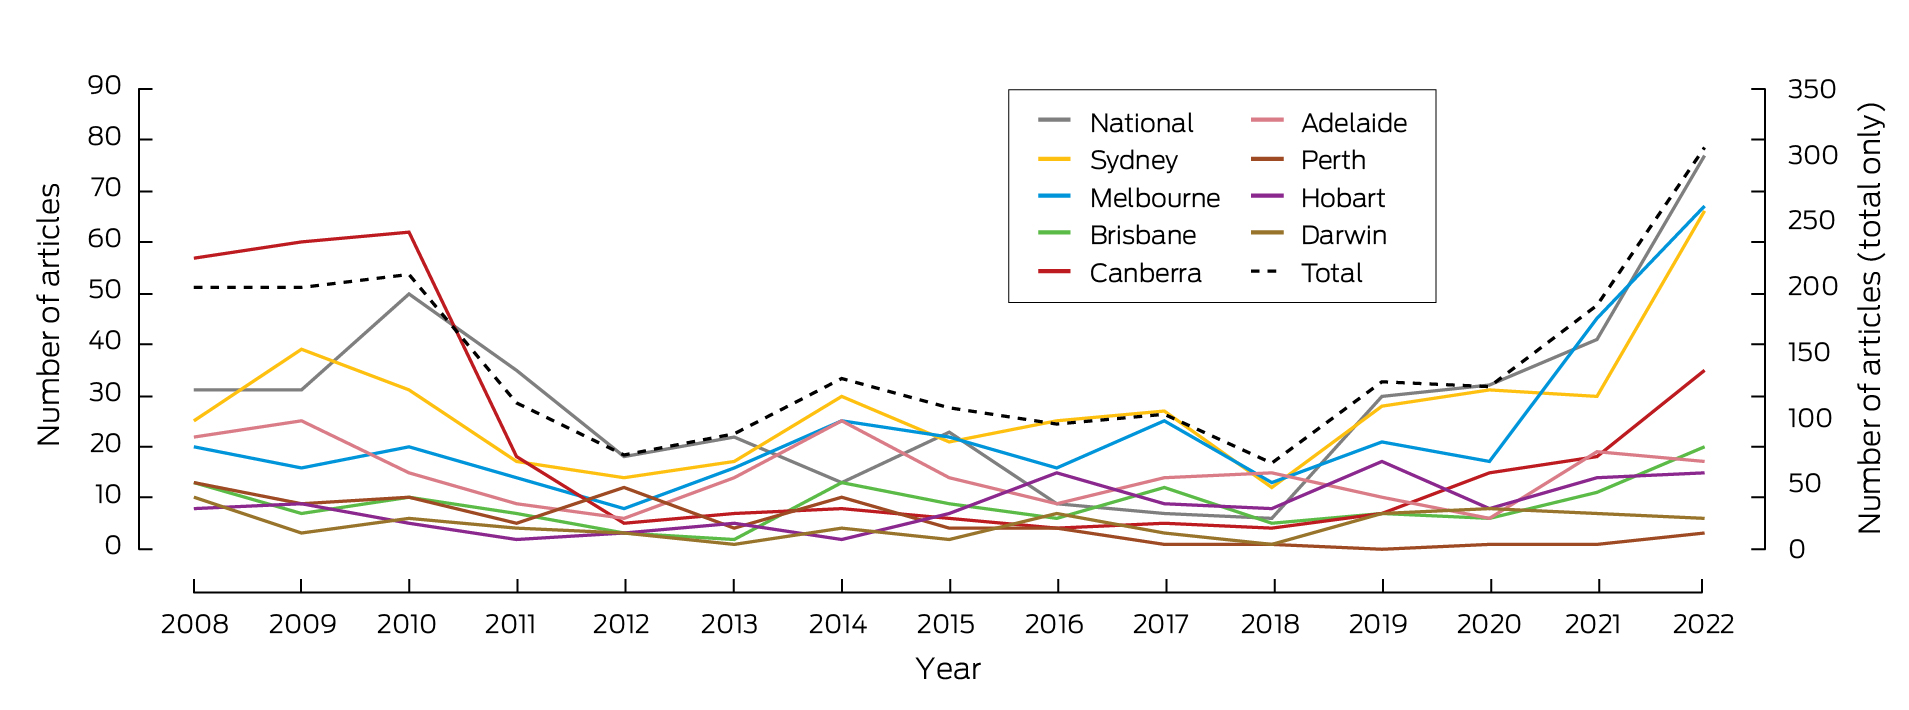
Data source: Factiva.
Box 18 – Funded and not‐funded National Health and Medical Research Council (NHMRC) grant applications with a focus on health and climate change, and success rate, 2000–2022
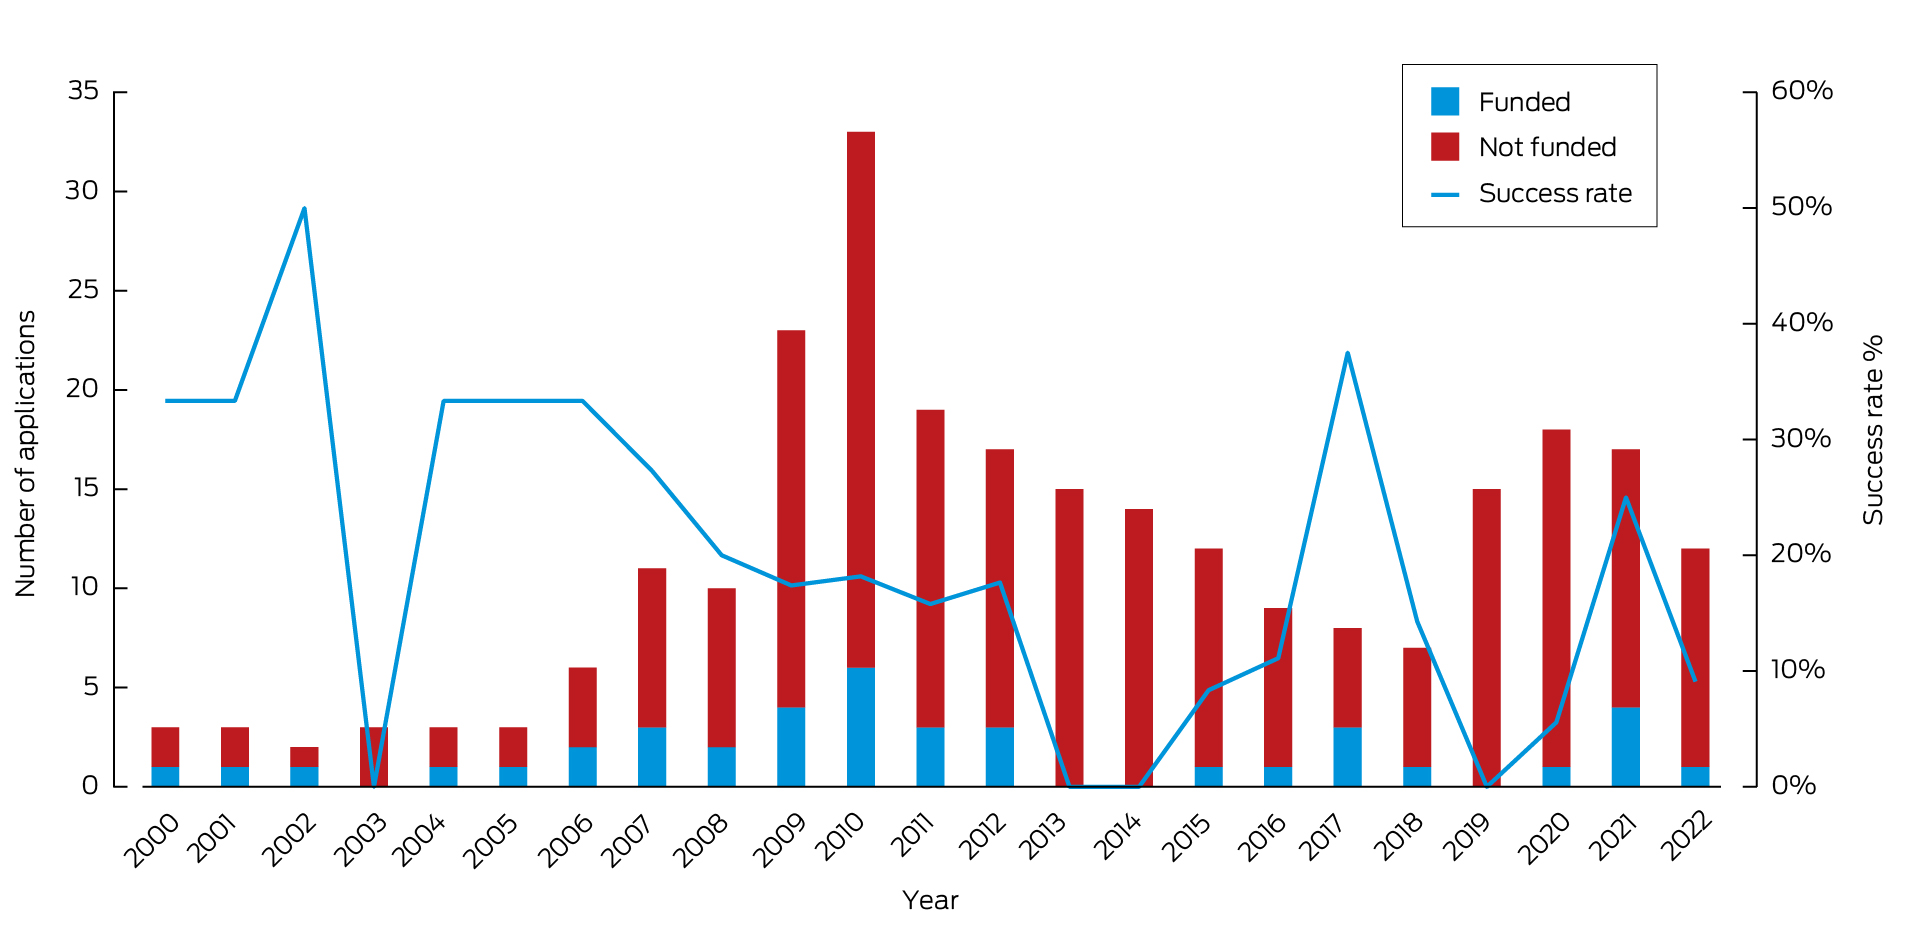
Data source: NHMRC.
Box 19 – Health and climate change in Vietnam: a Western Pacific case study
The major climate‐related health risks in Vietnam result from rising temperatures, extreme weather events, and climate‐sensitive infectious diseases. Studies consistently demonstrate increased mortality,95 and hospitalisation risks for climate‐sensitive diseases due to rising temperatures (ie, respiratory diseases,96,97,98 cardiovascular diseases,96,99,100,101 kidney diseases,102 and mental health disorders103,104,105). The vulnerable groups to heat‐related health risks included older people,95,97,99,106 children,107,108 and those frequently working outdoors such as farmers and police.109,110 Additional analyses of heatwave exposures show a significant increase in person‐days of heatwave exposure across Vietnam's regions from 2001 to 2020. The Red River Delta experienced the highest surge.Vietnam, one of Southeast Asia's most flood‐prone nations, faces increased health risks due to extreme weather events such as floods and cyclones, with predictions indicating worsening scenarios.111 These events trigger an uptick in fatalities, injuries and diseases, leading to increased hospitalisations. For example, the 2011 extreme annual flood in the Mekong Delta River increased non‐external cause hospitalisations, infectious diseases and respiratory diseases by 7.2%, 16.4% and 25.5%, respectively.112 Furthermore, children's health is disproportionately impacted by heavy rainfall and droughts, presenting issues like underweight and reduced overall health status.113,114 Droughts, potentially triggered by both insufficient precipitation and hydropower projects, amplify hospitalisation risks, elevate health expenditures, and degrade overall health.114,115 Geographically, regions within Vietnam display varied vulnerability to different climatic hazards.116A significant correlation exists between rising temperatures and increasing incidence of dengue fever, with dengue showing the highest sensitivity to climate factors among infectious diseases.117,118,119,120,121,122,123,124,125,126,127,128,129 Humidity and rainfall also have significant associations with dengue.117,118,119,120,121,122,123,124,125,126,127,128,129 Although malaria incidence has decreased, it remains endemic in some regions and has lower climate sensitivity than dengue.130,131,132 Water‐borne and respiratory infectious diseases show inconsistent relationships with climatic factors across different studies and regions.133,134,135,136,137,138,139,140,141 Other infectious diseases, such as hand–foot–mouth disease, show associations with climatic factors, but more research is needed.142,143,144,145 Overall, vulnerability analyses are sparse but highlight children and young families as high risk populations.146,147Vietnam's adaptive capacity to climate change‐related hazards is weak, with a particularly underprepared health sector.148,149,150 Adaptation methods at the community level often are reactive, with various barriers like low staff capacity, scant local budgets, and outdated methods.151 However, Vietnam has a comprehensive governance framework for climate change adaptation, with key policies including the “National Adaptation Plan for the period 2021–2030, with a vision to 2050” and the “National Action Plan for the Health Sector Response to Climate Change (2019–2030, with a vision to 2050)”. Despite this, strategies often rely on top‐down planning, leading to implementation challenges and overlapping responsibilities.148,150,152 Furthermore, a dearth of focus on multi‐disaster adaptation and climate change‐related health risks persists.148,150 In response to Vietnam's commitment to achieve net‐zero emissions by 2050, announced at the 26th United Nations Climate Change Conference (COP26) in the UK in 2021, the Vietnamese Ministry of Natural Resources and Environment has recently released a comprehensive strategic plan.
Provenance: Not commissioned; externally peer reviewed.
- Paul J Beggs1
- Stefan Trueck1
- Martina K Linnenluecke2
- Hilary Bambrick3
- Anthony G Capon4
- Ivan C Hanigan5
- Nicolas Borchers Arriagada6
- Troy J Cross7
- Sharon Friel8
- Donna Green9
- Maddie Heenan10,11
- Ollie Jay12
- Harry Kennard13
- Arunima Malik7
- Celia McMichael14
- Mark Stevenson15
- Sotiris Vardoulakis3
- Tran N Dang16
- Gail Garvey17,*
- Raymond Lovett3,18,†
- Veronica Matthews19,‡
- Dung Phung17
- Alistair J Woodward20
- Marina B Romanello21
- Ying Zhang7
- 1 Macquarie University, Sydney, NSW
- 2 University of Technology Sydney, Sydney, NSW
- 3 National Centre for Epidemiology and Population Health, Australian National University, Canberra, ACT
- 4 Monash Sustainable Development Institute, Monash University, Melbourne, VIC
- 5 Curtin University, Perth, WA
- 6 Menzies Institute for Medical Research, University of Tasmania, Hobart, TAS
- 7 University of Sydney, Sydney, NSW
- 8 Australian National University, Canberra, ACT
- 9 Climate Change Research Centre and ARC Centre of Excellence for Climate Extremes, UNSW, Sydney, NSW
- 10 Australian Prevention Partnership Centre, Sax Institute, Sydney, NSW
- 11 The George Institute for Global Health, Sydney, NSW
- 12 Thermal Ergonomics Laboratory, University of Sydney, Sydney, NSW
- 13 Center on Global Energy Policy, Columbia University, New York, NY, USA
- 14 University of Melbourne, Melbourne, VIC
- 15 Transport, Health and Urban Design (THUD) Research Lab, University of Melbourne, Melbourne, VIC
- 16 University of Medicine and Pharmacy at Ho Chi Minh City, Ho Chi Minh City, Vietnam
- 17 University of Queensland, Brisbane, QLD
- 18 Australian Institute of Aboriginal and Torres Strait Islander Studies, Canberra, ACT
- 19 University Centre for Rural Health, University of Sydney, Sydney, NSW
- 20 University of Auckland, Auckland, NZ
- 21 Institute for Global Health, University College London, London, UK
- * Kamilaroi
- † Ngiyampaa/Wongaibon
- ‡ Quandamooka
Open access:
Open access publishing facilitated by Macquarie University, as part of the Wiley ‐ Macquarie University agreement via the Council of Australian University Librarians.
We thank Robert Fawcett, Justin Peter, and John Nairn (all from the Australian Bureau of Meteorology) for indicators 1.1 Exposure of vulnerable populations to heatwaves and 2.2 Climate information for health. Ivan Hanigan's access to data for indicators 1.4 and 3.3 was supported by the Centre for Air Pollution, Energy, and Health Research Data Platform funded by the NHMRC Centre for Safe Air (https://www.car‐cre.org.au/; https://cardat.github.io), which received funding from the Australian Research Data Commons for the Integrated National Air Pollution and Health Data project (https://doi.org/10.47486/PS022), and he acknowledges the HEAL (Healthy Environments And Lives) National Research Network, which receives funding from the NHMRC (grant no. 2008937). The Bushfires indicator was generated with support from NASA Applied Sciences Program (grant no. 80NSSC21K0507) and we thank Yang Liu and Qiao Zhu (Emory University) as well as Yun Hang (now at University of Texas Health Science Center) for the Australian data used for this indicator (1.3). We also thank Fay Johnston for assistance with this indicator. We thank Carole Dalin (University College London) for assistance with indicator 3.5 Emissions from agricultural production and consumption. We thank the Lancet Countdown for providing the results for indicators 3.6 Diet and health co‐benefits, and 3.7 Health care sector emissions. We thank the NHMRC for providing the data for indicator 5.4 Health and climate change research funding.
No relevant disclosures.
- 1. Bureau of Meteorology. Annual climate statement 2022: analysis of Australia's temperature, rainfall, water, oceans, cryosphere, significant weather and influences during 2022. http://www.bom.gov.au/climate/current/annual/aus/2022/Annual‐Statement‐2022.pdf (viewed July 2023).
- 2. United Nations. It's official: July 2023 was the warmest on record. UN News, 8 Aug 2023. https://news.un.org/en/story/2023/08/1139527 (viewed Aug 2023).
- 3. World Meteorological Organization. Preliminary data shows hottest week on record. Unprecedented sea surface temperatures and Antarctic sea ice loss. 10 July 2023. https://wmo.int/media/news/preliminary‐data‐shows‐hottest‐week‐record‐unprecedented‐sea‐surface‐temperatures‐and‐antarctic‐sea#:~:text=Unprecedented%20sea%20surface%20temperatures%20and%20Antarctic%20sea%20ice%20loss,‐News&text=The%20world%20just%20had%20the,low%20Antarctic%20sea%20ice%20extent (viewed July 2023).
- 4. Rockström J, Gupta J, Qin D, et al. Safe and just Earth system boundaries. Nature 2023; 619: 102‐111.
- 5. Romanello M, di Napoli C, Green C, et al. The 2023 report of the Lancet Countdown on health and climate change: the imperative for a health‐centred response in a world facing irreversible harms. Lancet 2023; 402: 2346‐2394.
- 6. Vicedo‐Cabrera AM, Scovronick N, Sera F, et al. The burden of heat‐related mortality attributable to recent human‐induced climate change. Nat Clim Chang 2021; 11: 492‐500.
- 7. United Nations Climate Change. The Paris Agreement. https://unfccc.int/process‐and‐meetings/the‐paris‐agreement (viewed July 2023).
- 8. United Nations. Paris Agreement. 2015. https://unfccc.int/files/essential_background/convention/application/pdf/english_paris_agreement.pdf (viewed July 2023).
- 9. Zhang Y, Beggs PJ, Bambrick H, et al. The MJA–Lancet Countdown on health and climate change: Australian policy inaction threatens lives. Med J Aust 2018; 209: 474‐474.e21. https://www.mja.com.au/journal/2018/209/11/mja‐lancet‐countdown‐health‐and‐climate‐change‐australian‐policy‐inaction
- 10. Beggs PJ, Zhang Y, Bambrick H, et al. The 2019 report of the MJA–Lancet Countdown on health and climate change: a turbulent year with mixed progress. Med J Aust 2019; 211: 490–491.e21. https://www.mja.com.au/journal/2019/211/11/2019‐report‐mja‐lancet‐countdown‐health‐and‐climate‐change‐turbulent‐year‐mixed
- 11. Zhang Y, Beggs PJ, McGushin A, et al. The 2020 special report of the MJA–Lancet Countdown on health and climate change: lessons learnt from Australia's “Black Summer”. Med J Aust 2020; 213: 492‐492.e10. https://www.mja.com.au/journal/2020/213/11/2020‐special‐report‐mja‐lancet‐countdown‐health‐and‐climate‐change‐lessons
- 12. Beggs PJ, Zhang Y, McGushin A, et al. The 2021 report of the MJA–Lancet Countdown on health and climate change: Australia increasingly out on a limb. Med J Aust 2021; 215: 390‐392.e22. https://www.mja.com.au/journal/2021/215/9/2021‐report‐mja‐lancet‐countdown‐health‐and‐climate‐change‐australia
- 13. Beggs PJ, Zhang Y, McGushin A, et al. The 2022 report of the MJA–Lancet Countdown on health and climate change: Australia unprepared and paying the price. Med J Aust 2022; 217: 439‐458. https://www.mja.com.au/journal/2022/217/9/2022‐report‐mja‐lancet‐countdown‐health‐and‐climate‐change‐australia‐unprepared
- 14. Romanello M, McGushin A, Di Napoli C, et al. The 2021 report of the Lancet Countdown on health and climate change: code red for a healthy future. Lancet 2021; 398: 1619‐1662.
- 15. Romanello M, Di Napoli C, Drummond P, et al. The 2022 report of the Lancet Countdown on health and climate change: health at the mercy of fossil fuels. Lancet 2022; 400: 1619‐1654.
- 16. Campbell S, Remenyi TA, White CJ, Johnston FH. Heatwave and health impact research: a global review. Health Place 2018; 53: 210‐218.
- 17. Tong M, Wondmagegn BY, Xiang J, et al. Heat‐attributable hospitalisation costs in Sydney: current estimations and future projections in the context of climate change. Urban Climate 2021; 40: 101028.
- 18. Watson KE, Gardiner KM, Singleton JA. The impact of extreme heat events on hospital admissions to the Royal Hobart Hospital. J Public Health (Oxf) 2020; 42: 333‐339.
- 19. Nairn J, Fawcett R. Defining heatwaves: heatwave defined as a heat‐impact event servicing all community and business sectors in Australia (CAWCR Technical Report No. 060). CSIRO and Australian Government Bureau of Meteorology, 2013. https://www.cawcr.gov.au/technical‐reports/CTR_060.pdf (viewed May 2022).
- 20. Nairn JR, Fawcett RJB. The excess heat factor: a metric for heatwave intensity and its use in classifying heatwave severity. Int J Environ Res Public Health 2015; 12: 227‐253.
- 21. Hesketh KD, Booth V, Cleland V, et al. Results from the Australian 2022 Report Card on physical activity for children and young people. J Exerc Sci Fit 2023; 21: 83‐87.
- 22. Sivaramakrishnan H, Phoenix C, Quested E, et al. “More than just a walk in the park”: a multi‐stakeholder qualitative exploration of community‐based walking sport programmes for middle‐aged and older adults. Qual Res Sport Exerc Health 2023; 15: 772‐788.
- 23. Jay O, Broderick C, Smallcombe J. Extreme heat policy. Melbourne: Sports Medicine Australia, 2021. https://sma.org.au/wp‐content/uploads/2023/03/SMA‐Extreme‐Heat‐Policy‐2021‐Final.pdf (viewed July 2023).
- 24. Jegasothy E, Hanigan IC, Van Buskirk J, et al. Acute health effects of bushfire smoke on mortality in Sydney, Australia. Environ Int 2023; 171: 107684.
- 25. McCaffrey SM, Rappold AG, Hano MC, et al. Social considerations: health, economics, and risk communication. Chapter 7. In: Peterson DL, McCaffrey SM, Patel‐Weynand T, editors. Wildland fire smoke in the United States: a scientific assessment. Cham, Switzerland: Springer Nature Switzerland AG, 2022.
- 26. To P, Eboreime E, Agyapong VIO. The impact of wildfires on mental health: a scoping review. Behav Sci (Basel) 2021; 11: 126.
- 27. Vitolo C, Di Giuseppe F, Barnard C, et al. ERA5‐based global meteorological wildfire danger maps. Sci Data 2020; 7: 216.
- 28. Bureau of Meteorology. Australia in Autumn 2023. 1 June 2023. http://www.bom.gov.au/clim_data/IDCKGC2AR0/202305.summary.shtml (viewed June 2023).
- 29. Bureau of Meteorology. Australia in summer 2022–23. 1 Mar 2023. http://www.bom.gov.au/clim_data/IDCKGC2AR0/202302.summary.shtml (viewed June 2023).
- 30. Dudgeon P, Milroy H, Walker R, editors. Working together: Aboriginal and Torres Strait Islander mental health and wellbeing principles and practice. 2nd ed. Canberra: Commonwealth of Australia, 2014. https://www.telethonkids.org.au/globalassets/media/documents/aboriginal‐health/working‐together‐second‐edition/working‐together‐aboriginal‐and‐wellbeing‐2014.pdf (viewed June 2023).
- 31. Woodward E, Hill R, Harkness P, Archer R, editors. Our Knowledge Our Way in caring for Country: Indigenous‐led approaches to strengthening and sharing our knowledge for land and sea management. Best Practice Guidelines from Australian experiences. North Australian Indigenous Land and Sea Management Alliance (NAILSMA) and CSIRO, 2020. https://www.csiro.au/en/research/indigenous‐science/Indigenous‐knowledge/Our‐Knowledge‐Our‐Way (viewed August 2023).
- 32. Dwyer A. Climate change and adaptation on Karajarri Country and ‘Pukarrikarra’ places. Nulungu Publication Series, Research Papers, No. 1. Broome: Nulungu Research Institute, 2017.
- 33. Lansbury N, Redmond AM, Nona F. Community‐led health initiatives for Torres Straits Island communities in a changing climate: implementing core values for mitigation and adaptation. Int J Environ Res Public Health 2022; 19: 16574.
- 34. Lansbury Hall N, Crosby L. Climate change impacts on health in remote Indigenous communities in Australia. Int J Environ Health Res 2022; 32: 487‐502.
- 35. Maiam nayri Wingara. Indigenous Data Sovereignty: communique. Indigenous Data Sovereignty Summit, 20 June 2018, Canberra, ACT. https://static1.squarespace.com/static/5b3043afb40b9d20411f3512/t/63ed934fe861fa061ebb9202/1676514134724/Communique‐Indigenous‐Data‐Sovereignty‐Summit.pdf (viewed August 2023).
- 36. Bourke SC, Chapman J, Jones R, et al. Developing Aboriginal and Torres Strait Islander cultural indicators: an overview from Mayi Kuwayu, the National Study of Aboriginal and Torres Strait Islander Wellbeing. Int J Equity Health 2022; 21: 109.
- 37. Garvey G, Anderson K, Gall A, et al. What Matters 2 Adults (WM2Adults): understanding the foundations of Aboriginal and Torres Strait Islander wellbeing. Int J Environ Res Public Health 2021; 18: 6193.
- 38. Department of Climate Change, Energy, the Environment and Water. Climate adaptation in Australia. https://www.dcceew.gov.au/climate‐change/policy/adaptation (viewed July 2023).
- 39. New South Wales Government. NSW Climate Change Adaptation Strategy. Sydney: NSW Government, 2022. https://www.climatechange.environment.nsw.gov.au/sites/default/files/2022‐09/NSW%20climate%20change%20adaptation%20strategy_.pdf (viewed July 2023).
- 40. Western Australia Government. Climate Resilient WA: Directions for the state's Climate Adaptation Strategy. Perth: Department of Water and Environmental Regulation, 2022. https://www.wa.gov.au/system/files/2022‐12/Climate‐resilient‐WA.pdf (viewed July 2023).
- 41. Standen JC, Spencer J, Lee GW, et al. Aboriginal population and climate change in Australia: implications for health and adaptation planning. Int J Environ Res Public Health 2022; 19: 7502.
- 42. World Health Organization. International Health Regulations (2005). 3rd ed. Geneva: WHO, 2016.
- 43. World Health Organization. IHR capacity progress. https://extranet.who.int/e‐spar/Home/Capacity (viewed June 2023).
- 44. McMichael C. Climatic and environmental change, migration, and health. Annu Rev Public Health 2023; 44: 171‐191.
- 45. Dedekorkut‐Howes A, Torabi E, Howes M. Planning for a different kind of sea change: lessons from Australia for sea level rise and coastal flooding. Clim Policy 2021; 21: 152‐170.
- 46. Internal Displacement Monitoring Centre. Country profile Australia: displacement data. https://www.internal‐displacement.org/countries/australia (viewed June 2023).
- 47. World Bank. Population, total – Australia. https://data.worldbank.org/indicator/SP.POP.TOTL?end=2020&locations=AU&start=2008 (viewed June 2023).
- 48. Hoegh‐Guldberg O, Bowen K, Capon T, et al. The risks to Australia of a 3C warmer world. Canberra: Australian Academy of Science, 2021.
- 49. Steffen W. The nature of climate‐related disasters in Australia. In: Lukasiewicz A, O'Donnell T, editors. Complex disasters: compounding, cascading, and protracted. Singapore: Springer Nature Singapore, 2022.
- 50. Productivity Commission. Report on Government Services 2023. Part D, Section 9: Released on 31 Jan 2023. 9 Emergency services for fire and other events. https://www.pc.gov.au/ongoing/report‐on‐government‐services/2023/emergency‐management/emergency‐services (viewed June 2023).
- 51. International Energy Agency. Australia has raised its climate targets and now needs to accelerate its clean energy transition, says new IEA review. News, 19 Apr 2023. https://www.iea.org/news/australia‐has‐raised‐its‐climate‐targets‐and‐now‐needs‐to‐accelerate‐its‐clean‐energy‐transition‐says‐new‐iea‐review (viewed July 2023).
- 52. Raj P, Pande S. Australia's plan to shift focus away from coal comes with own set of risks. S&P Global, 19 Oct 2022. https://www.spglobal.com/commodityinsights/en/market‐insights/latest‐news/energy‐transition/101922‐australias‐plan‐to‐shift‐focus‐away‐from‐coal‐comes‐with‐own‐set‐of‐risks (viewed July 2023).
- 53. International Energy Agency. Australia 2023: energy policy review. Paris: IEA, 2023. https://www.iea.org/reports/australia‐2023 (viewed July 2023).
- 54. Clean Energy Council. Clean energy Australia: report 2020. Melbourne: CEC, 2020. https://assets.cleanenergycouncil.org.au/documents/resources/reports/clean‐energy‐australia/clean‐energy‐australia‐report‐2020.pdf (viewed July 2023).
- 55. Clean Energy Council. Australia's big clean energy build hits record highs: Clean Energy Australia report [media release]. 18 Apr 2023. https://www.cleanenergycouncil.org.au/news/australias‐big‐clean‐energy‐build‐hits‐record‐highs‐clean‐energy‐australia‐report (viewed July 2023).
- 56. Clean Energy Council. Australian rooftop solar breaks new ground in 2022: Clean Energy Australia report [media release]. 18 Apr 2023. https://www.cleanenergycouncil.org.au/news/australian‐rooftop‐solar‐breaks‐new‐ground‐in‐2022‐clean‐energy‐australia‐report (viewed July 2023).
- 57. Clean Energy Council. Clean Energy Australia: report 2022. Melbourne: CEC, 2022. https://assets.cleanenergycouncil.org.au/documents/resources/reports/clean‐energy‐australia/clean‐energy‐australia‐report‐2022.pdf (viewed July 2023).
- 58. Centre for Air Pollution, Energy and Health Research. Daily average PM2.5 and PM10 from the National Air Pollution Monitors Database 2000‐2020, derived from CARDAT's NAPMD of regulatory monitor data from NSW DPIE, Vic EPA, Qld DES, SA EPA, WA DEWR, Tas EPA, NT EPA, and ACT Health. https://cardat.github.io/data_inventory/pm25_and_pm10_daily_averages_2000_2020.html (viewed July 2023).
- 59. AQVx and Centre for Air Pollution, Energy and Health Research. Hourly PM2.5, derived from web scraping and formal APIs of the regulatory monitor data from NSW DPE, Vic EPA, Qld DES, SA EPA, WA DEWR, Tas EPA, NT EPA, and ACT Health. http://cardat.github.io/data_inventory/aqfx_pm25_hourly_data_from_apis.html (viewed Aug 2023).
- 60. World Health Organization. Ambient Air Quality Database application. https://whoairquality.shinyapps.io/AmbientAirQualityDatabase/ (viewed July 2023).
- 61. World Health Organization. WHO global air quality guidelines: particulate matter (PM2.5 and PM10), ozone, nitrogen dioxide, sulfur dioxide and carbon monoxide. Geneva: WHO, 2021. https://apps.who.int/iris/handle/10665/345329 (viewed July 2023).
- 62. Electric Vehicle Council. State of electric vehicles: October 2022. Sydney: Electric Vehicle Council, 2022. https://electricvehiclecouncil.com.au/wp‐content/uploads/2022/10/State‐of‐EVs‐October‐2022.pdf (viewed July 2023).
- 63. Electric Vehicle Council. Australian electric vehicle industry recap 2022. https://electricvehiclecouncil.com.au/2022‐australian‐electric‐vehicle‐industry‐recap/ (viewed July 2023).
- 64. Department of Climate Change, Energy, the Environment and Water. Australian energy update 2022. https://www.energy.gov.au/publications/australian‐energy‐update‐2022 (viewed July 2023).
- 65. International Energy Agency. IEA world energy statistics and balances (datasets). 2023. https://www.oecd‐ilibrary.org/energy/data/iea‐world‐energy‐statistics‐and‐balances_enestats‐data‐en (viewed July 2023).
- 66. McGrath M. Electric car sales in Australia 2022. Budget Direct, 20 Jan 2023. https://www.budgetdirect.com.au/car‐insurance/research/electric‐car‐sales‐australia.html (viewed June 2023).
- 67. Meat & Livestock Australia. Australian red meat exports: 2022 in review. 12 Jan 2023. https://www.mla.com.au/news‐and‐events/industry‐news/australian‐red‐meat‐exports‐2022‐in‐review/ (viewed July 2023).
- 68. Department of Agriculture, Fisheries and Forestry. Climate change and the agricultural sector. https://www.agriculture.gov.au/agriculture‐land/farm‐food‐drought/climatechange (viewed July 2023).
- 69. Australian Institute of Health and Welfare. Diet. Do Australians meet the dietary guidelines? Last updated: 19 May 2023. https://www.aihw.gov.au/reports/food‐nutrition/diet#guidelines (viewed July 2023).
- 70. Ridoutt B, Baird D, Hendrie GA. Diets within environmental limits: the climate impact of current and recommended Australian diets. Nutrients 2021; 13: 1122.
- 71. Kluge H, Forman R, Azzopardi Muscat N, et al. Environmental sustainability of health systems: time to act. Lancet 2023; 401: 1552‐1554.
- 72. Insurance Council of Australia. Data hub. https://insurancecouncil.com.au/industry‐members/data‐hub/ (viewed July 2023).
- 73. National Institute of Water and Atmospheric Research. Auckland suffers wettest month in history. 2 Feb 2023. https://niwa.co.nz/news/auckland‐suffers‐wettest‐month‐in‐history (viewed July 2023).
- 74. Jones R, Macmillan A, Woodward A. Superheated storms: climate drivers, health effects and responses. N Z Med J 2023; 136: 8‐11.
- 75. Pagaduan M. Cyclone, floods leave $9bn repair bill in Auckland. Insurance Business, 29 April 2023. https://www.insurancebusinessmag.com/nz/news/catastrophe/cyclone‐floods‐leave‐9bn‐repair‐bill‐in‐auckland‐444324.aspx (viewed July 2023).
- 76. Wilson S. Rebuild or retreat? New Zealand Herald 2023; 24 June. A12‐A13.
- 77. Leptospirosis cases have more than quadrupled in Hawke's Bay. Hawkes Bay Today, 8 Mar 2023. https://www.nzherald.co.nz/hawkes‐bay‐today/news/leptospirosis‐cases‐confirmed‐in‐humans‐in‐hawkes‐bay‐after‐cyclone/A3EHP33CZJHPTGNYT2TYZUEMIE/ (viewed July 2023).
- 78. Crengle S, Davie G, Whitehead J, et al. Mortality outcomes and inequities experienced by rural Māori in Aotearoa New Zealand. Lancet Reg Health West Pac 2022; 28: 100570.
- 79. Harrington LJ, Dean SM, Awatere S, et al. The role of climate change in extreme rainfall associated with Cyclone Gabrielle over Aotearoa New Zealand's East Coast. 14 Mar 2023. https://researchcommons.waikato.ac.nz/handle/10289/15945 (viewed July 2023).
- 80. Australian Energy Regulator. State of the energy market 2022. https://www.aer.gov.au/publications/state‐of‐the‐energy‐market‐reports/state‐of‐the‐energy‐market‐2022 (viewed July 2023).
- 81. Australian Energy Market Operator. Generation information. https://aemo.com.au/energy‐systems/electricity/national‐electricity‐market‐nem/nem‐forecasting‐and‐planning/forecasting‐and‐planning‐data/generation‐information (viewed July 2023).
- 82. Australian Energy Market Operator. 2022 electricity statement of opportunities. Sydney: AEMO, 2022. https://aemo.com.au/‐/media/files/electricity/nem/planning_and_forecasting/nem_esoo/2022/2022‐electricity‐statement‐of‐opportunities.pdf (viewed July 2023).
- 83. Australian Bureau of Statistics. Employment in renewable energy activities, Australia. Reference period 2018‐19 financial year. Released 6 Apr 2020. https://www.abs.gov.au/statistics/labour/employment‐and‐unemployment/employment‐renewable‐energy‐activities‐australia/latest‐release (viewed July 2023).
- 84. Australian Bureau of Statistics. Australian industry, Reference period, 2021‐22 financial year. Released 26 May 2023. https://www.abs.gov.au/statistics/industry/industry‐overview/australian‐industry/2021‐22 (viewed July 2023).
- 85. Gilfillan G. Employment trends in coal mining and the renewable energy sector. Department of Parliamentary Services, Statistical Snapshot. Research Paper Series, 2022‐23. https://parlinfo.aph.gov.au/parlInfo/download/library/prspub/8977891/upload_binary/8977891.pdf (viewed July 2023).
- 86. Global Fossil Fuel Divestment Commitments Database. https://divestmentdatabase.org/ (viewed July 2023).
- 87. Australian Energy Market Operator. 2022 Integrated System Plan (ISP). https://aemo.com.au/en/energy‐systems/major‐publications/integrated‐system‐plan‐isp/2022‐integrated‐system‐plan‐isp (viewed July 2023).
- 88. Mehling MA, van Asselt H, Das K, et al. Designing border carbon adjustments for enhanced climate action. Am J Int Law 2019; 113: 433‐481.
- 89. Organisation for Economic Co‐operation and Development. OECD inventory of support measures for fossil fuels: Australia. OECD environment statistics (database). https://doi.org/10.1787/281c98e5‐en (viewed June 2023).
- 90. Campbell R, Morison L, Verstegen P, et al. Fossil fuel subsidies in Australia 2023: federal and state government assistance to fossil fuel producers and major users in 2022–23. Canberra: The Australia Institute, 2023. https://australiainstitute.org.au/wp‐content/uploads/2023/05/P1378‐Fossil‐fuel‐subsidies‐2023‐Web.pdf (viewed June 2023).
- 91. World Bank. Carbon pricing dashboard. https://carbonpricingdashboard.worldbank.org/ (viewed June 2023).
- 92. Department of Climate Change, Energy, the Environment and Water. Australia's national greenhouse accounts: Paris Agreement inventory. https://ageis.climatechange.gov.au (viewed June 2023).
- 93. Department of Climate Change, Energy, the Environment and Water. National Greenhouse and Energy Reporting Scheme: Safeguard Mechanism. https://www.dcceew.gov.au/climate‐change/emissions‐reporting/national‐greenhouse‐energy‐reporting‐scheme/safeguard‐mechanism (viewed June 2023).
- 94. Heenan M, Rychetnik L, Howse E, et al. Australia's political engagement on health and climate change: the MJA–Lancet Countdown indicator and implications for the future. Med J Aust 2023; 218: 196‐202. https://www.mja.com.au/journal/2023/218/5/australias‐political‐engagement‐health‐and‐climate‐change‐mja‐lancet‐countdown
- 95. Dang TN, Seposo XT, Duc NHC, et al. Characterizing the relationship between temperature and mortality in tropical and subtropical cities: a distributed lag non‐linear model analysis in Hue, Viet Nam, 2009–2013. Glob Health Action 2016; 9: 28738.
- 96. Talukder MR, Chu C, Rutherford S, et al. The effect of high temperatures on risk of hospitalization in northern Vietnam. Environ Sci Pollut Res Int 2022; 29: 12128‐12135.
- 97. Phung D, Guo Y, Nguyen HTL, et al. High temperature and risk of hospitalizations, and effect modifying potential of socio‐economic conditions: a multi‐province study in the tropical Mekong Delta Region. Environ Int 2016; 92‐93: 77‐86.
- 98. Tran QA, Le VTH, Ngo VT, et al. The association between ambient temperatures and hospital admissions due to respiratory diseases in the capital city of Vietnam. Front Public Health 2022; 10: 903623.
- 99. Giang PN, Dung DV, Giang KB, et al. The effect of temperature on cardiovascular disease hospital admissions among elderly people in Thai Nguyen Province, Vietnam. Glob Health Action 2014; 7: 23649.
- 100. Phung D, Guo Y, Thai P, et al. The effects of high temperature on cardiovascular admissions in the most populous tropical city in Vietnam. Environ Pollut 2016; 208: 33‐39.
- 101. Dang TAT, Wraith D, Bambrick H, et al. Short term effects of temperature on hospital admissions for acute myocardial infarction: a comparison between two neighboring climate zones in Vietnam. Environ Res 2019; 175: 167‐177.
- 102. Chu L, Phung D, Crowley S, Dubrow R. Relationships between short‐term ambient temperature exposure and kidney disease hospitalizations in the warm season in Vietnam: a case‐crossover study. Environ Res 2022; 209: 112776.
- 103. Trang PM, Rocklöv J, Giang KB, Nilsson M. Seasonality of hospital admissions for mental disorders in Hanoi, Vietnam. Glob Health Action 2016; 9: 32116.
- 104. Dang TN, Vy NTT, Thuong DTH, et al. Main and added effects of heatwaves on hospitalizations for mental and behavioral disorders in a tropical megacity of Vietnam. Environ Sci Pollut Res 2022; 29: 59094‐59103.
- 105. Trang PM, Rocklöv J, Giang KB, et al. Heatwaves and hospital admissions for mental disorders in Northern Vietnam. PLoS One 2016; 11: e0155609.
- 106. Xuan LTT, Egondi T, Ngoan LT, et al. Seasonality in mortality and its relationship to temperature among the older population in Hanoi, Vietnam. Glob Health Action 2014; 7: 23115.
- 107. Ngo HKT, Luong LMT, Le HHTC, et al. Impact of temperature on hospital admission for acute lower respiratory infection (ALRI) among pre‐school children in Ho Chi Minh City, Vietnam. Int J Biometeorol 2021; 65: 1205‐1214.
- 108. Luong LMT, Phung D, Sly PD, et al. Effects of temperature on hospitalisation among pre‐school children in Hanoi, Vietnam. Environ Sci Pollut Res 2019; 26: 2603‐2612.
- 109. Tran NQL, Nghiem S, Chu C, et al. The prevalence of heat‐related illnesses and associated factors among rice farmers in Vietnam. J Agromedicine 2023; 28: 486‐496.
- 110. An DTM, Hoat LN, Son DT, et al. Multilevel analysis of 24‐hour blood pressure, heart rate, and associated factors among police officers in Hanoi, Vietnam. Biomed Res Int 2020; 2020: 7494906.
- 111. Nguyen HD, Fox D, Dang DK, et al. Predicting future urban flood risk using land change and hydraulic modeling in a river watershed in the central province of Vietnam. Remote Sens (Basel) 2021; 13: 262.
- 112. Phung DT, Warren JL, Chu CM‐Y, Dubrow R. Relationship between flood severity and risk of hospitalisation in the Mekong River Delta of Vietnam. Occup Environ Med 2021; 78: 676‐678.
- 113. Trinh T‐A, Feeny S, Posso A. Rainfall shocks and child health: the role of parental mental health. Clim Dev 2021; 13: 34‐48.
- 114. Zamand M, Hyder A. Impact of climatic shocks on child human capital: evidence from young lives data. Environ Hazards Human Policy Dimensions 2016; 15: 246‐268.
- 115. Phung D, Nguyen‐Huy T, Tran NN, et al. Hydropower dams, river drought and health effects: a detection and attribution study in the lower Mekong Delta Region. Clim Risk Manag 2021; 32: 100280.
- 116. Vo TAN, Tran TK. Climate change and rural vulnerability in Vietnam: an analysis of livelihood vulnerability index. Hum Ecol Risk Assess 2022; 28: 326‐353.
- 117. Pham HV, Doan HTM, Phan TTT, Minh NNT. Ecological factors associated with dengue fever in a central highlands Province, Vietnam. BMC Infect Dis 2011; 11: 172.
- 118. Thai KTD, Cazelles B, Nguyen NV, et al. Dengue dynamics in Binh Thuan province, southern Vietnam: periodicity, synchronicity and climate variability. PLoS Negl Trop Dis 2010; 4: e747.
- 119. Do TTT, Martens P, Luu NH, et al. Climatic‐driven seasonality of emerging dengue fever in Hanoi, Vietnam. BMC Public Health 2014; 14: 1078.
- 120. Phuong LTD, Hanh TTT, Nam VS. Climate variability and dengue hemorrhagic fever in Ba Tri District, Ben Tre Province, Vietnam during 2004‐2014. AIMS Public Health 2016; 3: 769‐780.
- 121. Tuyet‐Hanh TT, Cam NN, Huong LTT, et al. Climate variability and dengue hemorrhagic fever in Hanoi, Viet Nam, during 2008 to 2015. Asia‐Pac J Public Health 2018; 30: 532‐541.
- 122. Xuan LTT, Van Hau P, Thu DT, Toan DTT. Estimates of meteorological variability in association with dengue cases in a coastal city in northern Vietnam: an ecological study. Glob Health Action 2014; 7: 23119.
- 123. Bett B, Grace D, Lee HS, et al. Spatiotemporal analysis of historical records (2001‐2012) on dengue fever in Vietnam and development of a statistical model for forecasting risk. PLoS One 2019; 14: e0224353.
- 124. Cuong HQ, Hien NT, Duong TN, et al. Quantifying the emergence of dengue in Hanoi, Vietnam: 1998‐2009. PLoS Negl Trop Dis 2011; 5: e1322.
- 125. Toan DTT, Hu W, Quang Thai P, et al. Hot spot detection and spatio‐temporal dispersion of dengue fever in Hanoi, Vietnam. Glob Health Action 2013; 6: 18632.
- 126. Minh An DT, Rocklöv J. Epidemiology of dengue fever in Hanoi from 2002 to 2010 and its meteorological determinants. Glob Health Action 2014; 7: 23074.
- 127. Vu HH, Okumura J, Hashizume M, et al. Regional differences in the growing incidence of dengue fever in Vietnam explained by weather variability. Trop Med Health 2014; 42: 25‐33.
- 128. Lee HS, Nguyen‐Viet H, Nam VS, et al. Seasonal patterns of dengue fever and associated climate factors in 4 provinces in Vietnam from 1994 to 2013. BMC Infect Dis 2017; 17: 218.
- 129. Phung D, Nguyen HX, Nguyen HLT, et al. The effects of socioecological factors on variation of communicable diseases: a multiple‐disease study at the national scale of Vietnam. PLoS One 2018; 13: e0193246.
- 130. Phung D, Huang C, Rutherford S, et al. Climate change, water quality, and water‐related diseases in the Mekong Delta Basin: a systematic review. Asia‐Pac J Public Health 2015; 27: 265‐276.
- 131. Manh BH, Clements ACA, Thieu NQ, et al. Social and environmental determinants of malaria in space and time in Viet Nam. Int J Parasitol 2011; 41: 109‐116.
- 132. Wangdi K, Canavati SE, Ngo TD, et al. Analysis of clinical malaria disease patterns and trends in Vietnam 2009‐2015. Malar J 2018; 17(1): 332.
- 133. Phung D, Huang C, Rutherford S, et al. Association between climate factors and diarrhoea in a Mekong Delta area. Int J Biometeorol 2015; 59: 1321‐1331.
- 134. Phung D, Huang C, Rutherford S, et al. Temporal and spatial patterns of diarrhoea in the Mekong Delta area, Vietnam. Epidemiol Infect 2015; 143: 3488‐3497.
- 135. Phung D, Chu C, Rutherford S, et al. Heavy rainfall and risk of infectious intestinal diseases in the most populous city in Vietnam. Sci Total Environ 2017; 580: 805‐812.
- 136. Thompson CN, Zelner JL, Nhu TDH, et al. The impact of environmental and climatic variation on the spatiotemporal trends of hospitalized pediatric diarrhea in Ho Chi Minh City, Vietnam. Health Place 2015; 35: 147‐154.
- 137. Thompson CN, Zelner JL, Nhu TDH, et al. The impact of environmental and climatic variation on the spatiotemporal trends of hospitalized pediatric diarrhea in Ho Chi Minh City, Vietnam. Health Place 2015; 35: 147‐154.
- 138. Kelly‐Hope LA, Alonso WJ, Thiem VD, et al. Temporal trends and climatic factors associated with bacterial enteric diseases in Vietnam, 1991‐2001. Environ Health Perspect 2008; 116: 7‐12.
- 139. Kelly‐Hope LA, Alonso WJ, Thiem VD, et al. Geographical distribution and risk factors associated with enteric diseases in Vietnam. Am J Trop Med Hyg 2007; 76: 706‐712.
- 140. Althouse BM, Flasche S, Minh LN, et al. Seasonality of respiratory viruses causing hospitalizations for acute respiratory infections in children in Nha Trang, Vietnam. Int J Infect Dis 2018; 75: 18‐25.
- 141. Ho NT, Thompson C, Nhan LNT, et al. Retrospective analysis assessing the spatial and temporal distribution of paediatric acute respiratory tract infections in Ho Chi Minh City, Vietnam. BMJ Open 2018; 8: e016349.
- 142. Phung D, Nguyen HX, Nguyen HLT, et al. Spatiotemporal variation of hand‐foot‐mouth disease in relation to socioecological factors: a multiple‐province analysis in Vietnam. Sci Total Environ 2018; 610‐611: 983‐991.
- 143. Van Pham H, Phan UTN, Pham ANQ. Meteorological factors associated with hand, foot and mouth disease in a Central Highlands province in Viet Nam: an ecological study. Western Pac Surveill Response 2019; 10: 18‐23.
- 144. Nguyen HX, Chu C, Tran QD, et al. Temporal relationships between climate variables and hand‐foot‐mouth disease: a multi‐province study in the Mekong Delta Region, Vietnam. Int J Biometeorol 2020; 64: 389‐396.
- 145. Truong PN, Nguyen TV, Nguyen TTT, Stein A. A spatial‐temporal statistical analysis of health seasonality: explaining HFMD infections within a children population along the Vietnamese south central coast. BMC Public Health 2019; 19: 937.
- 146. Pham NTT, Nguyen CT, Vu HH. Assessing and modelling vulnerability to dengue in the Mekong Delta of Vietnam by geospatial and time‐series approaches. Environ Res 2020; 186: 109545.
- 147. Few R, Lake I, Hunter PR, Tran PG. Seasonality, disease and behavior: using multiple methods to explore socio‐environmental health risks in the Mekong Delta. Soc Sci Med 2013; 80: 1‐9.
- 148. Nguyen QA, Miller F, Bowen K, Sinh BT. Evaluating capacity for climate change adaptation in the health and water sectors in Vietnam: constraints and opportunities. Clim Dev 2017; 9: 258‐273.
- 149. Van Minh H, Tuan Anh T, Rocklöv J, et al. Primary healthcare system capacities for responding to storm and flood‐related health problems: a case study from a rural district in central Vietnam. Glob Health Action 2014; 7: 23007.
- 150. Gilfillan D, Nguyen TT, Pham HT. Coordination and health sector adaptation to climate change in the Vietnamese Mekong Delta. Ecol Soc 2017; 22: 14.
- 151. Tu TT, Nitivattananon V. Adaptation to flood risks in Ho Chi Minh City, Vietnam. Int J Clim Chang Strateg Manag 2011; 3: 61‐73.
- 152. Tuyet Hanh TT, Huong LTT, Huong NTL, et al. Vietnam climate change and health vulnerability and adaptation assessment, 2018. Environ Health Insights 2020; 14: 1178630220924658.
- 153. Bureau of Meteorology. Previous droughts. http://www.bom.gov.au/climate/drought/knowledge‐centre/previous‐droughts.shtml (viewed July 2023).
- 154. Toomey J. Rising home insurance costs prompt questions over who should pay for increased number of claims. ABC News, 26 July 2023. https://www.abc.net.au/news/2023‐07‐26/rising‐home‐insurance‐premiums‐raise‐questions‐of‐fairness/102645526 (viewed July 2023).
- 155. Beggs PJ, Zhang Y. The Lancet Countdown on health and climate change: Australia a world leader in neglecting its responsibilities. Med J Aust 2023; 219: 528‐529. https://www.mja.com.au/journal/2023/219/11/lancet‐countdown‐health‐and‐climate‐change‐australia‐world‐leader‐neglecting
Summary