


As Australia continued its battle against coronavirus disease 2019 (COVID‐19) at the start of 2022, it was inevitably and unforgivingly reminded of the ongoing and escalating climate crisis. Record rainfalls1 led to widespread and repeated flooding in eastern Australia, with consequent impacts on people’s physical and mental health and wellbeing, and at least 21 deaths.2,3 The start of 2022 also saw another timely reminder of Australia’s vulnerability to climate‐related health impacts, with an outbreak of the mosquito‐borne Japanese encephalitis virus across several states being declared a communicable disease incident of national significance.4
These events are part of a sustained and global trend. A Lancet Commission concluded in 2009 that climate change is the biggest global health threat of the 21st century,5 and recent international and Australian reports confirm the magnitude of this impending disaster. The United Nations Intergovernmental Panel on Climate Change’s sixth assessment report on impacts, adaptation and vulnerability concluded that climate‐related illnesses, premature deaths, malnutrition in all its forms, and threats to mental health and wellbeing are increasing, and climate hazards are a growing driver of involuntary migration and displacement.6 Here in Australia, the Australian Academy of Health and Medical Sciences has recently joined the chorus of scientific and medical institutions to sound the alarm, highlighting climate change as an urgent health priority.7
With a broad range of mitigation and adaptation options available to avoid or reduce current and future adverse impacts of climate change on human health, the Lancet Commission also highlighted that tackling climate change could be the greatest global health opportunity of the 21st century.8 The Lancet Countdown has led global annual assessments of health and climate change since 2017,9,10 and the MJA–Lancet Countdown has led annual assessments of health and climate change since 2018 in Australia,11,12,13,14 the first country to produce a national Lancet Countdown report. Both the global Lancet Countdown and Australia’s MJA–Lancet Countdown aim to produce annual assessments through to the year 2030, consistent with the near‐term timeline of the Paris Agreement.15 Australia does not undertake a national health and climate change risk assessment as part of its science policy strategy, unlike the United Kingdom and some other countries. The MJA–Lancet Countdown reports fill this important gap.
The 2022 MJA–Lancet Countdown report represents the work of 13 institutions (11 Australian, one UK, and one New Zealand) in collaboration with University College London, brought together by an established partnership between The Lancet and the Medical Journal of Australia. The collaboration tracks the links between public health and climate change across five domains: climate change impacts, exposures and vulnerability; adaptation, planning and resilience for health; mitigation actions and health co‐benefits; economics and finance; and public and political engagement.
In this, the fifth year of the MJA–Lancet Countdown, we track progress on an extensive suite of indicators across these five domains, accessing, assessing and presenting the latest data and further refining and developing our analyses.
Methods
We tracked progress on health and climate change in Australia across 26 indicators within the five broad domains (Box 1). Where possible, we adopted the methods used by the Lancet Countdown, including those used in its 2022 report.16 Where more appropriate for an Australia‐focused assessment, or where it was possible to refine or improve on the original method as more precise and comprehensive data or methods were available at the national level, the method for the Australian indicators was modified or an alternative method was used. As an annual report, it is necessary for the indicators to be based on data that are produced annually and that are available to the authorship team by about March each year (preferably for the previous year), such that the required analysis can be completed and the annual manuscript can be written ready for submission to the MJA by the end of May.
Consistent with developments in the Lancet Countdown report of 2021,17 Section 4 introduces a new indicator, Coal and clean energy investment (indicator 4.2), which merges the previous two indicators in this area (Investment in new coal capacity; and Investments in zero carbon energy and energy efficiency). A new indicator is also introduced to Section 2 this year: Health adaptation plans and assessments (indicator 2.1). This provides a more integrated assessment of three previous indicators (Australian adaptation plans for health; National assessments of climate change impacts, vulnerability and adaptation for health; and City‐level climate change risk assessments) to better reflect the state of health and climate change adaptation planning and assessment in Australia. We also include two text boxes this year. The first discusses mental health and climate change in Australia, including potential methods that could be used for a future indicator in this area. In recognition of Australia’s position and relationships within the Western Pacific region, the second text box discusses health and climate change in New Zealand.
Full details of our methods, data and caveats are provided for each indicator in the Supporting Information and are numbered accordingly. We also briefly summarise the method for each indicator within the text here.
Section 1: Climate change impacts, exposures and vulnerability
Climate change has direct and indirect impacts on human health through a range of environmental exposures and climate‐related extreme events. These include repeated or prolonged exposures to heat and heatwaves, bushfires and smoke, droughts and floods, and changing risk of infectious diseases. Individual and population vulnerability to these exposures and events depends on many factors, including location (eg, proximity to a bushfire or remoteness from medical services), existing health condition (eg, respiratory, cardiovascular or mental illness), and socio‐economic status. Certain long term consequences of climate change, such as rising sea levels and prolonged or repeated floods, droughts and bushfires, might result in population displacement and even migration in certain regions. Indigenous communities in Australia are disproportionally affected by the negative health consequences of climate change, although the contribution of these communities to greenhouse gas emissions has been minimal.18 This section presents five indicators that continue our tracking of several of these impacts, exposures and vulnerabilities, as well as an exploration of mental health and climate change in Australia (Box 2).
1.1 Exposure of vulnerable populations to heatwaves
In recent years, multiple studies have demonstrated the effects of heatwaves on excess ambulance demand, hospital admissions and mortality in several sites across Australia.34,35 This indicator tracks change in a measure of heatwave intensity — the excess heat factor — as it applies to human health.36,37 The excess heat factor is based on 3‐day‐averaged daily mean temperatures. Box 3 shows the Australian averaged accumulated excess heat factor over the past 20 heatwave seasons (November–March). It also shows two trends through these data (the 20 years presented, and a longer 50‐year trend extending from 1972–1973 to 2021–2022). The 50‐year trend enables an assessment of long term change, which demonstrates a 32% increase in excess heat factor over this 20‐year period. The trend through just the 20 years presented enables an understanding of the accelerated rate of shorter term change, with a 41% rise seen over the past 20 heatwave seasons. Weighting the accumulated excess heat factor according to the population density produces a similar result, with the 50‐year and 20‐year heatwave season accumulated excess heat factor rise being 26% and 27%, respectively (Supporting Information 1.1). These concerning increases in heatwave exposure in Australia will be harming health, particularly that of those most vulnerable such as people aged over 65 years, with underlying diseases, and living in urban areas.
1.2 Heat impact on physical and sporting activities
Sport is an important part of life in Australia — keeping people active and healthy, strengthening communities, driving positive social changes, and contributing to the economy.38 This indicator follows the estimated heat stress risk of people participating in outdoor physical and sporting activities across Australia and in large cities within each state and territory. As detailed in the Sports Medicine Australia Extreme Heat Policy, moderate risk indicates that additional rest breaks should be undertaken. High risk requires the additional implementation of active cooling strategies (eg, water dousing), and extreme risk indicates that activities should be suspended.39 The policy splits sports into five risk classification groups according to the combined effects of exercise intensity and clothing/equipment worn.39 This indicator focuses on the first risk group, which includes leisurely walking.
Across Australia, conditions in 2021 led to 1.32 billion, 0.60 billion, and 0.18 billion person‐hours above the moderate, high and extreme heat stress risk threshold, respectively (Box 4). This equated to 50.5 (moderate), 22.9 (high) and 6.9 (extreme) hours above these thresholds per person in 2021. Relative to a historical 5‐year average (1991–1995 inclusive), the number of person‐hours above the moderate, high and extreme risk threshold was, respectively, 0.275 billion, 0.125 billion and 0.015 billion higher in 2021. Because 2021 was a relatively cooler La Niña year, these differences were primarily driven by increases in the Australian population. However, when comparing the most recent 5‐year average (2017–2021 inclusive) to the 5‐year average between 1991 and 1995, the average number of hours per person above the moderate, high and extreme heat stress risk threshold increased by 34.1 (+ 57%), 20.1 (+ 75%), and 10.3 (+ 109%) hours per person per year.
1.3 Bushfires
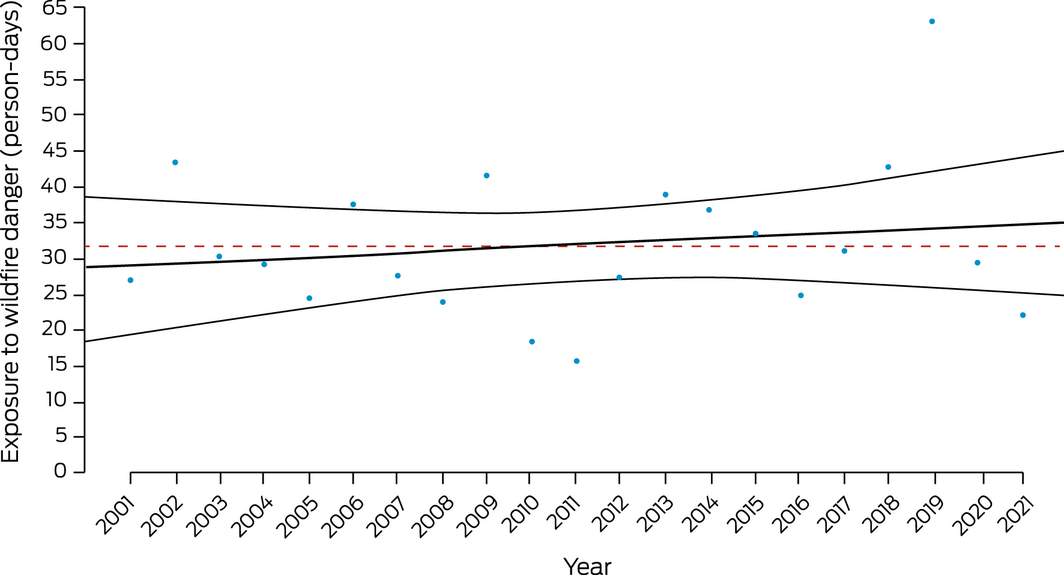
Bushfires affect population health through direct exposure to fire, exposure to bushfire smoke, and the mental trauma associated with proximity to a fire front and loss of home or business and associated forced relocation.40 Population exposure to landscape fire activity is determined from satellite observations available since 2003 (Supporting Information 1.3). This demonstrates that fire activity in Australia has remained below the historically anomalous, climate‐driven, extreme peak of 2019–202041 (Supporting Information, figure A1). This year we have included a new indicator of population exposure to very high or extreme fire danger, defined as a risk index of 5 or 6 on a 6‐point scale provided by the Copernicus Emergency Management Service for the European Forest Fire Information System.42 These data are in keeping with an overall upward trend in population exposure to more extreme fire danger conditions (Box 5).
Both fire danger and fire activity in Australia display considerable year‐to‐year variation driven by global scale climate factors, including the El Niño–Southern Oscillation cycle, the Indian Ocean Dipole and the Southern Annular Mode,43 making it challenging to observe trends in the relatively short 20‐year time frame for which data for this indicator are available. However, recent in‐depth Australian bushfire activity analysis using multi‐decadal datasets confirms a linear positive annual trend but also reveals an exponential increase during autumn and winter.44
1.4 Drought and flood
Drought and flood are real and immediate threats to many people in Australia, with Australia experiencing a record‐breaking drought and fire season in 2019–2020, followed by substantial reversion to an extreme wet period, resulting in catastrophic flooding in some jurisdictions in eastern Australia in 2022. The extent of extreme precipitation (drought and severe wet periods) is defined here using the standardised precipitation evapotranspiration index (SPEI). This measure is based on monthly rainfall and temperature to reflect the combined effects of water availability and evaporative potential. This indicator is then summarised to measure excess drought occurrence compared with an average baseline climate (1950–2005). The drought index we use is designed to rank periods of extreme dryness against all levels of rainfall experienced across a historical period. The indicator primarily reports on annual average drought but can also indicate excess levels of extreme wetness.45 In the absence of any other nationally available indicator of flood, we also use SPEI as a proxy of this. A full explanation of the methodology and additional analysis are provided in the Supporting Information. In 2019–2020, around 80% of Australian land surface experienced excess severe drought (Supporting Information, figure A2). This is consistent with a concerning substantial upward trend since 1990. The historical record shows that droughts and floods have substantially threatened the resilience of communities in Australia.46,47 Regions with particularly high levels of severe wet conditions in the first three months of 2022 included large regions of New South Wales and Queensland (Box 6; Supporting Information 1.4).
1.5 Migration, displacement and rising sea levels
Although many populations adapt in situ to climate‐related risks, others move as an adaptation measure, are forcibly displaced, or are unable to move. Health risks of climate‐related displacement can result from food insecurity, inadequate housing/shelter, altered social networks and place attachments, and disrupted health services. This indicator tracks population exposure to a sea level rise of 1 metre, and forced population displacement due to weather‐related disaster.
Based on current population data, 164 000 people in Australia live within 1 metre of average sea level and would therefore be directly affected by inundation, regardless of storm surge effects, were there to be a sea level rise of 1 metre. Sea level rise around Australia will exacerbate coastal flood risk and erosion.48
A total of 52 033 people were forcibly displaced by weather‐related disasters in Australia in 2020, including bushfires (n = 47 529), floods (n = 4201), storms (n = 223), coastal erosion (n = 52), and landslides (n = 28).49 There has been an upward trajectory in weather‐related displacement since 2008, even adjusting for population increase (Box 7). Increases in the frequency and intensity of climate and weather extremes are attributed to human‐induced climate change51 and, without further climate change mitigation and disaster risk reduction, will continue to forcibly displace more people and put health at risk across the country.
Conclusion
Our indicators show that heatwave intensity has increased over the past 20 years. Although the past two years (2020 and 2021) have been cooler than 2019, the increasing long term trend in the average number of hours per person above physical activity heat stress risk thresholds continued. Two years after the catastrophic bushfires of the 2019–2020 Black Summer, eastern Australia experienced some of the worst floods on record. This underscores the threat of the warming climate and the vulnerability of Australian communities to climate disasters.52 The increased frequency and intensity of climate extremes have resulted in disrupted health and social services and internal population displacement. Strengthened mitigation and adaptation efforts are urgently needed to address the converging climate and health crises.
Section 2: Adaptation, planning and resilience for health
The large‐scale catastrophic climate‐driven events of the past few years (bushfires and floods) have seemingly taken governments by surprise and exceeded their capacity to provide an adequate emergency response,53 leaving many people and communities on their own to cope as best they can and at exacerbated risk of adverse health impacts. In particular, in early 2022 inadequate warnings on the likely extent and speed of flooding in Brisbane and northern NSW towns such as Lismore, and the absence of a sufficient rescue response, meant that neighbours were undertaking urgent rescues of people trapped by the rising floodwaters.2,3 Even as floodwaters receded, there was little coordinated response in providing temporary accommodation, for example, for the thousands of people whose homes were made uninhabitable by the floods. Events such as this highlight the need for high level health adaptation plans, and proactive preparedness and response to these climate impacts requires better coordination and collaboration between governments, communities, Indigenous peoples, not‐for‐profit organisations, and businesses.54
2.1 Health adaptation plans and assessments
Health and climate change adaptation planning in Australia has progressed over the past year with the publication in early 2022 of the Victorian Government Health and Human Services Climate Change Adaptation Action Plan 2022–2026.55 The Northern Territory has produced a risk assessment that briefly mentions health and adaptation.56 Recent extreme events occurring over wide geographic areas across multiple states (the 2019–2020 Black Summer bushfires, and the Queensland and NSW floods in February–May 2022) highlight the growing need for a cohesive national approach to protecting health under climate change. Despite escalating extreme weather now causing nationally significant catastrophes, Australia still does not have a national health and climate change adaptation plan, putting it in the minority of countries surveyed by the World Health Organization (WHO) in 2021 (47 out of 91 [52%] have a plan).57 Although there is no national government plan, Australia’s Climate and Health Alliance has produced and subsequently updated a National Framework for Health Adaptation Planning58 that potentially lays the foundation for such a plan. In 2021, the Australian Government Department of Agriculture, Water and the Environment published a National Climate Resilience and Adaptation Strategy, covering the period 2021–2025, in which health was briefly mentioned.59 Promisingly, a new National Health and Medical Research Council (NHMRC)‐funded $10 million research network based at the Australian National University — the Healthy Environments And Lives (HEAL) Network — is tasked with producing a national health and climate change adaptation plan; our future reports will assess the progress of this.
2.2 Climate information services for health
Climate information services for health such as those provided by the Bureau of Meteorology (BOM) are an important aspect of health and climate change adaptation. This indicator tracks the development and number of such services as well as use of the BOM heatwave service. BOM provides routine heatwave and ultraviolet radiation information services to the public and to the health sector on its website, mobile app, and other channels. Web traffic to the heatwave website (http://www.bom.gov.au/australia/heatwave) parallels the accumulated excess heat factor (see indicator 1.1 Exposure of vulnerable populations to heatwaves). In the 2020–2021 and 2021–2022 warm seasons, the number of page views per day (derived from Google Analytics) averaged 490 and 653, respectively — around half the volume of the previous two years that experienced more heatwaves.
For the 2021–22 season, BOM provided a new heatwave decision support product to state and territory agencies that lead the heatwave response. BOM also worked with these health and emergency services agencies to trial a heatwave warning. Feedback from the trial evaluation will be used to support the rollout of a national public heatwave warning service in October 2022.
BOM works with the Commonwealth Scientific and Industrial Research Organisation to provide smoke forecasts to some Australian fire agencies to support planned burn decisions. During the Victorian grass pollen season (October–December), thunderstorm asthma forecasts are provided by BOM, together with the Victorian Department of Health, the University of Melbourne and Deakin University.60
2.3 Detection, preparedness and response to health emergencies
The International Health Regulations (2005)61 (IHRs) are an instrument of international law designed to prevent, protect against, control and provide a public health response to potential public health emergencies and the international spread of infectious disease. With weather and climate causing or contributing to many public health emergencies and the spread of many infectious diseases, the IHRs serve as an important indicator of national climate change and health adaptive capacity. Countries report to the World Health Assembly on the implementation of the IHRs across 13 capacities. For this indicator, we track Australia’s reported implementation of the health emergency management capacity from 2018 to 2021. Australia’s score for this capacity dropped below 100% for the first time in 2021 since it was introduced by the WHO in 2018 (Box 8). For continuity with previous MJA–Lancet Countdown reports,11,12 we also report Australia’s surveillance and public health human resources capacities. The latter dropped below 100% in 2021 for the first time over this period; the former has been below 100% over the 4‐year period, and in 2021 was at 80%. We also highlight that Australia’s zoonotic diseases capacity has been well below 100% over this period, but its health services provision capacity increased to 100% for the first time in 2021 (Supporting Information 2.3). Limitations of the IHRs in ensuring an effective response to the COVID‐19 pandemic have been identified and continue to be evaluated and reviewed. However, countries with higher capacity scores were found to have lower incidence and mortality per 100 000 population within 30 days from first COVID‐19 diagnosis, stressing the relevance of the IHRs.62
2.4 Bushfire adaptation
As highlighted elsewhere in this report (eg, indicator 1.3 Bushfires) and in our 2020 report that focused on Australia’s 2019–20 Black Summer,14 bushfires are a major climate‐related extreme event with direct and indirect consequences for human health. To track progress on bushfire adaptation in Australia, we analyse aerial and terrestrial firefighting capacity (Box 9). Although National Aerial Firefighting Centre aircraft services have increased since 2007–08, from just over 30 to the current 164, the number of volunteer firefighters and support staff in Australia has decreased since 2015–16 and is currently at its lowest point since the Productivity Commission started reporting on this area of government services in 2009–10 (Supporting Information 2.4).
Conclusion
This section has assessed several aspects of climate change adaptation, planning and resilience for health in Australia. Most notably, we find a continuing absence of a national health and climate change adaptation plan and a decrease below 100% for the first time in Australia’s reported implementation of the IHR health emergency management capacity. However, important progress has been made in other areas, including the publication of Victoria’s health and climate change adaptation plan and the long term increase in aerial firefighting capacity in Australia. The increasing frequency and scale of extreme climate‐related events such as fires and floods across multiple states highlight the urgent need for a national approach to climate change adaptation in Australia to ensure that lives and livelihoods are better protected. Responsibilities cross state boundaries and require a coordinated approach that is adequately resourced; sharing resources such as firefighting equipment and personnel across jurisdictions can only happen when there are sufficient resources and people to do so.
Section 3: Mitigation actions and health co‐benefits
The lockdowns and other non‐pharmaceutical public health interventions during the COVID‐19 pandemic resulted in considerable emission reductions and lower energy use in sectors such as transportation.63 However, these outcomes were short‐lived. Whereas total carbon dioxide (CO2) emissions globally decreased in 2020 owing to the impacts of COVID‐19, there is already substantial evidence that the COVID‐19 recovery might not lead to the lasting drop in emissions that many had hoped for.64 The indicators in this section assess a range of climate change mitigation actions and health co‐benefits in Australia.
3.1 Carbon intensity of the energy system
Consistent with our previous reports, we define the carbon intensity of the energy system as “the tonnes of CO2 emitted for each unit of primary energy supplied”.12 Data are now available up to 2020 for Australia, Brazil, Germany and the United States, and up to 2019 for the People’s Republic of China and India (Box 10). The latest data suggest a substantial decrease in the carbon intensity of total primary energy supply during the COVID‐19 pandemic. Despite the decrease in 2020, the carbon intensity of Australia’s total primary energy supply continues to be the highest among the countries analysed and has again surpassed that of China in 2019 (noting that 2020 figures are not yet available for China). However, there is already strong evidence that the COVID‐19 recovery will lead to substantial emission increases in Australia and other countries in future years, with a potentially widening gap expected between countries that were already “greener” before the pandemic and had higher investments in green recovery plans, and those that backed a fossil‐fuel led recovery.66
3.2 Coal phase‐out
Coal use represents an important health hazard, as coal is a major contributor to air pollution.67 In addition, coal is the most carbon‐intense fossil fuel, and the single biggest contributor to global CO2 emissions. Quickly phasing out coal is therefore a priority both for health and for climate change mitigation.
Australia exports most (about 81%) of its energy production, which includes coal and liquefied natural gas exports, and Australia is the world’s second largest exporter of coal by weight. Australian coal production declined 8% in 2020, and Australian coal exports to China continue to face sizeable restrictions due to China’s unofficial ban on Australian coal. In 2020–2021, however, Australian coal was exported to new destinations in Asian markets, including India and Korea.68 Australia, alongside Indonesia, has retained its position as one of the world’s largest net exporters of coal, substantially contributing to global CO2 emissions.
Domestically, coal continues to have a major role in meeting Australia’s energy needs. However, Australia is increasingly focusing on substituting coal with natural gas‐fired power, and there has been some growth in renewable power.69 As a result, domestic coal consumption for electricity generation has decreased by about 18% since 2018.69 Important to note is that production of metallurgical coal in Australia is expected to increase by 11 megatonnes by 2024, as Australia’s federal and state governments have approved new mine developments.68
3.3 Zero carbon emission electricity
In line with our previous reports, zero or low carbon sources are those that “have zero carbon or low carbon emissions at the point of energy production (ie, this excludes biomass, but includes nuclear and hydro)”.12 The major development for Australia in 2021 was the release of a long term emissions reduction plan at the federal level70 that promised net zero emissions by 2050, which was assembled amid much international pressure ahead of the COP26 conference. However, the plan was subject to much criticism, particularly because it was not backed by policy measures and was reliant on the introduction of unclear “new technology” to bring anticipated emission reductions. However, it must be noted here that states and territories have started to fill this void and have introduced more ambitious targets to drive the energy transition.71 Australia still lags behind countries such as Germany and the UK that have led the adoption of renewable and zero and low carbon energy sources, as previously reported.12 However, recent data show promising progress in transitioning away from coal, with a shift towards 32.5% renewable electricity generation (Box 11).71
3.4 Clean household energy
We previously reported that 17% of Australia’s electricity came from renewable energy sources in 2018.72 This share increased to 21–24% in 2019.12,73 New data from 2021 suggest that 32.5% of Australia’s total electricity generation is now coming from renewable sources, which is a substantial increase over previous years but still much below other countries such as Germany or the UK, which have been well above 40% already in prior years.12
We also reported that Australia had 220 000 rooftop solar systems installed in 2018, 287 504 in 2019, and new data show that there were 389 577 rooftop solar systems installed in 2021.71 There has also been growth in the installation of household batteries, with 34 731 household batteries installed in 2021, up from 23 796 batteries in 2020.71 Evidence regarding improvements for Australia’s remote and Indigenous communities is again lacking.
3.5 Sustainable and healthy transport
Owing to the impact of the COVID‐19 pandemic, energy use associated with transport has declined for the first time in 20 years. Despite the decline, transport continues to be the largest consumer of energy in Australia.74 Fossil fuels continue to be the predominant fuel for the transport sector, contributing substantially to harmful air pollution levels and greenhouse gas emissions, although electricity use in the transport sector has slowly increased from 2010 to 2020 (Box 12). As shown in Box 13, the sale of electric vehicles (EVs) in Australia has increased considerably in 2021, with sales tripling from 6900 in 2020 to 20 665 in 2021, accounting for a 2% market share of new light vehicles, up from 0.78% in 2020.75 The escalation in EVs in 2021 is, in part, attributed to the fact that Tesla (12 094 vehicles sold in 2021) disclosed their sales figures for the first time.75 However, part of the increased EV sales could be attributed to the proactive stance by all Australian states and territories, which now have strategies to enhance the uptake of EVs, including comprehensive incentive programs such as stamp duty waivers, registration discounts, rebates and interest‐free loans.76 Despite more positive findings compared with previous years, Australia continues to be a long way from achieving sustainable transport, particularly when compared with other Organisation for Economic Co‐operation and Development countries. Proactive policies that encourage the transition to EVs by investing more in EV infrastructure, rebates and national fuel efficiency standards are urgently needed.
3.6 Emissions from agricultural production and consumption
Agricultural production and consumption of food products result in emissions of a range of greenhouse gases. For example, rearing livestock for meat production results in methane emissions as part of their digestive processes.
More than 50% of production‐based emissions from agricultural food products stem from cow and buffalo meat production (Box 14; Supporting Information, figure A3), followed by sheep and goat products. Production of fruits, vegetables and melons, rice and maize is much less emissions‐intensive than meat production. From a consumption perspective, red meat and milk consumption are key drivers of emissions in the agricultural sector (Supporting Information, figure A4). Interestingly, there has been a downward trend in per capita red meat consumption in Australia (Supporting Information, figure A5), in part because of an observed shift to environmentally friendly and healthier dietary habits.77
3.7 Diet and health co‐benefits
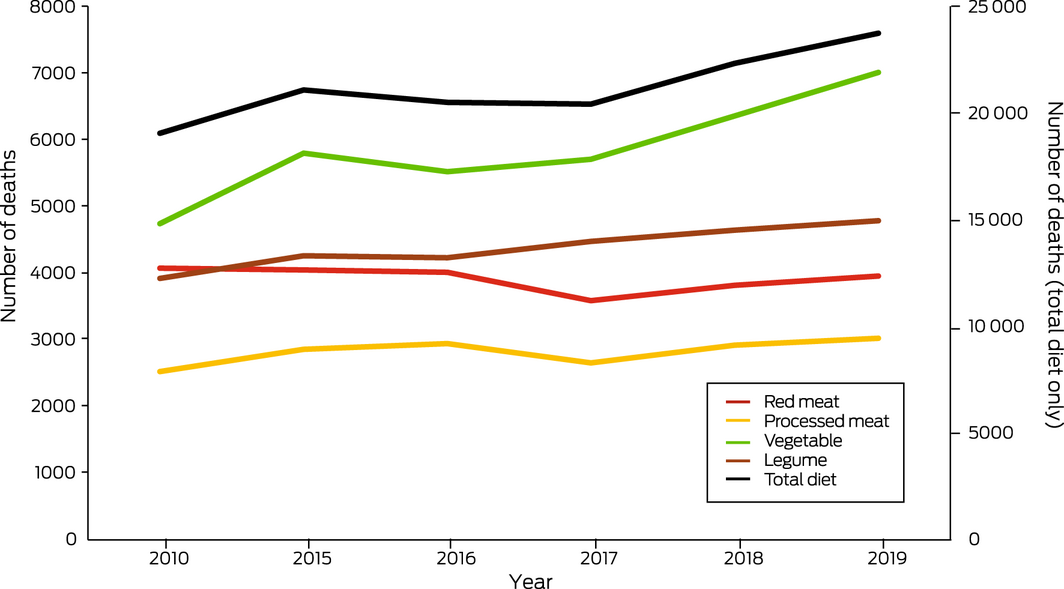
This indicator presents the change in deaths attributable to dietary risks. The Lancet Countdown provided methods, data and results.16 Between 2010 and 2019, all diet‐related deaths in Australia increased by 25%, from 19 030 to 23 728 (Box 15). Inadequate vegetable and legume consumption largely accounts for this increase, although diet‐related deaths related to processed meat consumption also increased over this period. However, high meat consumption is still an important contributor to diet‐related deaths in Australia, with high red meat and processed meat consumption combined accounting for about one‐third of diet‐related deaths in 2019, with the remainder largely accounted for by low vegetable and legume consumption. In line with the Australian dietary guidelines, many lives could be saved in Australia each year by a lowering of population‐level meat consumption and increasing vegetable and legume consumption. Analysis shows that a diet consistent with Australian dietary guidelines had a 42% lower climate footprint than the current average diet of Australian adults.78 Adherence to the dietary guidelines would therefore have the co‐benefit of reducing Australia’s greenhouse gas emissions plus lead to further health benefits.
3.8 Mitigation in the health care sector
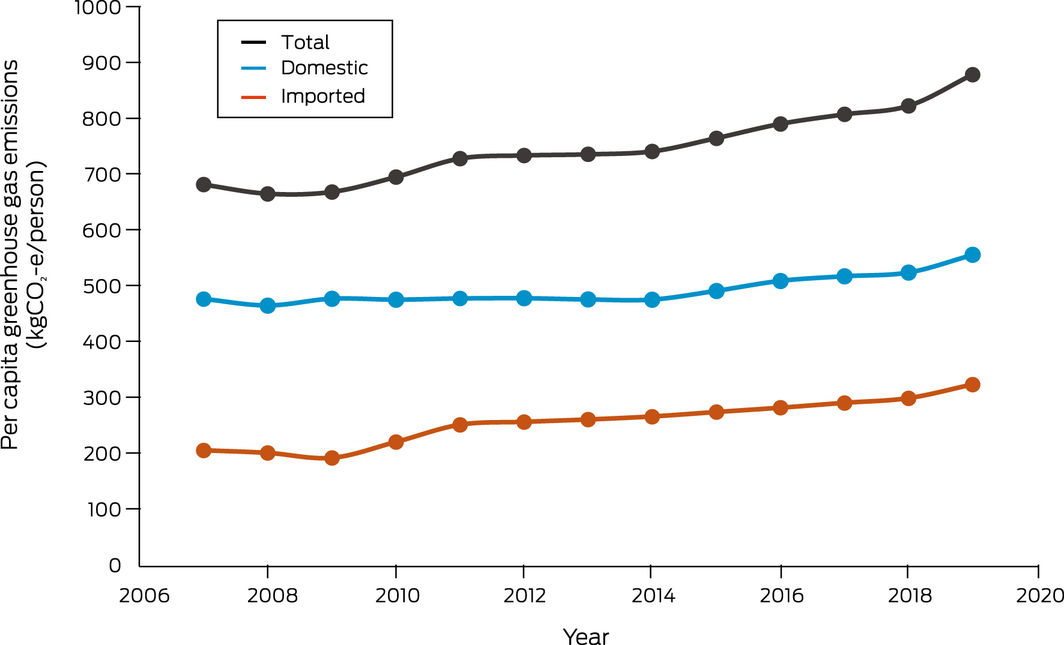
This indicator provides a quantitative assessment of the annual domestic, imported and total greenhouse gas emissions embodied in Australia’s health care sector from 2007 to 2019. This indicator builds on data and methods presented in the 2021 Lancet Countdown report.17 Specifically, the indicator captures emissions of the following gases: CO2, methane, nitrous oxide, nitrogen oxides, sulfur oxides, carbon monoxide, non‐methane volatile organic compounds, and ammonia using an environmentally extended multiregional world input–output database79 coupled with data on health expenditure from the WHO Global Health Expenditure Database80 for calculating consumption‐based impacts.81
Australia’s health sector emissions have continued to increase over time, both in absolute terms (Supporting Information, figure A6) and per capita terms (Box 16). This rise aligns with trends observed in the global health sector.17 The bulk of emissions from health care comes from hospitals, pharmaceuticals and medicinal goods.82
Conclusion
This section has shown that Australia has made some progress towards transitioning away from coal, with a shift to 32.5% renewable electricity generation, and there has been increased uptake of clean household energy and EVs. However, it also shows that high meat consumption is still a sizeable contributor to diet‐related deaths in Australia as well as contributing to its greenhouse gas emissions, and per capita emissions from Australia’s health care sector are continuing to rise. There is a need for further decarbonisation and a phase‐out of coal in Australia’s energy mix, a need for clearer policy goals at the federal level that support the transition to clean energy, and a need to adopt clearer frameworks and targets for sustainable transportation, food production and consumption, as well as for a more sustainable health sector. Importantly, outcomes are uneven across Australian society, with crucial datapoints and progress reports missing for Australia’s remote and Indigenous communities.
Section 4: Economics and finance
This section reports the financial cost of climate‐related extreme events and examines existing economic and financial mechanisms to protect human health from the impacts of climate change. We focus on recent developments with regard to mitigating carbon emissions and the transition of the electricity sector to a higher share of renewable energy generation. Indicators measure investment in coal and clean energy generation, employment in renewable energy activities and high carbon industries, as well as funds divested from assets involved in the extraction of fossil fuels and the generation of energy from fossil fuels. We also report recent developments on fossil fuel subsidies and carbon pricing.
4.1 Economic losses due to climate‐related extreme events
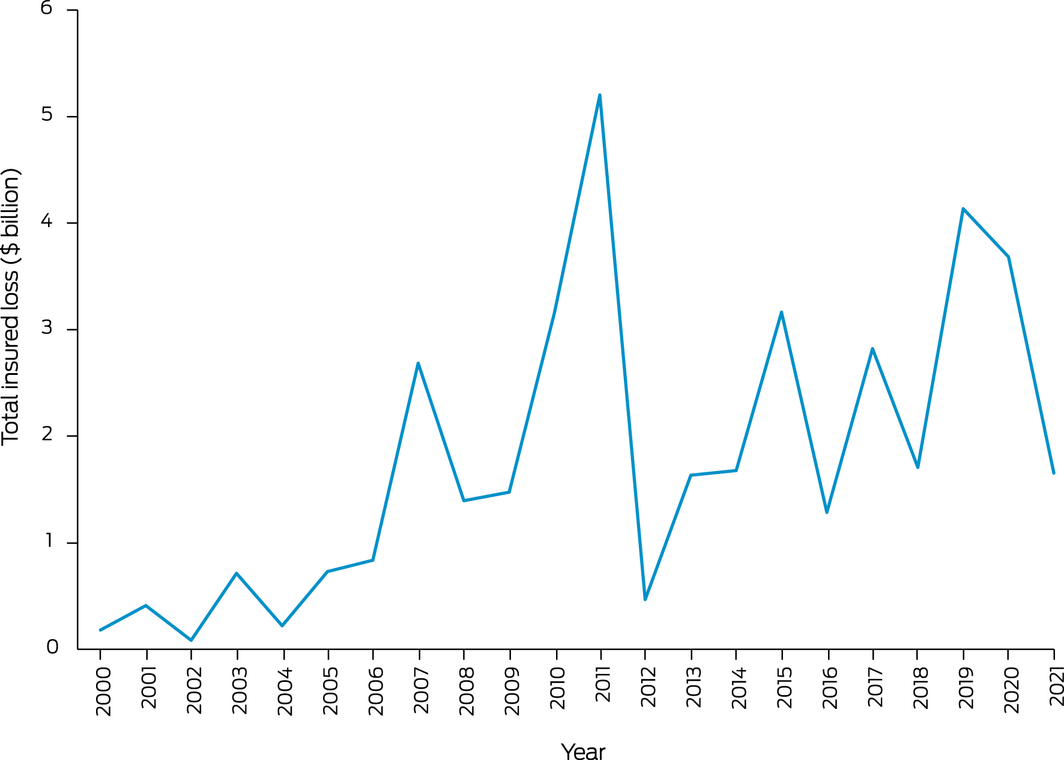
The indicator tracks the total insured economic losses from disaster events in Australia and is based on numbers provided by the Insurance Council of Australia.83 Box 17 plots inflation‐adjusted cumulative annual insured losses from bushfires, cyclones, flooding, hailstorms, storm flooding, and tornadoes. For 2020, total annual insured losses from catastrophes were $3.7 billion — the second highest since 2011. Losses could mainly be attributed to hailstorms in January 2020, eastern Australian coastal storms and flooding in February 2020, and the Halloween hailstorm in Queensland in October 2020. For 2021, the total estimated insured losses were $1.7 billion, including losses from the March 2021 eastern Australian floods, tropical cyclone Seroja in Western Australia in April 2021, and storm damage and flooding in Victoria in June 2021. The estimate for 2021 does not yet include losses from storms in South Australia, Victoria and Tasmania in October 2021, and severe flooding in central Queensland in November and December 2021. Therefore, insured losses for 2021 are likely to increase substantially once these events are accounted for.
4.2 Coal and clean energy investment
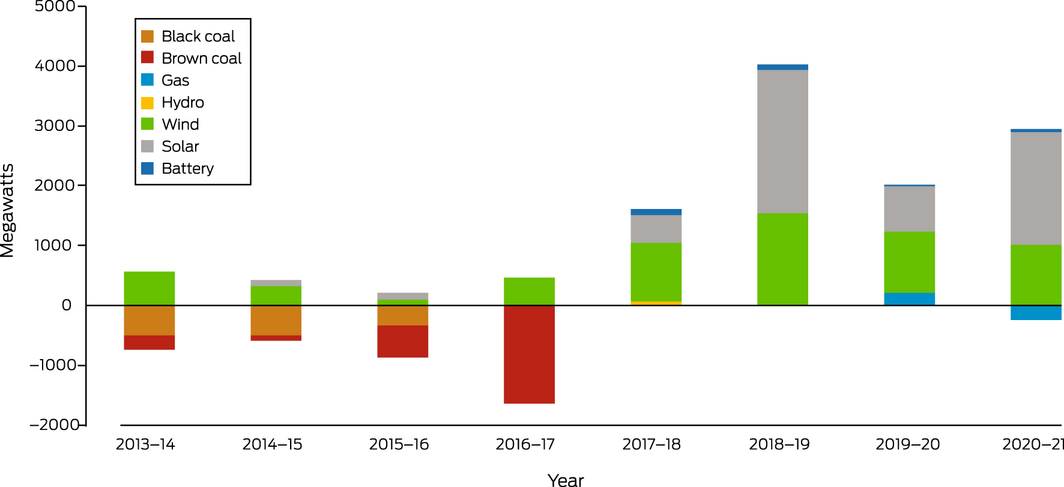
The indicator reports investment in new coal and renewable zero carbon energy‐based generation capacity in the Australian National Electricity Market (NEM). According to the latest report of the Australian Energy Regulator (AER)84 and the Australian Energy Market Operator (AEMO),85 there is no planned investment in new coal‐fired generation, while between 2013 and 2021, over 1300 MW of black coal and 2500 MW of brown coal generation assets have been removed from the market (Box 18). During the same period, over 6000 MW capacity of wind and over 5700 MW of solar generation were added to the NEM. Substantial additional investment in variable renewable energy generation has been committed.
While the growth in renewable generation is impressive, the transition has substantially reduced the capacity of dispatchable generation in the NEM, and the AER and AEMO have emphasised increased concerns about reliability.84 The AEMO forecasts that Australia needs to invest in an additional 26–50 GW of new large‐scale variable renewable energy generation beyond existing, committed and anticipated projects to replace retiring fossil fuel‐fired power plants.86
The retirement of several major coal‐fired plants has been scheduled for upcoming years, including Liddell power station (2000 MW, NSW) in 2023.84,85 The planned closure of Eraring (2880 MW, NSW) and Yallourn power stations (1450 MW, Victoria) has been moved forward by several years to 2025 and 2028, respectively. According to the AEMO Integrated System Plan,86 over 15 GW of coal‐fired generation will have been retired by 2040.
4.3 Employment in low carbon and high carbon industries
This indicator reports full‐time equivalent (FTE) employment in low carbon and high carbon industries. Unfortunately, the Australian Bureau of Statistics has not updated direct FTE employment in renewable energy activities in Australia since 2020. The latest estimate is available for the 2018–19 financial year, suggesting an FTE employment of 26 850.87 Box 19 illustrates the substantial growth in FTE employment in the renewable sector since 2015–16 that can be expected to continue.
Employment in the mining sector was chosen as a key representative for employment in high carbon industries. FTE employment in mining operations has increased by 5.1% to about 188 000 for the 2019–20 financial year, with the largest increases in the coal and metal ore mining industries.88 The figures indicate that FTE employment in the mining sector in Australia is substantially higher than FTE employment in renewable energy activities.
4.4 Funds divested from fossil fuels
Removing funds away from fossil fuel industry investment (ie, divestment from fossil fuels) is critical to promoting the transition towards a low carbon economic system. This indicator tracks divestment from fossil fuels in Australia using the number of companies and organisations that have partially or entirely committed to divest themselves of assets involved in the extraction of fossil fuels and generation of energy from fossil fuels. Data from the Global Fossil Fuel Divestment Commitments Database89 show only a very minor increase to 214 divesting institutions in Australia over the past 12 months. Only two of these are health institutions, but others include private health insurers and HESTA Super Fund.
4.5 Net value of fossil fuel subsidies and carbon prices
Carbon pricing instruments can help the market value of fossil fuels better reflect their actual costs to the broader economy, and account for at least some of their negative externalities. Despite the expansion of carbon prices worldwide, and the impending carbon border adjustment mechanisms that will likely have a substantial impact on carbon‐intensive exports from Australia,90 Australia does not currently have an explicit carbon price. Using the standard data sources for 2019, Australia’s total fossil fuel subsidies were reported to be $8.7 billion91 and total carbon price revenues were reported to be zero.92
Total CO2 emissions were reported to be 374 megatonnes for 2019.74 The calculation of the subsidy per tonne of CO2 (subsidy/emissions) therefore equals $23.25 per tonne of CO2, with a carbon price per tonne of CO2 of zero. The net carbon price (the carbon price less the subsidy) equals $–23.25 per tonne of CO2.
As previously noted, the above‐mentioned subsidy is likely to be conservative.12 Further, the recently implemented “gas‐fired recovery” in 2022 as a response to the COVID‐19 pandemic will further force this trend upwards without other major mitigating policies to counter it. The Australian Government announced the planned launch of the Australian Carbon Exchange in 2023, which will operate in a similar way to online stock exchanges, but in the purchase, clearing and settlement of Australian carbon credit units and potentially other types of carbon units and certificates.93
Conclusion
The indicators show a continued trend of rising economic losses from climate‐related extreme events. They also indicate a considerable increase in investment in generation capacity from renewables, while generation from fossil fuels has been reduced and the planned closure of major coal‐fired power plants has been moved forward. However, this transition has also led to concerns about future system reliability, requiring substantial additional investment in renewable generation beyond existing and already committed projects. The indicators also show that employment in the mining sector has further increased; and unlike many other countries around the world, Australia has still not introduced a price on carbon emissions. Only 214 Australian companies and organisations have committed to divestment from fossil fuels.
Section 5: Public and political engagement
Public and political engagement is a prerequisite for action on climate change — for efforts to curb carbon emissions and limit further global heating, and for efforts to ameliorate the health impacts of climate change that are now unavoidable. This section tracks engagement in health and climate change across multiple sectors of society, including media, governments, researchers, and research funders. The methods used for these indicators in previous reports have been adopted again this year.
5.1 Media coverage of health and climate change
This indicator tracks the national media coverage of health and climate change content. We used the same methods as last year,12 including 13 national and regional high circulation English language newspapers, as well as Australian Broadcasting Corporation (ABC) online news and transcripts in the Factiva media database. The total number of newspaper articles on health and climate change in 2021 (186) was 1.5 times that of 2020 (124) (Box 20). However, the coverage varied greatly according to location, and the increase was mainly observed in Melbourne, Adelaide, Hobart and Brisbane. The lowest coverage of the topic has been in Perth since 2019. Of these articles, 71% mentioned “pandemic” in the context of health and climate change. The ABC online content on health and climate change in 2021 also slightly increased compared with 2020 (Supporting Information, figure A7). This indicates that media attention to climate change and health topics has increased despite the ongoing fight against the COVID‐19 pandemic. However, there was still a low number of articles on how to adapt to a changing climate to reduce the health consequences.
5.2 Coverage of health and climate change in scientific journals
This indicator continues to track scientific publications on health and climate change in Australia, using the same methods as last year, using the Scopus database.12 Our findings show a surge in the number of publications in 2021, with 233 new scientific publications on health and climate change. This represents a 79.2% increase on 2020 (130) and a 13.7‐fold increase compared with the number of publications in 2008 (17) (Box 21). Original research articles accounted for 54.5% of the total publications (127 of 233 publications). There was an increased number of literature reviews and editorial articles published in 2021 compared with 2020. Less than half of the 2021 publications (108, 46.5%) were in medicine, with increasing studies in other disciplines. Most studies focused on health impact assessments, with fewer studies on mitigation and adaptation. Heat and bushfire were the most focused exposures, whereas mental health and infectious diseases were the most studied health outcomes. There were 17 studies that examined the link between COVID‐19 and environmental and climatic factors.
5.3 Government engagement in health and climate change
Government engagement in health and climate change was assessed using Australian parliamentary websites to identify whether and how Australian governments were responding to climate change as a health issue, and/or whether health was identified as an issue affected by climate change. The parliamentary websites for the Commonwealth of Australia and all eight states and territories were searched for bills, legislation, committees and inquiries. Overall engagement with the topic of health and climate change increased for all parliaments in 2021 compared with 2020. However, engagement was not very explicit, with climate health a primary focus of very few bills or inquiries. Governments, oppositions and minor parties across the political spectrum are engaging on the issue.
In 2021, eight bills were introduced in the Parliament of Australia that referred to climate change and health within the legislation — five more than the previous year (Supporting Information, figure A8). Of note, the Climate Change (National Framework for Adaptation and Mitigation) (Consequential and Transitional Provisions) Bill 2021 and Climate Change (National Framework for Adaptation and Mitigation) Bill 2021 require the government to consider climate change impacts, including health, when exercising their powers and duties. Another six bills mentioned climate change and health within the explanatory memorandum but not within the legislation itself (Supporting Information, table A1). Only one chamber document included climate change and health in the title (Supporting Information, table A2). This motion called on the government to “urgently develop a ‘National Strategy on Climate Change, Health and Well‐being’, which is supported by more than 50 health, social welfare and conservation groups”.94 No parliamentary committees or inquiries were found that discussed the health impacts of climate change. The May 2022 Australian federal election resulted in a change of government from the Liberal–National Coalition to the Australian Labor Party. The Australian Labor Party’s stronger commitment to climate change policies contributed to this change, and our future annual reports will assess their performance on health and climate change.
At a state and territory level, Hansard searches revealed parliamentary documents containing climate change and health in all jurisdictions (Supporting Information, table A3). Ten bills related to climate change and health were introduced into five state and territory parliaments (Supporting Information, table A4), an increase from only one in 2020. Twelve inquiries were held across the country that discussed climate change as a health issue in reports, submissions or public hearings, an increase from only two in 2020. Of these, only one included the health impacts of climate change within the terms of reference, the Inquiry into the Health Impacts of Air Pollution in Victoria. Across the country, there was only one committee tasked with portfolio responsibility for health and climate issues, the Parliament of Queensland Standing Committee on Health and Environment. However, it is not clear from public descriptions that climate change as a health issue is a central focus of the committee.
5.4 Health and climate change research funding
Research on health and climate change in Australia is fundamental to Australia’s understanding of and response to this critical issue. This indicator tracks the annual number of funded and not‐funded NHMRC health and climate change grant applications from 2000 to 2021 (Box 22). The most recent year (2021) saw a continued reversal of the downward trend in health and climate change grant applications that occurred from 2011 to 2018, with a total of 16 applications. In an important advance over the previous two years, the success rate in 2021 was very good (25%), with the four applications funded being the equal second highest number of annual applications that have been funded in this field over this 22‐year period. It is also noteworthy that a 5‐year, $10 million NHMRC Special Initiative in Human Health and Environmental Change was funded in 2021.95 This is a landmark in research funding in the health and climate change field and the resulting Healthy Environments And Lives (HEAL) Network is expected to boost research capacity and capability across the country in the coming years (Supporting Information 5.4).
Conclusion
The indicators tracked in this section show that Australian media attention to health and climate change in 2021 increased compared with 2020 despite a continuing media focus on the COVID‐19 pandemic. They also show an 80% increase in scientific publications on health and climate change in Australia. While the number of NHMRC funding applications for research on health and climate change remained stable in 2021 compared with the previous two years, the success rate increased substantially in 2021. Attention to climate change and health in Australian parliaments increased during 2021; however, health and climate change is not yet reflected in the titles of government bills. Having assessed Australia’s progress on health and climate change in detail in this and the previous four sections, and in recognition of Australia’s position in and relationships within the Western Pacific region, we also provide here for the first time a snapshot of health and climate change in New Zealand (Box 23) with which Australia can be compared.
Conclusion: the MJA–Lancet Countdown in 2022
Within just two years, Australia has experienced two unprecedented national climate catastrophes: the 2019–2020 summer heatwaves and bushfires and the 2021–2022 torrential rains and floods. Such events are costing lives and displacing tens of thousands of people. Despite the Royal Commission into National Natural Disaster Arrangements, such events continue to catch Australia off guard. Indeed, our analysis shows that there are clear signs that Australia’s health emergency management capacity substantially decreased in 2021.
There are, however, some signs of progress with respect to health and climate change. The states continue to lead the way in terms of health and climate change adaptation planning, with the Victorian plan being published in early 2022. At the national level, we note progress in the funding of health and climate change research by the NHMRC; and we now see an acceleration in the uptake of electric vehicles and a continued uptake of and employment in renewable energy. However, Australia’s transition to renewables and zero carbon remains unacceptably slow, and the Australian Government’s continuing failure to produce a national climate change and health adaptation plan does not bode well for the future.
Australia’s greatest threat, including to the health of its people, is not from beyond its borders — it is from within. Australia’s failure to play its part in the mitigation of climate change and to adequately prepare for its myriad impacts is now costing lives. As powerfully expressed by Norman Frank Jupurrurla, a Wumpurrarni (First Nations) man of Tennant Creek (Northern Territory), “when it comes to climate change we should all be strong voices working together — for healthy country, healthy communities, healthy children”.106
This 2022 MJA–Lancet Countdown report has also stressed the importance of a mental health and climate change in Australia indicator, which we plan to include in our 2023 report. Similarly, our exploration of health and climate change in New Zealand reveals similarities but also important differences between Australia and New Zealand with respect to health and climate change. It also highlights areas for potential cooperative efforts, such as deeper analysis of the respective health care sector carbon footprints and mitigation opportunities that may emerge from this.
Box 1 – The five sections and 26 indicators of the 2022 MJA–Lancet Countdown report
|
Section |
Indicator |
||||||||||||||
|
|
|||||||||||||||
|
1 Climate change impacts, exposures and vulnerability |
1.1 Exposure of vulnerable populations to heatwaves |
||||||||||||||
|
1.2 Heat impact on physical and sporting activities |
|||||||||||||||
|
1.3 Bushfires |
|||||||||||||||
|
1.4 Drought and flood |
|||||||||||||||
|
1.5 Migration, displacement and rising sea levels |
|||||||||||||||
|
2 Adaptation, planning and resilience for health |
2.1 Health adaptation plans and assessments |
||||||||||||||
|
2.2 Climate information services for health |
|||||||||||||||
|
2.3 Detection, preparedness and response to health emergencies |
|||||||||||||||
|
2.4 Bushfire adaptation |
|||||||||||||||
|
3 Mitigation actions and health co‐benefits |
3.1 Carbon intensity of the energy system |
||||||||||||||
|
3.2 Coal phase‐out |
|||||||||||||||
|
3.3 Zero carbon emission electricity |
|||||||||||||||
|
3.4 Clean household energy |
|||||||||||||||
|
3.5 Sustainable and healthy transport |
|||||||||||||||
|
3.6 Emissions from agricultural production and consumption |
|||||||||||||||
|
3.7 Diet and health co‐benefits |
|||||||||||||||
|
3.8 Mitigation in the health care sector |
|||||||||||||||
|
4 Economics and finance |
4.1 Economic losses due to climate‐related extreme events |
||||||||||||||
|
4.2 Coal and clean energy investment |
|||||||||||||||
|
4.3 Employment in low carbon and high carbon industries |
|||||||||||||||
|
4.4 Funds divested from fossil fuels |
|||||||||||||||
|
4.5 Net value of fossil fuel subsidies and carbon prices |
|||||||||||||||
|
5 Public and political engagement |
5.1 Media coverage of health and climate change |
||||||||||||||
|
5.2 Coverage of health and climate change in scientific journals |
|||||||||||||||
|
5.3 Government engagement in health and climate change |
|||||||||||||||
|
5.4 Health and climate change research funding |
|||||||||||||||
|
|
|||||||||||||||
|
|
|||||||||||||||
Box 2 – Measuring mental health impacts of climate change in Australia
- Identifying a mental health indicator is essential for tracking the impacts of climate change on human health and progress in addressing these impacts. However, challenges in tracking progress in mental health are longstanding and include a lack of agreement on indicators and vast data gaps.19
- Previous attempts at identifying a suitable indicator for the mental health impacts of climate change have been made. The MJA–Lancet Countdown has cited suicide rates as a candidate, with the evidence suggesting that higher mean annual temperatures predict elevated age‐adjusted suicide rates in warmer jurisdictions, while the inverse leads to elevated suicide rates in cooler jurisdictions.11,13 However, the evidence for this association appears to be less clear at the global level.20 Although suicide is an important health outcome worthy of inclusion as an indicator, it does not always correlate with mental health outcomes. Some suicides are known to be a reactive response to a stressor without the presence of an underlying mental disorder.21
- The 2021 Lancet Countdown global report included a mental wellbeing indicator (1.1.5).17 This indicator assesses “the influence of extreme heat on sentiment with Twitter data to capture people’s online expressions”. The report’s authors recognise that “while sentiment is related to mental wellbeing, it should not be confused as a measure of it and should be interpreted as an indicative proxy of the mental implications of extremes of heat”.17
- We must do better. Australian researchers are producing robust research on the mental health impacts of climate change, particularly relative to other countries.22 Recent Australian‐based research has continued to mount evidence linking climatic factors, such as rainfall,23,24 drought,25 humidity, air pressure, temperature and hours of sunshine26 with mental health. Perhaps of particular importance is the impact of heat, which has been identified as a specific vulnerability for Australia in the most recent Intergovernmental Panel on Climate Change report27 and has been extensively linked to poorer mental health.28
- Of the numerous mental health outcomes explored in the literature, there remains no clear choice of indicator.29 A fundamental limitation to this process is the difficulties in collecting and the limited availability of mental health data. However, two mental health measures are more frequently used in Australian research and may be viable as future mental health indicators.
- ► The Kessler Psychological Distress Scale, a 10‐question screening scale for psychological distress and the most widely used instrument used in the literature.22 It possesses strong psychometric properties and can discriminate Diagnostic and statistical manual of mental disorders, fourth edition (DSM‐IV) cases of major depression and generalised anxiety disorder30 and has been used repeatedly in Australian mental health surveys.31,32 However, limitations exist in the resource‐intensive nature of primary data collection, existing restrictions on accessing datasets, and the granularity of geolocated data.
- ► Administrative data, which provide an alternative to survey data as a potential measure of more serious mental health outcomes. These can include mental health‐related hospital admissions, emergency department presentations, and deaths. Although these data often capture the most severe and less prevalent end of the mental disorder spectrum, they will miss much of the disease burden. Indeed, it is unlikely that one singular indicator will be capable of providing a comprehensive picture of the mental health impacts of climate change.
- It is clear that mental health data availability is crucial in this pursuit. Increasing efforts to create accessible mental health databases that can be linked with the multiple available environmental databases seems essential.33 Opportunities to include mental health indicators in research assessing climate change impacts on health are worthy of exploration.33
Box 3 – Nationally averaged Australian heatwave season (November–March) accumulated excess heat factor (EHF) for the past 20 heatwave seasons (2002–2003 to 2021–2022)
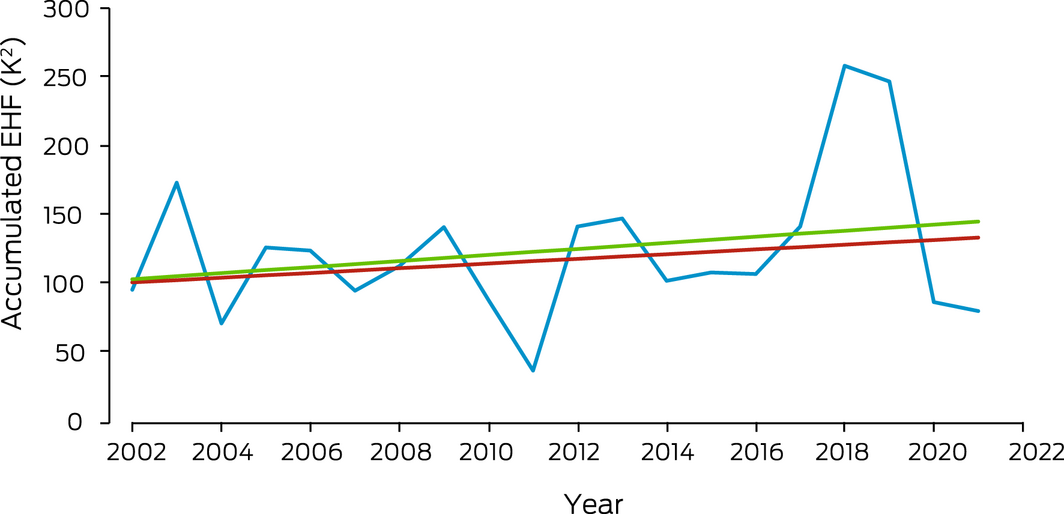
The blue line shows accumulated EHF by year. The red trend line is calculated over the past 50 heatwave seasons (1972–1973 to 2021–2022); the green trend line is calculated over the past 20 heatwave seasons.
Box 4 – Cumulative number of hours annually per person (A) and the number of person‐hours (B), from 1991 to 2021, across Australia that exceeded the moderate, high and extreme heat stress risk threshold as defined by the 2021 Sports Medicine Australia Extreme Heat Policy39
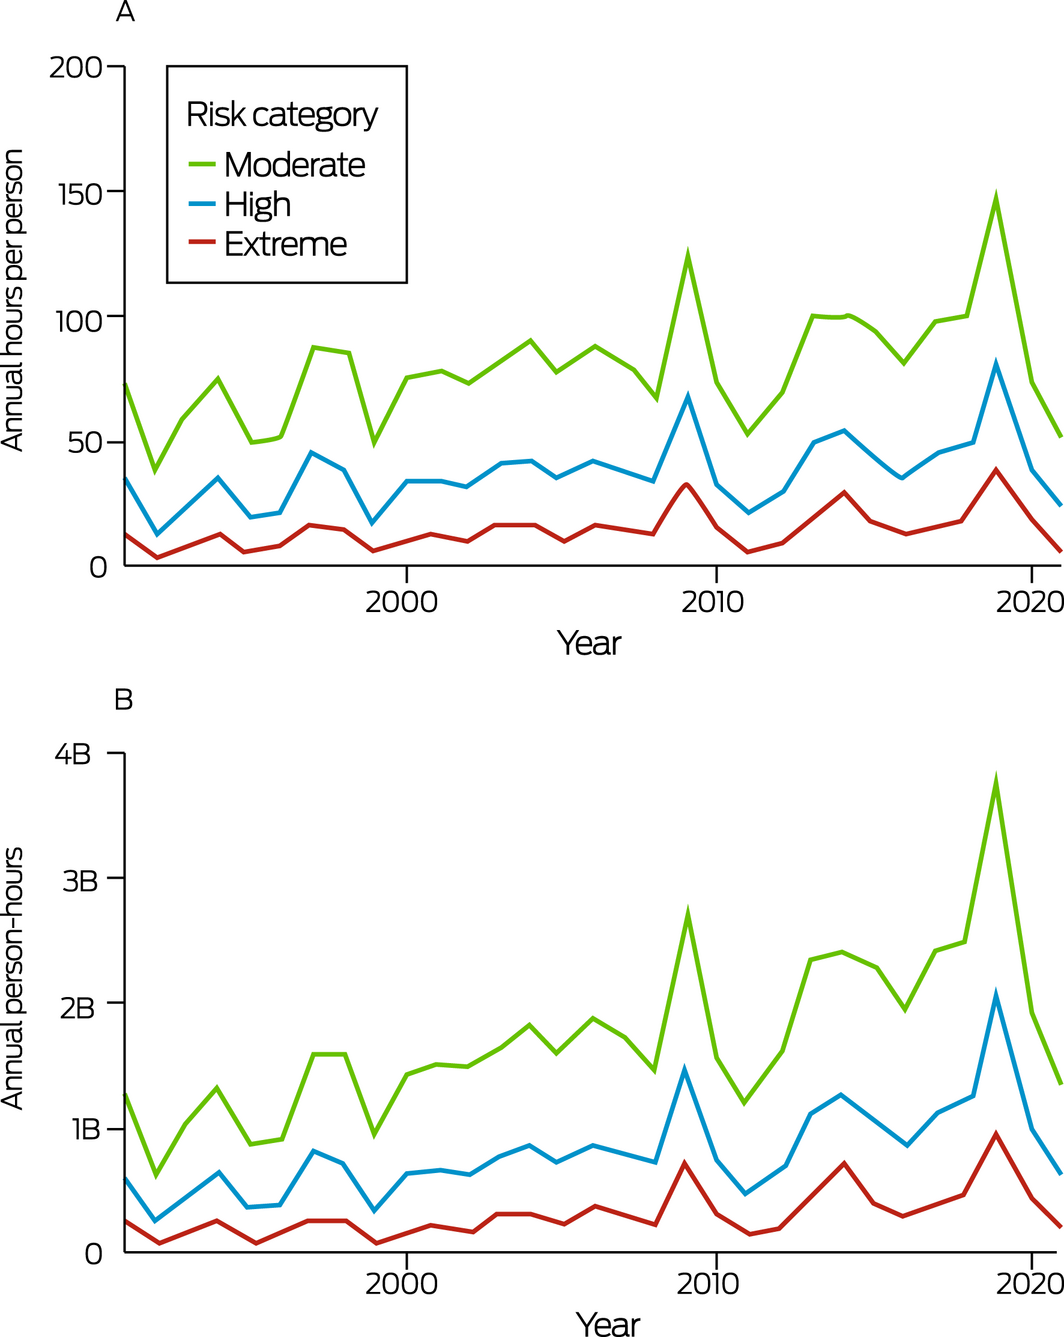
B = billion.
Box 5 – Annual person‐day exposure to very high or extreme wildfire danger in Australia, 2001–2021 (blue dots), showing trend with 95% confidence intervals (black lines) and the average (dashed red line) for the entire time period
Box 6 – Average monthly standardised precipitation evapotranspiration index (SPEI) values from January to March 2022 in Australia
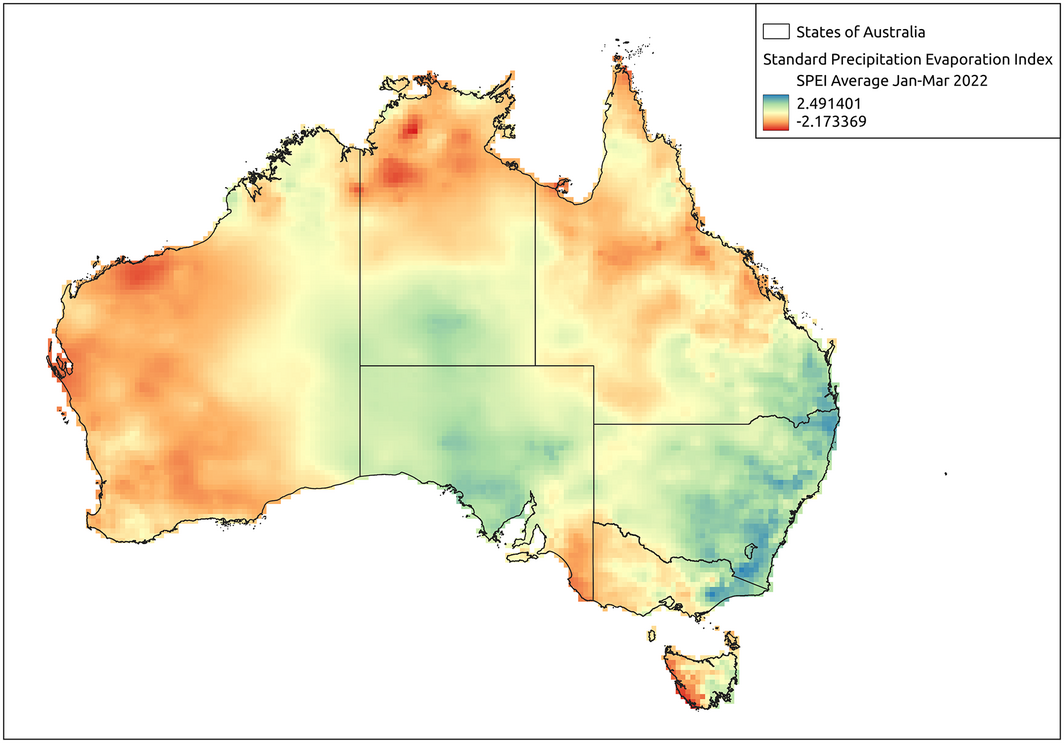
Positive values indicate surplus water availability (ie, wet periods) compared with the standardised baseline climate, whereas negative values indicate moisture deficits (ie, drier conditions). The average value of SPEI is 0, and the standard deviation is 1. Levels below ‐1.3 are considered droughts.
Box 7 – Annual displacement caused by weather‐related disaster in Australia, 2008–2020
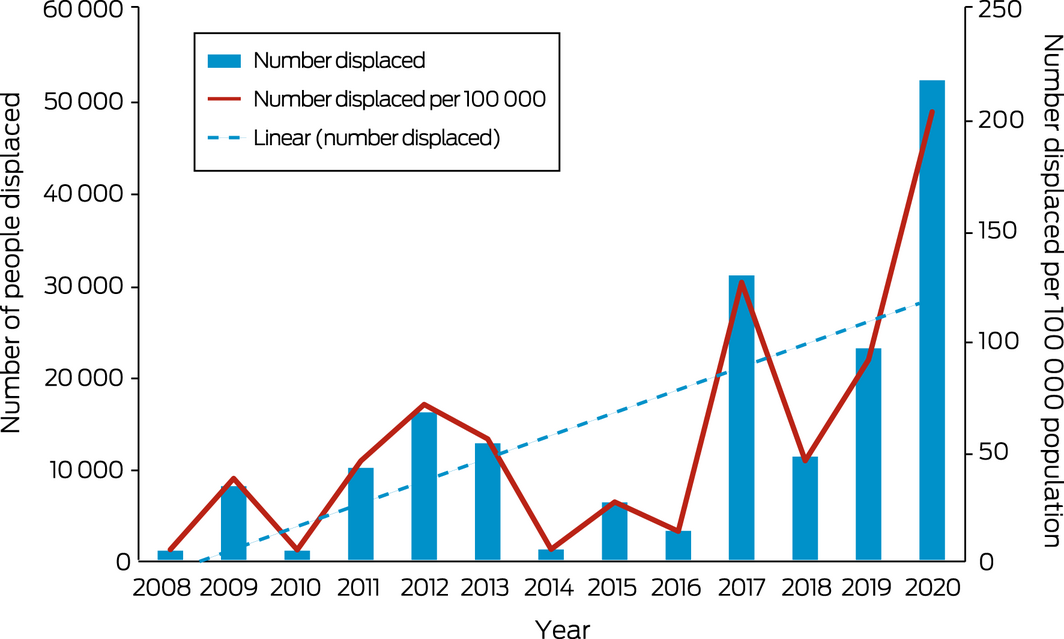
The blue dashed line is the linear trend line of the number displaced from 2008 to 2020.
Data sources: Internal Displacement Monitoring Centre;49 World Bank.50
Box 8 – International Health Regulations (2005) monitoring framework average capacity scores for Australia, the WHO Western Pacific Region and the globe, for zoonotic events and the human–animal interface, surveillance, human resources, national health emergency framework, and health service provision, 2018–2021
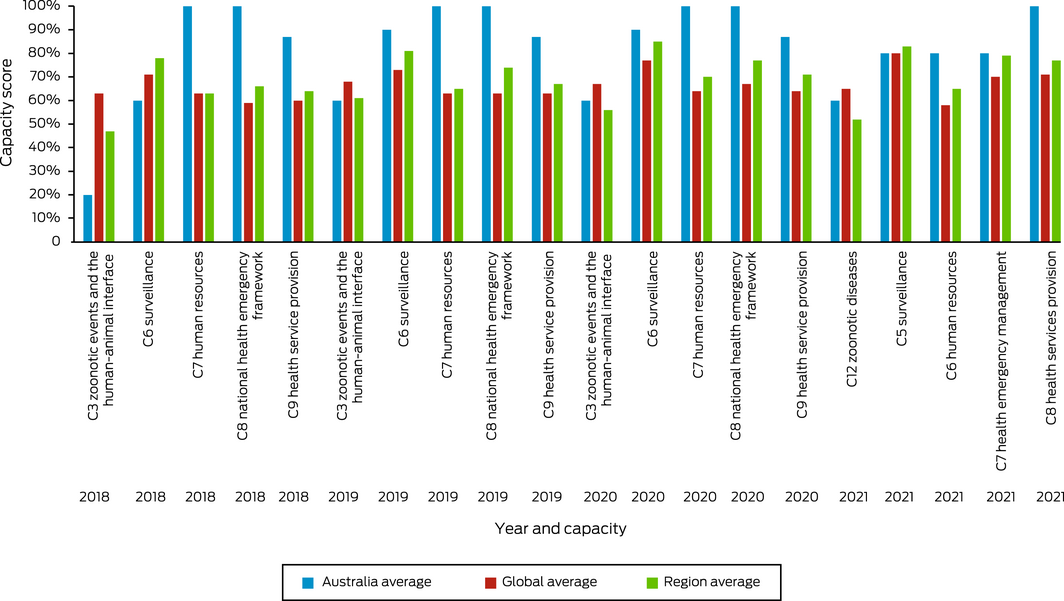
Data source: World Health Organization (https://extranet.who.int/e‐spar/Home/Capacity [viewed May 2022]).
Box 9 – Annual number of National Aerial Firefighting Centre (NAFC) aircraft services and volunteer firefighters and support staff in Australia from 2007–08 to 2021–22
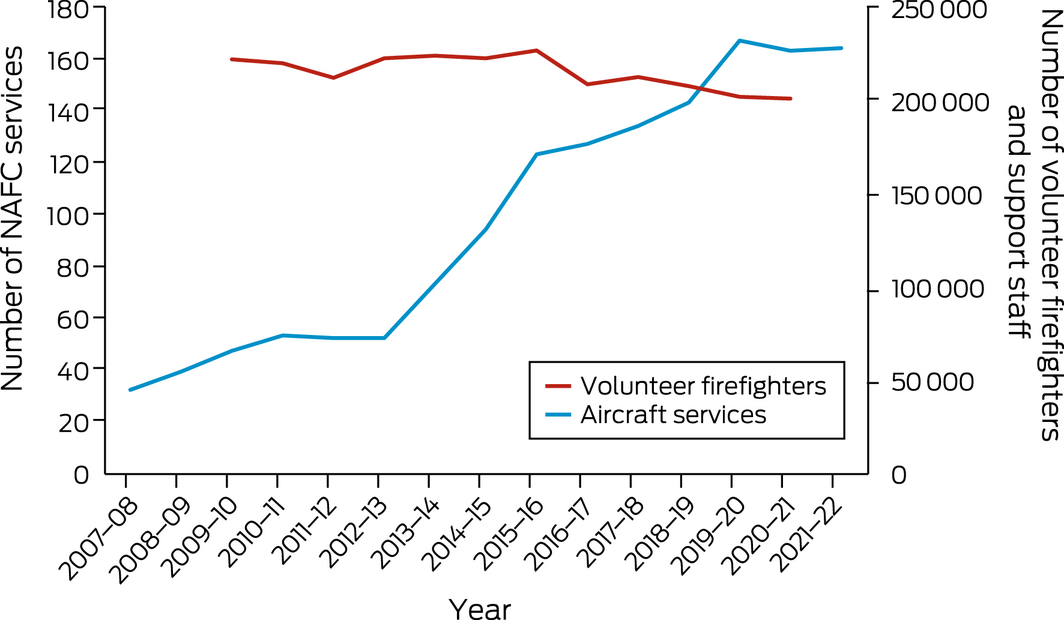
NAFC aircraft services represent the number of aircraft in Australia available to fight bushfires. Note that some aircraft double up for the north and south of the country; for example, an aircraft might run in Queensland then move to Tasmania as a separate service. A service is usually exclusive to NAFC use, mostly for 84 or 96 days each summer (some services run longer).
Data sources: NAFC; Australian Government Productivity Commission (https://www.pc.gov.au/research/ongoing/report‐on‐government‐services/2022/emergency‐management/emergency‐services [viewed Mar 2022]).
Box 10 – Carbon intensity of total primary energy supply for Australia, selected countries and the world, and corresponding total carbon dioxide (CO2) emissions, 1971–2020
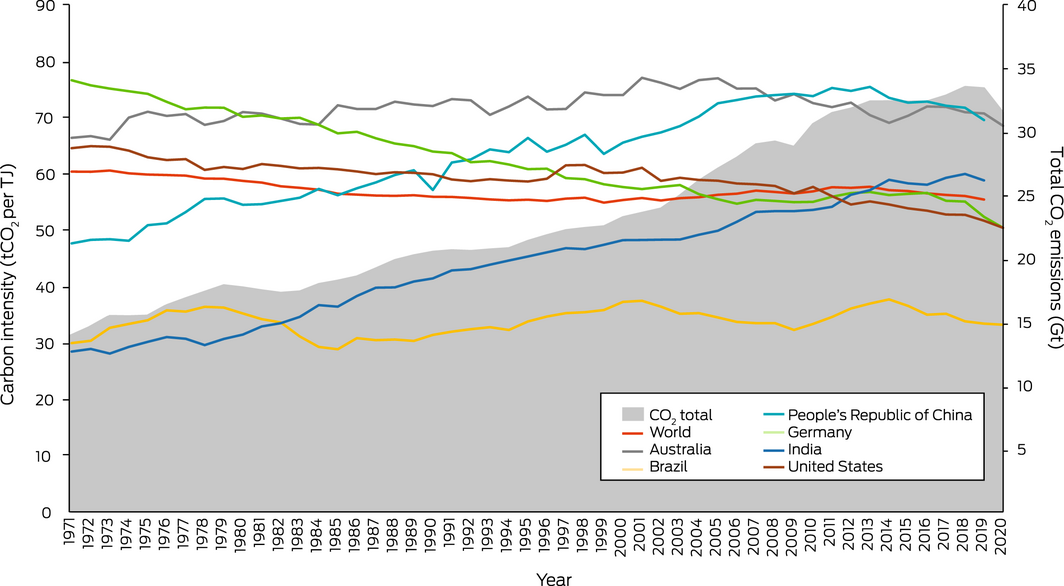
Data source: International Energy Agency.65
Box 11 – Sources of electricity generation (A) and renewable electricity generation technology types (B), in Australia in 2021
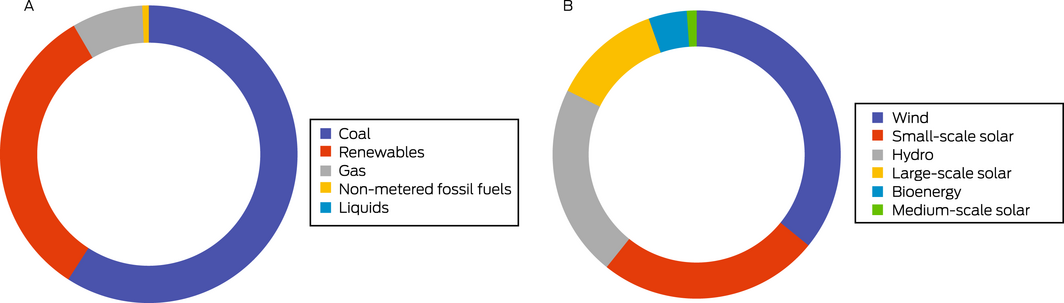
Source: Clean Energy Council.71
Box 12 – Australian transport energy consumption by fuel types, 2010–2020
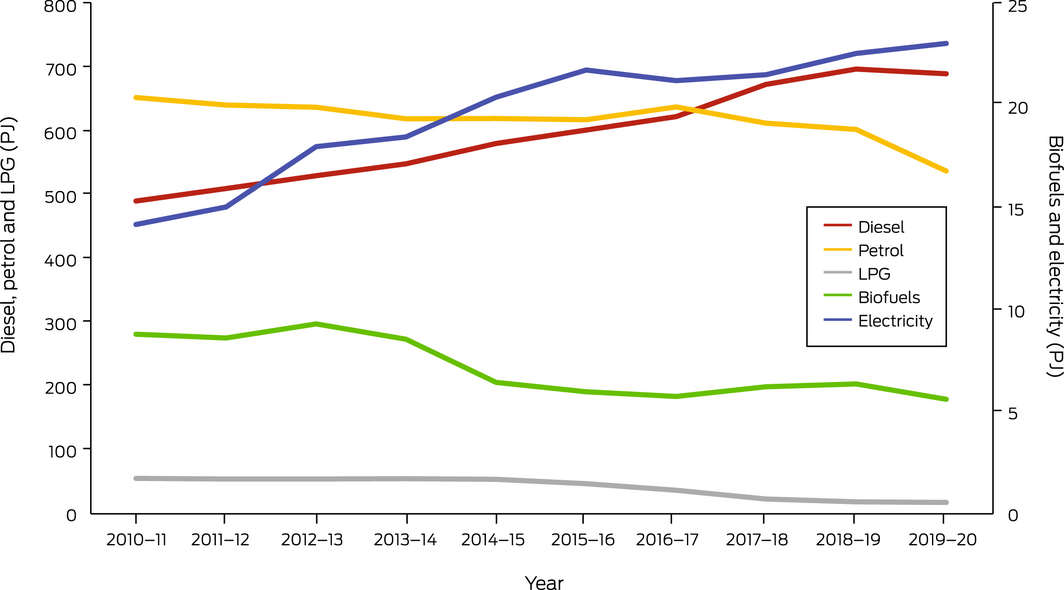
LPG = liquid propane gas; PJ = petajoules.
Data sources: Electric Vehicle Council; Federal Chamber of Automotive Industries.
Box 13 – Annual electric vehicle sales in Australia, 2011–2021
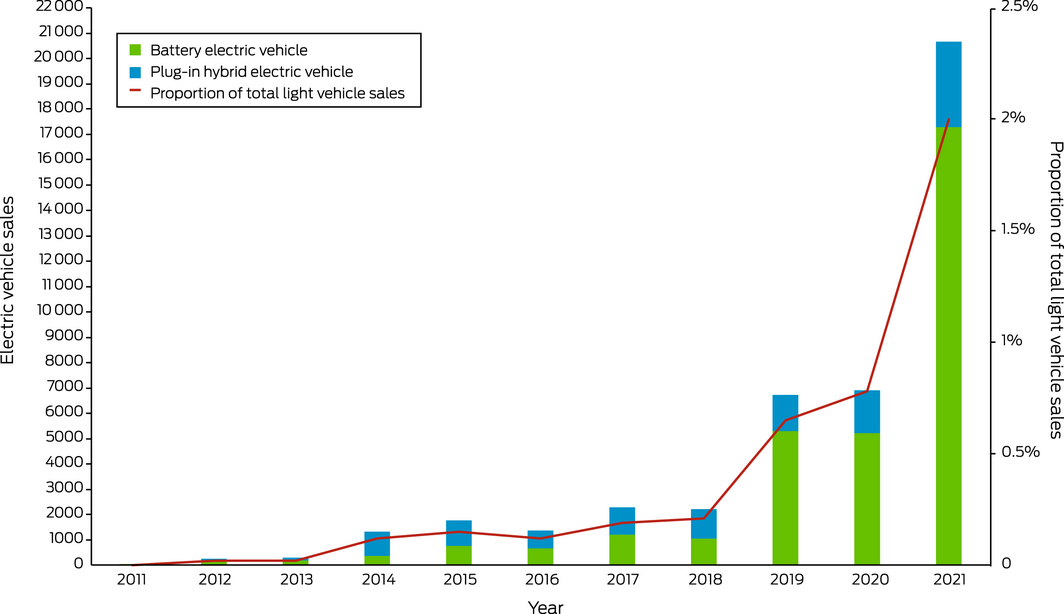
Data source: Electric Vehicle Council (https://electricvehiclecouncil.com.au/reports/state‐of‐electric‐vehicles‐2021/; https://electricvehiclecouncil.com.au/reports/state‐of‐electric‐vehicles‐march‐2022/ [viewed Apr 2022]).
Box 14 – Greenhouse gas emissions from agricultural food production in Australia: trends from 1995 to 2019
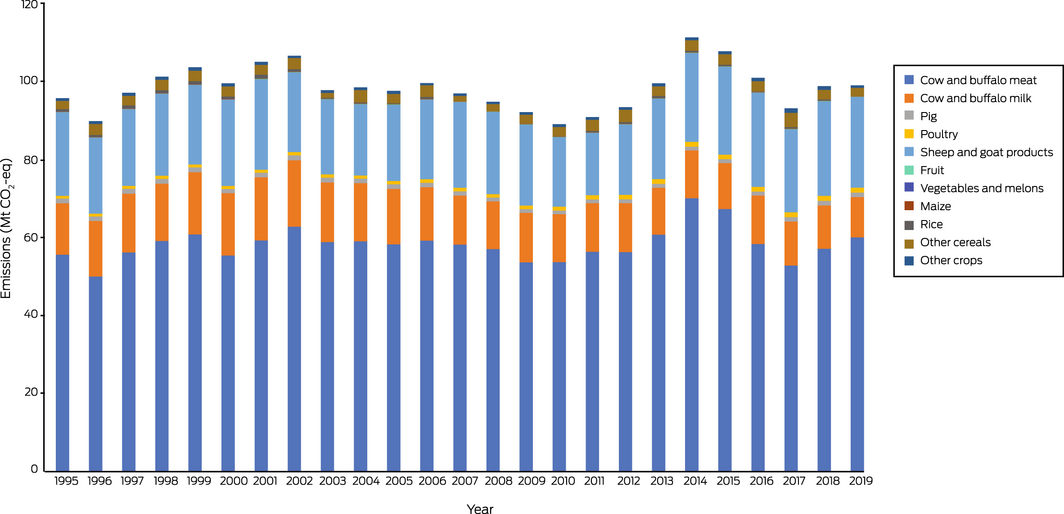
Mt CO2‐eq = million tonnes of carbon dioxide equivalent.
Box 15 – Annual all‐cause diet‐related deaths from high red meat consumption, high processed meat consumption, low vegetable consumption, low legume consumption and total diet in Australia, 2015–2019 (2010 as baseline)
Box 16 – Per capita greenhouse gas emissions for Australian health care: trends from 2007 to 2019, showing domestic per capita, imported per capita and total per capita emissions
kgCO2‐e = kilograms of carbon dioxide equivalent.
Box 17 – Annual inflation‐adjusted total insured economic losses in Australia from bushfires, cyclones, flooding, hailstorms, storm flooding and tornadoes for the period 2000–2021 based on Insurance Council of Australia Historical Catastrophe Data83
Box 18 – New investment and capacity withdrawal in the Australian National Electricity Market for different fuel sources (black coal, brown coal, gas, hydro, wind, solar and battery) for financial years 2013–14 to 2020–21
Data sources: Australian Energy Regulator;84 Australian Energy Market Operator.85
Box 19 – Annual direct full‐time equivalent (FTE) employment in renewable energy activities for Australia, New South Wales, South Australia, Queensland and Victoria, 2009–10 to 2018–19
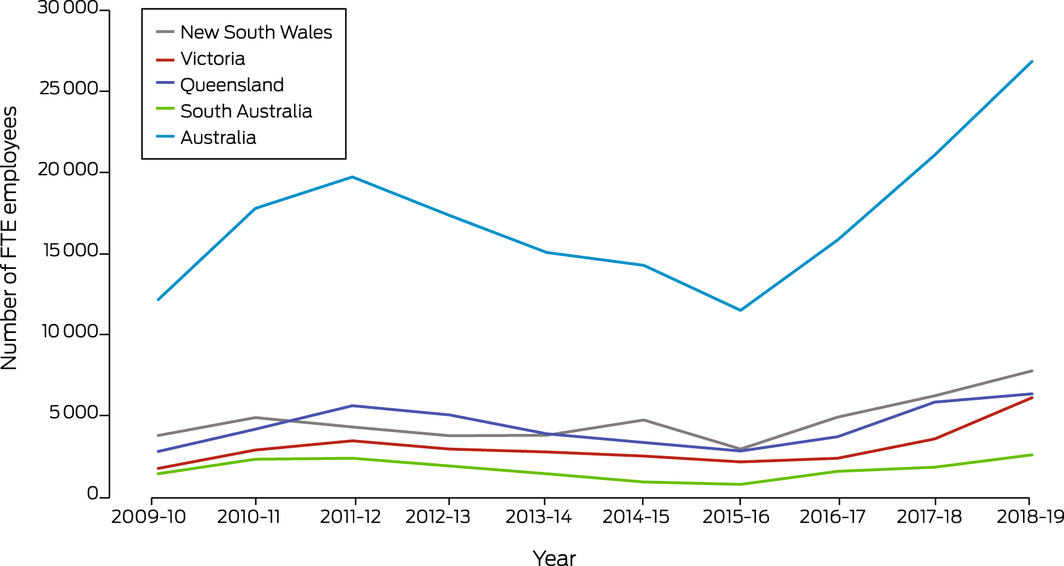
Source: Australian Bureau of Statistics.87
Box 20 – Annual number of media articles on health and climate change by covered regions in Australia, 2008–2021
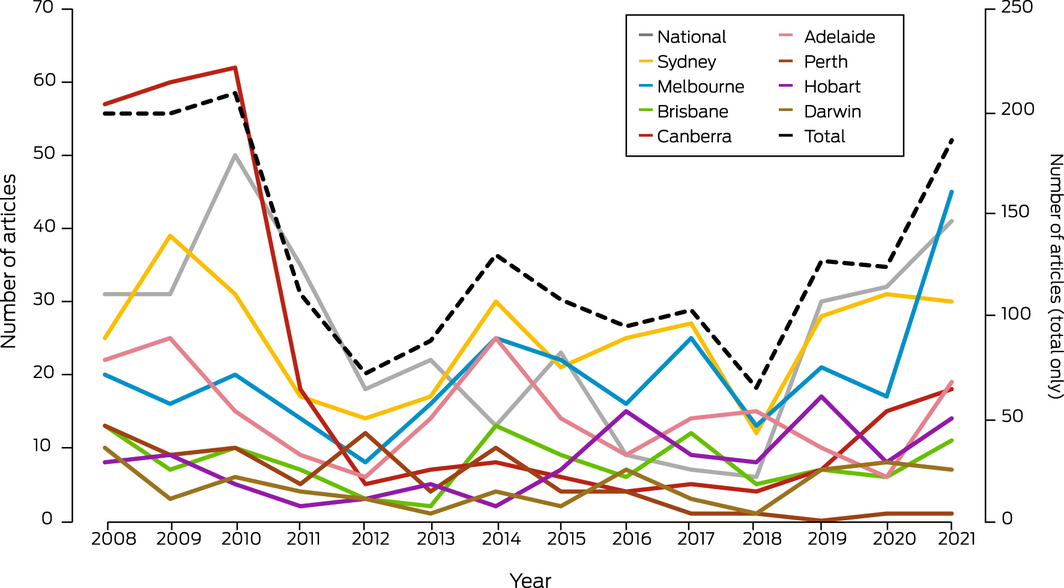
Data source: Factiva.
Box 21 – Number of scientific publications related to health and climate change in Australia, 2008–2021
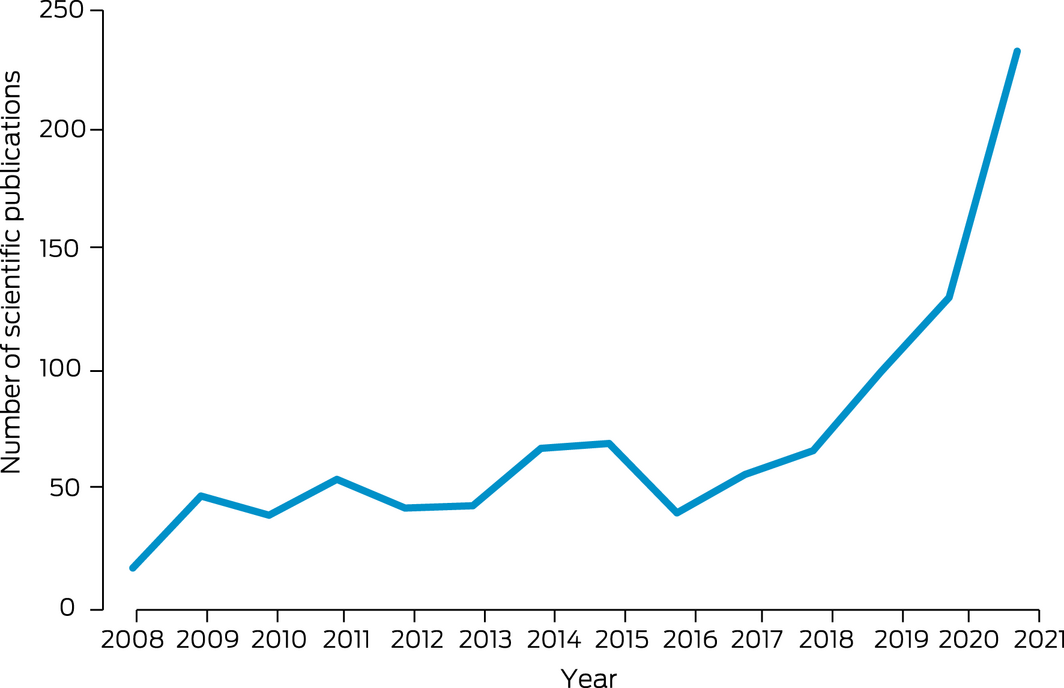
Data source: Scopus.
Box 22 – Funded and not‐funded National Health and Medical Research Council (NHMRC) grant applications with a focus on health and climate change, and success rate, 2000–2021
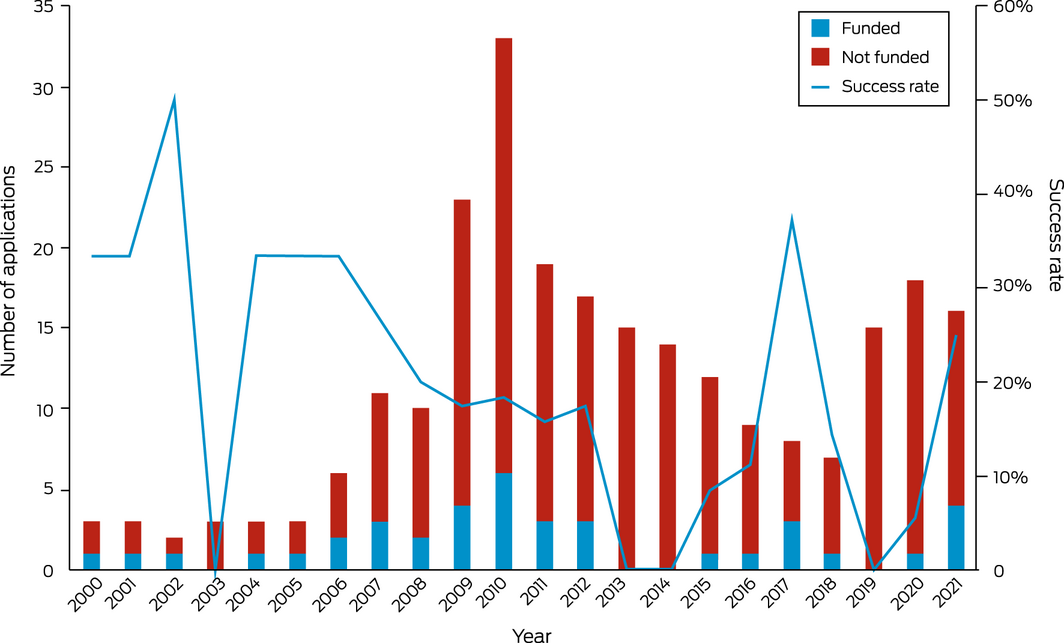
Data source: NHMRC.
Box 23 – Health and climate change in New Zealand: a Western Pacific case study
- New Zealand and Australia have many similarities, but there are also important differences that influence the effects of climate change and the necessary responses. Geography is central: New Zealand has a maritime climate, its islands are high and run south‐west to north‐east approximately at right angles to the prevailing westerly winds. Rainfall is plentiful in most regions; temperatures are moderate as the country lies far south of the tropics.
- As a result, New Zealand is warming less rapidly than Australia,54 and although health losses due to heat, fire and drought occur,96 these tend to be less severe than in Australia. For example, annual person‐days of exposure to wildfires increased from about 4000 to 6000 between the periods 2001–2004 and 2017–2020 (Lancet Countdown data explorer: https://www.lancetcountdown.org/data‐platform/). In the same period, the numbers in Australia, with a population five times greater, rose from 171 000 to 216 000.
- The major climate‐related health risks in New Zealand result from heavy rainfall and flooding.54 These include water‐borne illnesses: New Zealand has high rates of enteric infections by international standards, and the vulnerability of the country was illustrated in 2016, when about 8000 people contracted campylobacteriosis from contaminated drinking water supplied to the town of Havelock North. The cause was sheep faeces washed by very heavy rain into poorly protected bores.97 This outbreak was not an isolated event.98
- There are no human arboviruses circulating in New Zealand. Dengue fever is frequently introduced by people travelling from Pacific islands, but no local transmission has been reported. As climate change proceeds, local environments may become suitable for competent vectors such as Aedes aegypti that presently are not established in New Zealand.99
- New Zealand does not have a formally codified constitution, but the Treaty of Waitangi, signed by Māori and the British Crown in 1840, is regarded by many as the foundation document for the country. The Treaty gives weight to Indigenous perspectives on climate change risks and responses,100 and the inequitable effects on health for Māori represent, it is argued, a failure of the Crown to meet its Treaty obligations.101
- National greenhouse emissions have risen by about 26% since 1990 and show no sign of abating. Major points of contention are how to reduce emissions of methane and nitrous oxide from agriculture, which make up almost half of the country’s emissions overall, and how to transform land transport, which is presently one of the most car‐dependent anywhere. Decarbonising these two sectors could lead to substantial health co‐benefits.102,103
- New Zealand’s Zero Carbon Act sets out a pathway to zero net carbon emissions by 2050. An independent Climate Change Commission advises the government on short‐run carbon budgets leading up to 2050. The Act requires emission reductions, periodic climate change risk assessments (the first was published in 2020), and a national adaptation plan (not yet completed). A national health adaptation plan will be published in late 2022.
- The carbon footprint of the New Zealand health system (about 0.4 tonnes of CO2 per capita) is about half that of Australia.104 This is likely related to differences in power supply (80% of electricity comes from renewable sources in New Zealand) and procurement practices (Australia spends approximately twice as much as New Zealand per head on medicines105).
Provenance: Commissioned; externally peer reviewed.
- Paul J Beggs1
- Ying Zhang2
- Alice McGushin3
- Stefan Trueck1
- Martina K Linnenluecke1
- Hilary Bambrick4
- Anthony G Capon5
- Sotiris Vardoulakis4
- Donna Green6
- Arunima Malik2
- Ollie Jay2
- Maddie Heenan7
- Ivan C Hanigan8
- Sharon Friel9
- Mark Stevenson10
- Fay H Johnston11
- Celia McMichael12
- Fiona Charlson13
- Alistair J Woodward14
- Marina B Romanello15
- 1 Macquarie University, Sydney, NSW
- 2 University of Sydney, Sydney, NSW
- 3 University of Cambridge, Cambridge, UK
- 4 National Centre for Epidemiology and Population Health, Australian National University, Canberra, ACT
- 5 Monash Sustainable Development Institute, Monash University, Melbourne, VIC
- 6 Climate Change Research Centre and ARC Centre of Excellence for Climate Extremes, UNSW, Sydney, NSW
- 7 Australian Prevention Partnership Centre, Sax Institute, Sydney, NSW
- 8 Curtin University, Perth, WA
- 9 Australian National University, Canberra, ACT
- 10 Transport, Health and Urban Design (THUD) Research Lab, University of Melbourne, Melbourne, VIC
- 11 Menzies Institute for Medical Research, University of Tasmania, Hobart, TAS
- 12 University of Melbourne, Melbourne, VIC
- 13 Queensland Centre for Mental Health Research, University of Queensland, Brisbane, QLD
- 14 University of Auckland, Auckland, NZ
- 15 Institute for Global Health, University College London, London, UK
Open access
Open access publishing facilitated by Macquarie University, as part of the Wiley ‐ Macquarie University agreement via the Council of Australian University Librarians.
We thank Robert Fawcett, Justin Peter, Doerte Jakob and Elizabeth Ebert (all from the Australian Bureau of Meteorology) for contributing indicators 1.1 Exposure of vulnerable populations to heatwaves and 2.2 Climate information services for health. We thank Troy Cross (University of Sydney) for his assistance with the analysis for indicator 1.2 Heat impact on physical and sporting activities. The bushfires indicator (1.3) was generated with support from NASA Applied Sciences Program (grant no. 80NSSC21K0507), and we thank Yang Liu, Yun Hang and Liuhua Shi (all from Emory University) for the Australian data used for this indicator, and Nicolas Borchers‐Arriagada (University of Tasmania) for visualisation of the data. We thank the Lancet Countdown for providing the results for indicators 3.6 Emissions from agricultural production and consumption, 3.7 Diet and health co‐benefits, and 3.8 Mitigation in the health care sector. We thank Lucie Rychetnik (Sax Institute) for feedback and input on indicator 5.3 Government engagement in health and climate change. We thank the NHMRC for providing the data for indicator 5.4 Health and climate change research funding.
No relevant disclosures.
- 1. Australian Government Bureau of Meteorology. Special Climate Statement 75 – Australia’s wettest November on record. Melbourne: BOM, 2022. http://www.bom.gov.au/climate/current/statements/scs75.pdf?20220214 (viewed May 2022).
- 2. Norman B. The floods have killed at least 21 Australians. Adapting to a harsher climate is now a life‐or‐death matter. The Conversation 2022; 9 Mar. https://theconversation.com/the‐floods‐have‐killed‐at‐least‐21‐australians‐adapting‐to‐a‐harsher‐climate‐is‐now‐a‐life‐or‐death‐matter‐178761 (viewed May 2022).
- 3. Rice M, Hughes L, Steffen W, et al. A supercharged climate: rain bombs, flash flooding and destruction. Sydney: Climate Council, 2022. https://www.climatecouncil.org.au/wp‐content/uploads/2022/03/Final_Embargoed‐Copy_Flooding‐A‐Supercharged‐Climate_Climate‐Council_ILedit_220310.pdf (viewed May 2022).
- 4. Australian Government Department of Health and Aged Care. Japanese encephalitis virus (JEV). https://www.health.gov.au/health‐alerts/japanese‐encephalitis‐virus‐jev/about (viewed May 2022).
- 5. Costello A, Abbas M, Allen A, et al. Managing the health effects of climate change: Lancet and University College London Institute for Global Health Commission. Lancet 2009; 373: 1693‐1733.
- 6. Cissé G, McLeman R, Adams H, et al. Chapter 7: Health, wellbeing and the changing structure of communities. In: Pörtner H‐O, Roberts DC, Tignor MMB, et al, editors. Climate change 2022: Impacts, adaptation and vulnerability. Contribution of Working Group II to the Sixth Assessment Report of the Intergovernmental Panel on Climate Change. Cambridge University Press, 2022.
- 7. Australian Academy of Health and Medical Sciences. Climate change: an urgent health priority. Brisbane: AAHMS, 2022. https://aahms.org/wp‐content/uploads/2022/03/Health‐impacts‐of‐climate‐change.pdf (viewed May 2022).
- 8. Watts N, Adger WN, Agnolucci P, et al. Health and climate change: policy responses to protect public health. Lancet 2015; 386: 1861‐1914.
- 9. Lancet Countdown. Previous reports. https://www.lancetcountdown.org/previous‐reports/ (viewed May 2022).
- 10. Watts N, Amann M, Ayeb‐Karlsson S, et al. The Lancet Countdown on health and climate change: from 25 years of inaction to a global transformation for public health. Lancet 2018; 391: 581‐630.
- 11. Beggs PJ, Zhang Y, Bambrick H, et al. The 2019 report of the MJA‐Lancet Countdown on health and climate change: a turbulent year with mixed progress. Med J Aust 2019; 211: 490–491.e21. https://www.mja.com.au/journal/2019/211/11/2019‐report‐mja‐lancet‐countdown‐health‐and‐climate‐change‐turbulent‐year‐mixed
- 12. Beggs PJ, Zhang Y, McGushin A, et al. The 2021 report of the MJA–Lancet Countdown on health and climate change: Australia increasingly out on a limb. Med J Aust 2021; 215: 390‐392.e22. https://www.mja.com.au/journal/2021/215/9/2021‐report‐mja‐lancet‐countdown‐health‐and‐climate‐change‐australia
- 13. Zhang Y, Beggs PJ, Bambrick H, et al. The MJA‐Lancet Countdown on health and climate change: Australian policy inaction threatens lives. Med J Aust 2018; 209: 474.e1–474.e21. https://www.mja.com.au/journal/2018/209/11/mja‐lancet‐countdown‐health‐and‐climate‐change‐australian‐policy‐inaction
- 14. Zhang Y, Beggs PJ, McGushin A, et al. The 2020 special report of the MJA–Lancet Countdown on health and climate change: lessons learnt from Australia’s “Black Summer”. Med J Aust 2020; 213: 492‐492.e10. https://www.mja.com.au/journal/2020/213/11/2020‐special‐report‐mja‐lancet‐countdown‐health‐and‐climate‐change‐lessons
- 15. United Nations Framework Convention on Climate Change. The Paris Agreement. Bonn: UNFCCC, 2022. https://unfccc.int/process‐and‐meetings/the‐paris‐agreement/the‐paris‐agreement (viewed May 2022).
- 16. Romanello M, Di Napoli C, Drummond P, et al. The 2022 report of the Lancet Countdown on health and climate change: health at the mercy of fossil fuels. Lancet 2022; https://doi.org/10.1016/S0140-6736(22)01540-9.
- 17. Romanello M, McGushin A, Di Napoli C, et al. The 2021 report of the Lancet Countdown on health and climate change: code red for a healthy future. Lancet 2021; 398: 1619‐1662.
- 18. Matthews V, Atkinson A‐R, Lee G, et al. Climate change and Aboriginal and Torres Strait Islander health: discussion paper. Melbourne: Lowitja Institute, 2021. https://www.lowitja.org.au/page/services/resources/Cultural‐and‐social‐determinants/climate‐health/climate‐change‐and‐aboriginal‐and‐torres‐strait‐islander‐health (viewed May 2022).
- 19. Saxena S, Kline S. Countdown Global Mental Health 2030: data to drive action and accountability. Lancet Psychiatry 2021; 8: 941‐942.
- 20. Florido Ngu F, Kelman I, Chambers J, Ayeb‐Karlsson S. Correlating heatwaves and relative humidity with suicide (fatal intentional self‐harm). Sci Rep 2021; 11: 22175.
- 21. Ferrari AJ, Norman RE, Freedman G, et al. The burden attributable to mental and substance use disorders as risk factors for suicide: findings from the Global Burden of Disease Study 2010. PLoS One 2014; 9: e91936.
- 22. Charlson F, Ali S, Benmarhnia T, et al. Climate change and mental health: a scoping review. Int J Environ Res Public Health 2021; 18: 4486.
- 23. Yap M, Tuson M, Turlach B, et al. Modelling the relationship between rainfall and mental health using different spatial and temporal units. Int J Environ Res Public Health 2021; 18: 1312.
- 24. Yazd SD, Wheeler SA, Zuo A. Understanding the impacts of water scarcity and socio‐economic demographics on farmer mental health in the Murray‐Darling Basin. Ecol Econ 2020; 169: 106564.
- 25. Hanigan IC, Schirmer J, Niyonsenga T. Drought and distress in southeastern Australia. Ecohealth 2018; 15: 642‐655.
- 26. Jahan S, Wraith D. Immediate and delayed effects of climatic factors on hospital admissions for schizophrenia in Queensland Australia: a time series analysis. Environ Res 2021; 197: 111003.
- 27. Intergovernmental Panel on Climate Change. Regional fact sheet – Australasia. Sixth Assessment Report: Working Group I – The physical science basis. https://www.ipcc.ch/report/ar6/wg1/downloads/factsheets/IPCC_AR6_WGI_Regional_Fact_Sheet_Australasia.pdf (viewed May 2022).
- 28. Liu J, Varghese BM, Hansen A, et al. Is there an association between hot weather and poor mental health outcomes? A systematic review and meta‐analysis. Environ Int 2021; 153: 106533.
- 29. Cowlishaw S, Metcalf O, Varker T, et al. Anger dimensions and mental health following a disaster: distribution and implications after a major bushfire. J Trauma Stress 2021; 34: 46‐55.
- 30. Kessler RC, Andrews G, Colpe LJ, et al. Short screening scales to monitor population prevalences and trends in non‐specific psychological distress. Psychol Med 2002; 32: 959‐976.
- 31. Australian Bureau of Statistics. National Study of Mental Health and Wellbeing. Canberra: ABS, 2022. https://www.abs.gov.au/statistics/health/mental‐health/national‐survey‐mental‐health‐and‐wellbeing‐summary‐results (viewed May 2022).
- 32. Jorm AF, Bourchier SJ, Cvetkovski S, Stewart G. Mental health of Indigenous Australians: a review of findings from community surveys. Med J Aust 2012; 196: 118‐121. https://www.mja.com.au/journal/2012/196/2/mental‐health‐indigenous‐australians‐review‐findings‐community‐surveys
- 33. Massazza A, Teyton A, Charlson F, et al. Quantitative methods for climate change and mental health research: current trends and future directions. Lancet Planet Health 2022; 6: E613‐E627.
- 34. Campbell S, Remenyi TA, White CJ, Johnston FH. Heatwave and health impact research: a global review. Health Place 2018; 53: 210‐218.
- 35. Watson KE, Gardiner KM, Singleton JA. The impact of extreme heat events on hospital admissions to the Royal Hobart Hospital. J Public Health (Oxf) 2020; 42: 333‐339.
- 36. Nairn J, Fawcett R. Defining heatwaves: heatwave defined as a heat‐impact event servicing all community and business sectors in Australia [CAWCR Technical Report No. 060]. CSIRO and Australian Government Bureau of Meteorology, 2013. https://www.cawcr.gov.au/technical‐reports/CTR_060.pdf (viewed May 2022).
- 37. Nairn JR, Fawcett RJB. The excess heat factor: a metric for heatwave intensity and its use in classifying heatwave severity. Int J Environ Res Public Health 2015; 12: 227‐253.
- 38. Australian Government Department of Health Aged Care. About sport in Australia. https://www.health.gov.au/health‐topics/sport/about‐sport‐in‐australia (viewed May 2022).
- 39. Jay O, Broderick C, Smallcombe J. Extreme heat policy. Melbourne: Sports Medicine Australia, 2021. https://sma.org.au/sma‐site‐content/uploads/2021/02/SMA‐Extreme‐Heat‐Policy‐2021‐Final.pdf (viewed May 2022).
- 40. Australian Institute of Health and Welfare. Data update: Short‐term health impacts of the 2019–20 Australian bushfires (Cat. No: PHE 293). Canberra: AIHW, 2021. https://www.aihw.gov.au/reports/environment‐and‐health/data‐update‐health‐impacts‐2019‐20‐bushfires/contents/about (viewed May 2022).
- 41. Abram NJ, Henley BJ, Sen Gupta A, et al. Connections of climate change and variability to large and extreme forest fires in southeast Australia. Commun Earth Environ 2021; 2: 8.
- 42. Vitolo C, Di Giuseppe F, Barnard C, et al. ERA5‐based global meteorological wildfire danger maps. Sci Data 2020; 7: 216.
- 43. Williamson GJ, Prior LD, Jolly WM, et al. Measurement of inter‐ and intra‐annual variability of landscape fire activity at a continental scale: the Australian case. Environ Res Lett 2016; 11: 035003.
- 44. Canadell JG, Meyer CP, Cook GD, et al. Multi‐decadal increase of forest burned area in Australia is linked to climate change. Nat Commun 2021; 12: 6921.
- 45. Integrated Drought Management Programme. Standardized precipitation evapotranspiration index (SPEI). https://www.droughtmanagement.info/standardized‐precipitation‐evapotranspiration‐index‐spei/ (viewed May 2022).
- 46. McMartin DW, Sammel AJ, Arbuthnott K. Community response and engagement during extreme water events in Saskatchewan, Canada and Queensland, Australia. Environ Manag 2018; 61: 34‐45.
- 47. Raikes J, Smith TF, Baldwin C, Henstra D. Linking disaster risk reduction and human development. Clim Risk Manag 2021; 32: 100291.
- 48. Asbridge EF, Low Choy D, Mackey B, et al. Coastal flood risk within a peri‐urban area: Sussex Inlet district, SE Australia. Nat Hazards (Dordr) 2021; 109: 999‐1026.
- 49. Internal Displacement Monitoring Centre. Displacement, disaster and climate change. https://www.internal‐displacement.org/research‐areas/displacement‐in‐a‐changing‐climate (viewed April 2022).
- 50. World Bank. Population, total – Australia. https://data.worldbank.org/indicator/SP.POP.TOTL?end=2020&locations=AU&start=2008 (viewed May 2022).
- 51. Pörtner H‐O, Roberts DC, Adams H, et al. Summary for policymakers. In: Pörtner H‐O, Roberts DC, Tignor MMB, et al, editors. Climate change 2022: Impacts, adaptation and vulnerability. Contribution of Working Group II to the Sixth Assessment Report of the Intergovernmental Panel on Climate Change. Cambridge University Press, 2022.
- 52. Vardoulakis S, Matthews V, Bailie R, et al. Building resilience to Australian flood disasters in the face of climate change. Med J Aust 2022; 217: 342‐345.
- 53. Royal Commission into National Natural Disaster Arrangements. Report. Canberra: Commonwealth of Australia, 2020. https://naturaldisaster.royalcommission.gov.au/publications/royal‐commission‐national‐natural‐disaster‐arrangements‐report (viewed May 2022).
- 54. Lawrence J, Mackey B, Chiew F, et al. Chapter 11: Australasia. In: Pörtner H‐O, Roberts DC, Tignor MMB, et al, editors. Climate change 2022: Impacts, adaptation and vulnerability. Contribution of Working Group II to the Sixth Assessment Report of the Intergovernmental Panel on Climate Change. Cambridge University Press, 2022.
- 55. Victorian Government. Health and Human Services Climate Change Adaptation Action Plan 2022–2026. Melbourne: Department of Health and the Department of Families, Fairness and Housing, 2022. https://www.health.vic.gov.au/sites/default/files/2022‐02/health‐human‐services‐climate‐change‐adaptation‐action‐plan‐2022‐2026_0.pdf (viewed May 2022).
- 56. Commonwealth Scientific and Industrial Research Organisation. Climate change in the Northern Territory: state of the science and climate change impacts. Melbourne: CSIRO, 2020. https://depws.nt.gov.au/__data/assets/pdf_file/0011/944831/state‐of‐the‐science‐and‐climate‐change‐impacts‐final‐report.pdf (viewed May 2022).
- 57. World Health Organization. 2021 WHO Health and Climate Change Survey Report. Geneva: WHO, 2021. https://www.who.int/publications/i/item/9789240038509 (viewed May 2022).
- 58. Climate and Health Alliance. Healthy, regenerative and just: framework for a national strategy on climate, health and well‐being for Australia. Melbourne: CAHA, 2021. https://d3n8a8pro7vhmx.cloudfront.net/caha/pages/1947/attachments/original/1639623234/caha‐framework‐2.0‐FA.pdf?1639623234 (viewed May 2022).
- 59. Australian Government Department of Agriculture, Water and the Environment. National Climate Resilience and Adaptation Strategy 2021 to 2025: Positioning Australia to better anticipate, manage and adapt to our changing climate. Canberra: Department of Agriculture, Water and the Environment, 2021.
- 60. Bannister T, Ebert EE, Silver J, et al. A pilot forecasting system for epidemic thunderstorm asthma in southeastern Australia. Bull Am Meteorol Soc 2021; 102: E399‐E420.
- 61. World Health Organization. International Health Regulations (2005). 3rd ed. Geneva: WHO, 2016.
- 62. Wong MCS, Huang J, Wong SH, Yuen‐Chun Teoh J. The potential effectiveness of the WHO International Health Regulations capacity requirements on control of the COVID‐19 pandemic: a cross‐sectional study of 114 countries. J R Soc Med 2021; 114: 121‐131.
- 63. Le Quéré C, Peters GP, Friedlingstein P, et al. Fossil CO2 emissions in the post‐COVID‐19 era. Nat Clim Chang 2021; 11: 197‐199.
- 64. Global Monitoring Laboratory. Trends in atmospheric carbon dioxide: annual mean global carbon dioxide growth rates. Boulder, CO: National Oceanic and Atmospheric Administration, 2022. https://gml.noaa.gov/ccgg/trends/gl_gr.html (viewed July 2022).
- 65. International Energy Agency. IEA CO2 emissions from fuel combustion statistics: greenhouse gas emissions from energy. Indicators for CO2 emissions. Paris: IEA, 2022. https://www.oecd‐ilibrary.org/energy/data/iea‐co2‐emissions‐from‐fuel‐combustion‐statistics_co2‐data‐en (viewed May 2022).
- 66. Pigato M. Green or brown: the COVID‐19 crisis and the road to recovery. World Bank Blogs, 15 Nov 2021. https://blogs.worldbank.org/developmenttalk/green‐or‐brown‐covid‐19‐crisis‐and‐road‐recovery (viewed May 2022).
- 67. Hendryx M, Zullig KJ, Luo J. Impacts of coal use on health. Annu Rev Public Health 2020; 41: 397‐415.
- 68. International Energy Agency. Coal 2021: analysis and forecast to 2024. Paris: IEA, 2021. https://iea.blob.core.windows.net/assets/f1d724d4‐a753‐4336‐9f6e‐64679fa23bbf/Coal2021.pdf (viewed May 2022).
- 69. US Energy Information Administration. Country analysis executive summary: Australia. Washington, DC: EIA, 2022. https://www.eia.gov/international/content/analysis/countries_long/Australia/australia.pdf (viewed May 2022).
- 70. The Hon Angus Taylor MP. Australia’s plan to reach our net zero target by 2050. Joint media release with Prime Minister the Hon Scott Morrison MP. 26 Oct 2021. https://www.minister.industry.gov.au/ministers/taylor/media‐releases/australias‐plan‐reach‐our‐net‐zero‐target‐2050 (viewed July 2022).
- 71. Clean Energy Council. Clean energy Australia: report 2022. Melbourne: CEC, 2022. https://assets.cleanenergycouncil.org.au/documents/resources/reports/clean‐energy‐australia/clean‐energy‐australia‐report‐2022.pdf (viewed May 2022).
- 72. International Energy Agency. IEA world energy statistics and balances (database). https://www.oecd‐ilibrary.org/energy/data/iea‐world‐energy‐statistics‐and‐balances/extended‐world‐energy‐balances_data‐00513‐en (viewed May 2022).
- 73. Clean Energy Council. Clean energy Australia: report 2020. Melbourne: CEC, 2020. https://assets.cleanenergycouncil.org.au/documents/resources/reports/clean‐energy‐australia/clean‐energy‐australia‐report‐2020.pdf (viewed May 2022).
- 74. Australian Government: Department of Climate Change, Energy, the Environment and Water. Australian national greenhouse gas accounts. Paris Agreement inventory. https://ageis.climatechange.gov.au (viewed May 2022).
- 75. Electric Vehicle Council. EV sales boom presents chance to capture serious electric benefits, if government acts now. 31 Jan 2022. https://electricvehiclecouncil.com.au/ev‐sales‐boom‐presents‐chance‐to‐capture‐serious‐electric‐benefits‐if‐government‐acts‐now/ (viewed May 2022).
- 76. EV Central. Complete guide to rebates, discounts and incentives when buying an EV in Australia. 2 May 2022. https://evcentral.com.au/complete‐guide‐to‐discounts‐and‐incentives‐when‐buying‐an‐ev‐in‐australia/ (viewed May 2022).
- 77. Khara T, Riedy C, Ruby MB. The evolution of urban Australian meat‐eating practices. Front Sustain Food Syst 2021; 5: 624288.
- 78. Ridoutt B, Baird D, Hendrie GA. Diets within environmental limits: the climate impact of current and recommended Australian diets. Nutrients 2021; 13: 1122.
- 79. Dietzenbacher E, Los B, Stehrer R, et al. The construction of World Input‐Output Tables in the WIOD Project. Econ Syst Res 2013; 25: 71‐98.
- 80. World Health Organization. Global Health Expenditure Database. Current health expenditure by financing schemes. https://apps.who.int/nha/database/Select/Indicators/en (viewed May 2022).
- 81. Miller RE, Blair PD. Input‐output analysis: foundations and extensions. 2nd ed. Cambridge, UK: Cambridge University Press, 2009.
- 82. Lenzen M, Malik A, Li M, et al. The environmental footprint of health care: a global assessment. Lancet Planet Health 2020; 4: e271‐e279.
- 83. Insurance Council of Australia. Data Hub: Historical Catastrophe Data – July 2022. https://insurancecouncil.com.au/industry‐members/data‐hub/ (viewed Sept 2022).
- 84. Australian Energy Regulator. State of the energy market 2021. Melbourne: AER, 2021. https://www.aer.gov.au/publications/state‐of‐the‐energy‐market‐reports/state‐of‐the‐energy‐market‐2021 (viewed May 2022).
- 85. Australian Energy Market Operator. Generation information. https://aemo.com.au/energy‐systems/electricity/national‐electricity‐market‐nem/nem‐forecasting‐and‐planning/forecasting‐and‐planning‐data/generation‐information (viewed May 2022).
- 86. Australian Energy Market Operator. 2020 Integrated System Plan. Sydney: AEMO, 2020. https://aemo.com.au/‐/media/files/major‐publications/isp/2020/final‐2020‐integrated‐system‐plan.pdf?la=en (viewed May 2022).
- 87. Australian Bureau of Statistics. Employment in renewable energy activities, Australia: 2018‐19 financial year. Canberra: ABS, 2020. https://www.abs.gov.au/statistics/labour/employment‐and‐unemployment/employment‐renewable‐energy‐activities‐australia/latest‐release (viewed May 2022).
- 88. Australian Bureau of Statistics. Australian industry: 2019‐20 financial year. Canberra: ABS, 2021. https://www.abs.gov.au/statistics/industry/industry‐overview/australian‐industry/2019‐20 (viewed May 2022).
- 89. Global Fossil Fuel Divestment Commitments Database. https://divestmentdatabase.org/ (viewed May 2022).
- 90. Mehling MA, van Asselt H, Das K, et al. Designing border carbon adjustments for enhanced climate action. Am J Int Law 2019; 113: 433‐481.
- 91. Organisation for Economic Co‐operation and Development. OECD.Stat. Fossil fuel support ‐ AUS. https://stats.oecd.org/Index.aspx?DataSetCode=FFS_AUS (viewed May 2022).
- 92. World Bank. Carbon pricing dashboard. https://carbonpricingdashboard.worldbank.org/ (viewed May 2022).
- 93. Australian Government Clean Energy Regulator. Australian Carbon Exchange. http://cleanenergyregulator.gov.au/Infohub/Markets/australian‐carbon‐exchange (viewed May 2022).
- 94. Parliament of Australia. 18 National strategy on climate change, health and well‐being. Senate Journals, 16 March 2021; No. 94: 3286.
- 95. National Health and Medical Research Council. NHMRC Special Initiative in Human Health and Environmental Change. Canberra: NHMRC, 2021. https://www.nhmrc.gov.au/funding/find‐funding/nhmrc‐special‐initiative‐human‐health‐and‐environmental‐change (viewed May 2022).
- 96. Hales S, Salmond C, Town GI, et al. Daily mortality in relation to weather and air pollution in Christchurch, New Zealand. Aust N Z J Public Health 2000; 24: 89‐91.
- 97. Gilpin BJ, Walker T, Paine S, et al. A large scale waterborne Campylobacteriosis outbreak, Havelock North, New Zealand. J Infect 2020; 81: 390‐395.
- 98. Lai H, Hales S, Woodward A, et al. Effects of heavy rainfall on waterborne disease hospitalizations among young children in wet and dry areas of New Zealand. Environ Int 2020; 145: 106136.
- 99. Yu S. The possibility of a dengue outbreak occurring in New Zealand. Surveillance 2015; 42: 29‐31.
- 100. Iorns Magallanes CJ. Treaty of Waitangi duties relevant to adaptation to coastal hazards from sea‐level rise. Research Report for the Deep South National Science Challenge. Wellington: Deep South National Science Challenge, 2019. https://deepsouthchallenge.co.nz/wp‐content/uploads/2020/12/Treaty‐of‐Waitangi‐duties‐relevant‐to‐adaptation‐to‐coastal‐hazards‐from‐sea‐level‐rise.pdf (viewed May 2022).
- 101. Jones R, Bennett H, Keating G, Blaiklock A. Climate change and the right to health for Māori in Aotearoa/New Zealand. Health Human Rights J 2014; 16: 54‐68.
- 102. Drew J, Cleghorn C, Macmillan A, Mizdrak A. Healthy and climate‐friendly eating patterns in the New Zealand context. Environ Health Perspect 2020; 128: 017007.
- 103. Mizdrak A, Blakely T, Cleghorn CL, Cobiac LJ. Potential of active transport to improve health, reduce healthcare costs, and reduce greenhouse gas emissions: a modelling study. PLoS One 2019; 14: e0219316.
- 104. Pichler P‐P, Jaccard IS, Weisz U, Weisz H. International comparison of health care carbon footprints. Environ Res Lett 2019; 14: 064004.
- 105. Babar Z‐U‐D, Vitry A. Differences in Australian and New Zealand medicines funding policies. Aust Prescr 2014; 37: 150‐151.
- 106. Quilty S, Jupurrurla NF. Climate change: a Wumpurrarni‐kari and Papulanyi‐kari shared problem. J Paediatr Child Health 2021; 57: 1745‐1748.
Summary