




Volume 217 - Issue 11
Erratum
Med J Aust 2022; 217 (11): 589-590. || doi: 10.5694/mja2.51772
Published online: 12 December 2022
Published online: 12 December 2022
This erratum corrects the following:
Weise JC, Srasuebkul P, Trollor JN. Potentially preventable hospitalisations of people with intellectual disability in New South Wales. Med J Aust 2021; 215: 31‐36. https://doi.org/10.5694/mja2.51088
The authors have identified three minor errors in the code used to define potentially preventable hospitalisations for people with intellectual disability:
- For diabetes complications, the use of level 3 instead of level 4 ICD‐10 codes.
- For the non‐vaccine preventable pneumonia, a missing decimal point for the J15.7 code (J157 instead of J15.7).
- For gangrene, the use of a principal diagnosis code for the R02 instead of any diagnosis code.
The authors have re‐run their analysis and found minor changes to the rates and trends of potentially preventable hospitalisation for people with intellectual disability:
- Including diabetes complications has changed the overall rates of chronic disease; chronic disease admission rates are now higher for people with intellectual disability.
- A small increase in the number admissions related to non‐vaccine‐preventable pneumonia.
- No difference in the result for gangrene‐related admission, as the numbers remain too low to include in our results.
The new information, which does not change the overall findings and discussion, is reflected in the changes to the Abstract, the Results section, Boxes 1 to 3, and the Supporting Information described below.
In the Abstract, the Results paragraph should read:
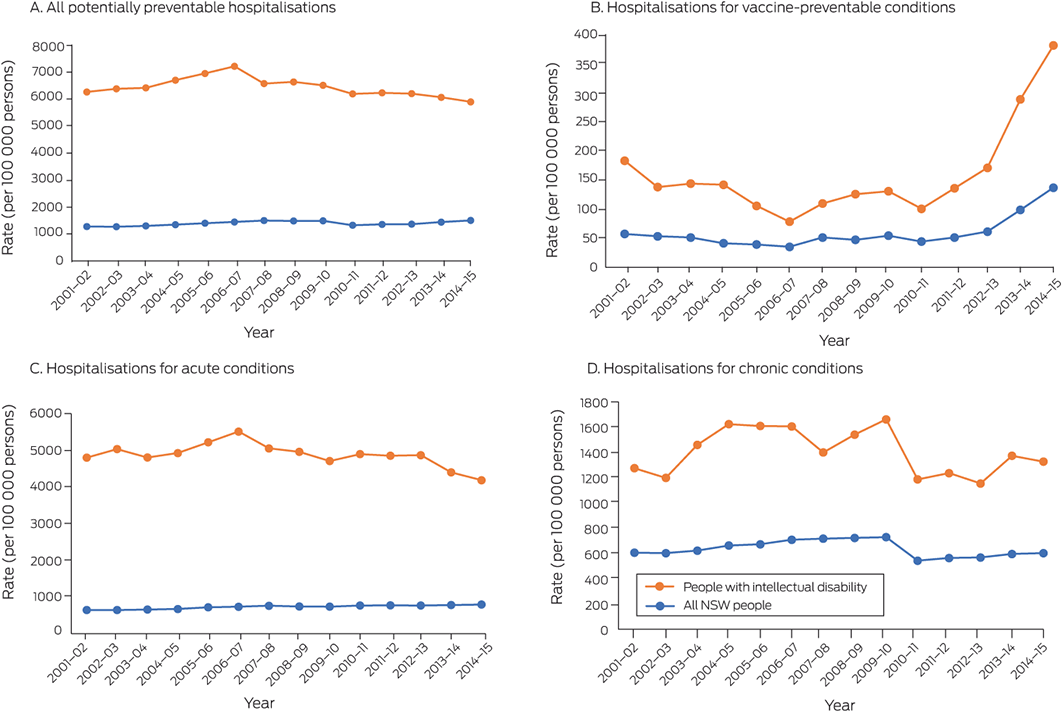
Results: The annual age‐standardised rate for people with intellectual disability ranged between 5889 and 7203 per 100 000 persons, and for the NSW population between 1278 and 1511 per 100 000 persons; the rate ratio (RR) ranged between 3.9 (95% CI, 3.7–4.1) in 2014–15 and 5.0 (95% CI, 4.6–5.4) in 2002–03. The difference was greatest for admissions with acute conditions (RR range: 5.4 [95% CI, 5.0–5.8] in 2014–15 to 8.1 [95% CI, 7.4–8.8] in 2002–03). By specific condition, the highest age‐standardised rate was for admissions with convulsions and epilepsy (all years, 2567 per 100 000 population; v NSW population: RR, 22.2; 95% CI, 21.3–23.1).
In the Results section, page 32, the first paragraph should read:
Between 2001–02 and 2014–15, the age‐standardised rate of potentially preventable hospitalisations of people with intellectual disability ranged between 5889 and 7203 per 100 000 persons; the age‐standardised rate for the NSW population ranged between 1278 and 1511 per 100 000 persons. RRs ranged between 3.9 (95% CI, 3.7–4.1) in 2014–15 and 5.0 (95% CI, 4.6–5.4) in 2002–03 (Box 1, Box 2, A; Supporting Information, table 2).
In the Results section, page 32, the second paragraph should read:
RRs for potentially preventable hospitalisations for vaccine‐preventable conditions ranged between 2.1 (95% CI, 1.6–3.0) in 2007–08 and 3.4 (95% CI, 2.2–5.2) in 2004–05 (Box 1, Box 2, B; Supporting Information, table 2). For acute conditions, RRs ranged between 5.4 (95% CI, 5.0–5.8) in 2014–15 and 8.1 (95% CI, 7.4–8.8) in 2002–03 (Box 1, Box 2, C; Supporting Information, table 2). For chronic conditions, RRs ranged between 2.0 (for several years) and 2.5 (95% CI, 2.1–2.8) in 2004–05 (Box 1, Box 2, D; Supporting Information, table 2).
In the Results section, pages 32 to 33, the final two paragraphs should read:
In each age group, the difference in rates of potentially avoidable hospitalisations for people with intellectual disability and for the general NSW population was greatest for convulsions or epilepsy (all ages: RR, 22.2; 95% CI, 21.3–23.1). The second greatest differences were for bronchiectasis for people aged 0–14years (RR, 10.0; 95% CI, 4.1–24.7), 15–24years (RR, 14.5; 95% CI, 5.2–40.5), or 25–44years (RR, 11.7; 95% CI, 4.6–29.7), diabetes complications for people aged 45–64years (RR, 6.5; 95% CI, 5.4–7.8), and pelvic inflammatory disease for people aged 65years or more (RR, 9.0; 95% CI, 1.2–65) (Box 3; Supporting Information, table 3).
In each age group, potentially avoidably hospitalisations of people with intellectual disability for asthma were less frequent than for the general NSW population (all ages: RR, 0.4; 95% CI, 0.4–0.4) (Box 3; Supporting Information, table 3).
Box 1 – Rate ratios (with 95% confidence intervals) for potentially preventable hospitalisations (per 100000 persons) of New South Wales people with intellectual disability and of all New South Wales people, by year*
|
|
|||||||||||||||
|
Year |
All conditions |
Vaccine‐preventable conditions |
Chronic conditions |
Acute conditions |
|||||||||||
|
2001–02 |
4.9 (4.5–5.3) |
3.2 (2.2–4.7) |
2.1 (1.8–2.5) |
7.7 (7.0–8.4) |
|||||||||||
|
2002–03 |
5.0 (4.6–5.4) |
2.6 (1.7–3.8) |
2.0 (1.7–2.3) |
8.1 (7.4–8.8) |
|||||||||||
|
2003–04 |
4.9 (4.6–5.3) |
2.8 (2.1–3.8) |
2.4 (2.0–2.7) |
7.5 (6.9–8.3) |
|||||||||||
|
2004–05 |
4.9 (4.6–5.3) |
3.4 (2.2–5.2) |
2.5 (2.1–2.8) |
7.5 (6.9–8.2) |
|||||||||||
|
2005–06 |
4.9 (4.6–5.3) |
2.7 (1.8–4.1) |
2.4 (2.1–2.8) |
7.5 (6.9–8.1) |
|||||||||||
|
2006–07 |
4.9 (4.6–5.3) |
2.2 (1.5–3.4) |
2.3 (2.0–2.6) |
7.7 (7.1–8.4) |
|||||||||||
|
2007–08 |
4.4 (4.1–4.6) |
2.1 (1.6–3.0) |
2.0 (1.7–2.2) |
6.8 (6.3–7.4) |
|||||||||||
|
2008–09 |
4.4 (4.2–4.7) |
2.6 (1.8–3.9) |
2.1 (1.9–2.4) |
6.9 (6.3–7.4) |
|||||||||||
|
2009–10 |
4.3 (4.1–4.6) |
2.4 (1.8–3.2) |
2.3 (2.0–2.6) |
6.6 (6.1–7.1) |
|||||||||||
|
2010–11 |
4.6 (4.4–5.0) |
2.3 (1.6–3.1) |
2.2 (1.9–2.5) |
6.5 (6.0–7.1) |
|||||||||||
|
2011–12 |
4.6 (4.3–4.9) |
2.7 (1.9–3.7) |
2.2 (1.9–2.5) |
6.4 (6.0–7.0) |
|||||||||||
|
2012–13 |
4.5 (4.2–4.8) |
2.8 (2.1–3.7) |
2.0 (1.8–2.3) |
6.5 (6.0–7.0) |
|||||||||||
|
2013–14 |
4.2 (3.9–4.4) |
2.9 (2.3–3.8) |
2.3 (2.1–2.6) |
5.8 (5.4–6.2) |
|||||||||||
|
2014–15 |
3.9 (3.7–4.1) |
2.8 (2.2–3.5) |
2.2 (2.0–2.5) |
5.4 (5.0–5.8) |
|||||||||||
|
|
|||||||||||||||
|
* All age‐adjusted rates of potentially preventable hospitalisations by category and year are available in the online Supporting Information, table 2. |
|||||||||||||||
Box 2 – Age‐adjusted rates of potentially preventable hospitalisations, New South Wales, 2001–02 to 2014–15
Box 3 – Rate ratios (with 95% confidence intervals) for potentially preventable hospitalisations (per 100000 persons) of New South Wales people with intellectual disability and of all New South Wales people, 2010–11 to 2014–15, by age and condition*
|
|
|||||||||||||||
|
Condition |
All ages |
0–14years |
15–24years |
25–44years |
45–64years |
65years or more |
|||||||||
|
Vaccine‐preventable |
|
|
|
|
|
|
|||||||||
|
Pneumonia and influenza |
2.9 (2.6–3.3) |
4.8 (3.9–6.0) |
3.9 (2.2–6.8) |
4.2 (2.8–6.4) |
3.3 (2.2–4.8) |
1.4 (0.9–2.1) |
|||||||||
|
Other |
2.6 (2.2–2.9) |
2.1 (1.7–2.7) |
1.7 (0.8–3.6) |
2.7 (1.9–3.8) |
2.7 (2.0–3.6) |
2.7 (1.5–5.0) |
|||||||||
|
Chronic conditions† |
|
|
|
|
|
|
|||||||||
|
Asthma |
0.4 (0.4–0.4) |
0.1 (0.1–0.1) |
0.3 (0.2–0.3) |
0.3 (0.2–0.4) |
0.4 (0.3–0.6) |
0.2 (0.2–0.4) |
|||||||||
|
Bronchiectasis |
2.6 (2.1–3.2) |
10.0 (4.1–24.7) |
14.5 (5.2–40.5) |
11.7 (4.6–29.7) |
1.9 (1.1–3.6) |
1.2 (0.7–2.1) |
|||||||||
|
Diabetes complications |
3.3 (3.1–3.5) |
1.6 (1.3–2.0) |
2.2 (1.8–2.8) |
8.3 (6.6–10.4) |
6.5 (5.4–7.8) |
3.2 (2.6–4.1) |
|||||||||
|
Chronic obstructive pulmonary disease |
2.2 (2.1–2.4) |
3.0 (1.2–7.5) |
5.1 (1.3–20.9) |
5.3 (3.0–9.2) |
2.9 (2.4–3.4) |
2.0 (1.8–2.3) |
|||||||||
|
Iron deficiency anaemia |
1.8 (1.6–1.9) |
3.3 (1.8–6.1) |
1.3 (0.9–1.9) |
1.9 (1.5–2.4) |
1.8 (1.5–2.2) |
1.2 (1.0–1.5) |
|||||||||
|
Rheumatic heart diseases |
1.2 (0.8–1.6) |
2.1 (0.7–6.6) |
1.7 (0.3–9.8) |
1.6 (0.4–6.6) |
0.8 (0.3–1.9) |
0 |
|||||||||
|
Acute conditions‡ |
|
|
|
|
|
|
|||||||||
|
Convulsions and epilepsy |
22.2 (21.3–23.1) |
14.8 (13.7–16.0) |
22.6 (19.4–26.3) |
25.7 (22.2–29.7) |
25.4 (21.6–29.9) |
11.9 (8.8–16.3) |
|||||||||
|
Dental conditions |
5.6 (5.4–5.9) |
3.1 (2.9–3.3) |
7.2 (6.3–8.4) |
11.1 (9.7–12.8) |
6.4 (5.4–7.5) |
2.3 (1.6–3.2) |
|||||||||
|
Ear, nose, throat infections |
2.8 (2.7–2.9) |
2.5 (2.3–2.7) |
1.5 (1.3–1.9) |
2.4 (1.9–3.1) |
3.6 (2.5–5.3) |
2.2 (1.3–3.7) |
|||||||||
|
Pelvic inflammatory disease |
0.8 (0.7–0.9) |
1.2 (0.1–10.7) |
0.6 (0.4–1.0) |
0.8 (0.5–1.1) |
0.2 (0.1–0.4) |
9.0 (1.2–64.7) |
|||||||||
|
Perforated/bleeding ulcer |
1.8 (1.5–2.3) |
2.7 (0.1–58.8) |
1.6 (0.5–5.4) |
1.6 (0.8–3.2) |
2.7 (1.6–4.5) |
1.4 (0.9–2.4) |
|||||||||
|
Pneumonia (not vaccine‐preventable) |
2.7 (2.1–3.4) |
2.0 (1.4–2.9) |
2.8 (0.9–8.4) |
4.9 (1.7–14.6) |
3.5 (1.1–11.1) |
2.1 (0.6–7.5) |
|||||||||
|
Urinary tract infections |
3.4 (3.2–3.6) |
2.4 (2.1–2.7) |
2.2 (1.8–2.6) |
4.1 (3.4–5.0) |
5.3 (4.5–6.4) |
2.6 (2.3–3.0) |
|||||||||
|
|
|||||||||||||||
|
* All age‐adjusted rates of potentially preventable hospitalisations by category and year are available in the online Supporting Information, table 3. † Data for nutritional deficiencies not included because of small case numbers. ‡ Data for eclampsia and gangrene not included because of small case numbers. The category "Convulsions and epilepsy" is included under acute conditions in the National Healthcare Agreement list of potentially preventable hospitalisations.12 |
|||||||||||||||