




Volume 206 - Issue 7
Factors affecting general practitioner charges and Medicare bulk-billing: results of a survey of Australians — erratum
Authors: Richard De Abreu Lourenco, Patricia Kenny, Marion R Haas and Jane P Hall
Med J Aust 2017; 206 (7): 326. || doi: 10.5694/mja16.01349
Published online: 17 April 2017
Published online: 17 April 2017
To the Editor:
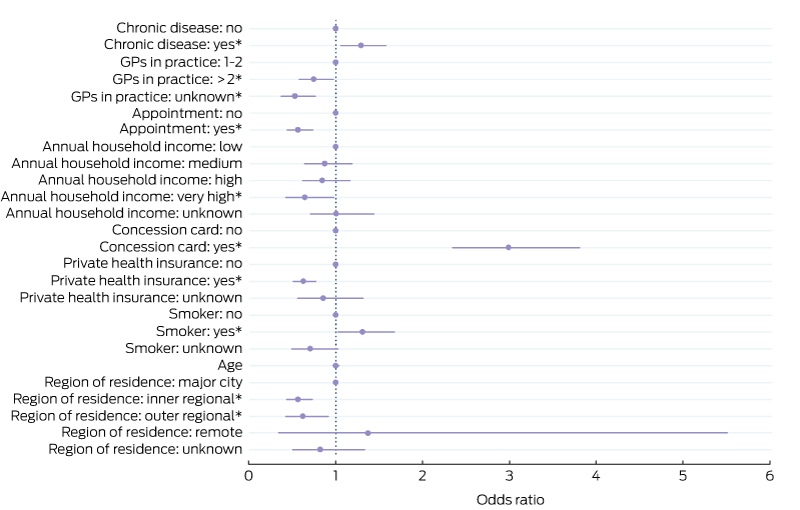
In our study,1 we engaged the services of a third party online panel to recruit survey participants. Pre-existing information on private health insurance status, smoking status and exercise participation for those completing the survey was provided by the third party, who has now confirmed that the data initially labelled as “private health insurance” were actually “smoking” status. All other demographic information used in our analysis was collected directly from participants completing the online survey.
We initially reported a positive association between private health insurance and being bulk-billed (odds ratio [OR], 1.39; 95% confidence interval [CI], 1.09–1.78). However, the discovery of this labelling error better explains the positive association we initially reported for those data; it is smokers who are more likely to be bulk-billed than non-smokers, not those with private health insurance being more likely to be bulk-billed than those without private health insurance. Retaining these data on smoking status in our model, and adding in the correct data for private health insurance status, we observe that those with private health insurance are less likely to be bulk-billed than those without it (OR, 0.63; 95% CI, 0.51–0.77). The remaining relationships between individuals’ characteristics and the likelihood of being bulked-billed are unchanged from those reported previously. The results from the updated multivariate logistic regression analysis are provided in the Box.
Box – Odds ratios for factors associated with bulk billing (n = 2467)
Multivariate regression statistic Wald χ2 = 234.63 (P = < 0.001). Bars represent 95% confidence intervals (CIs). For each category, except age, the base factor appears without a 95% CI and straddles the line at 1. The number of respondents included was reduced by ten due to six missing observations for age and four missing observations for concession card status. * P = < 0.05 compared with the base factor.
Competing interests
No relevant disclosures.
References
- De Abreu Lourenco, Kenny, Haas, Hall. Factors affecting general practitioner charges and Medicare bulk-billing: results of a survey of Australians. Med J Aust 2015; 202: 87-90.
Medical Colleges Have an Obligation to Ensure Full Participation in Clinical Quality Registries
Thomas J. Hugh
Getting on the Same Page: Why Australia Needs a National Maternity Early Warning System (MEWS) Chart
Briony A. Cutts, Lucy Bowyer, Nisha Khot, Sandra Lowe, Stefan C. Kane
Data for Equity: Can Linked Administrative Data Inform Pathways to More Equitable Child Health?
Sarah Gray, Shuaijun Guo, Meredith O'Connor, Elodie O'Connor, Katrina Williams, Hannah Badland, Susan Woolfenden, Josie Dickerson, Gerry Redmond, Marnie Downes, Sharon R. Goldfeld
Specialty College Selection: Why Change is Critical to Support a Future Rural Workforce
Matthew R. McGrail, Jenny May AM, Katherine Logan
Differentiated and simplified oral HIV pre‐exposure prophylaxis (PrEP) models hold the key to virtually eliminating HIV transmission in Australia by 2030
Tyson Arapali, Sarah Warzywoda, Anthony K J Smith, Curtis Chan, Timothy R Broady, Erin Sullivan, Catherine MacPhail, Mohamed A Hammoud, Alexander Dowell‐Day, Benjamin R Bavinton
The number of cancer‐related deaths that could be attributable to spatial disparities in survival in Australia, 2010–2019: a retrospective population‐based cohort study
Charlotte K Bainomugisa, Jessica Cameron, Paramita Dasgupta, Peter Baade