


Five new medical schools have opened since 2000, and the number of Australian medical graduates is set to increase by 60% in the next few years, from 1300 in 2005 to more than 2100 after 2010.1 Furthermore, international students completing their medical training in Australia are increasingly likely to enter the Australian medical workforce, facilitated by changes in visa conditions.2,3
Other factors are reducing the supply of “effective full-time practitioners”. For example, medical practitioners’ working hours fell from 48.3 hours per week in 1995 to 44.4 by 2003 (Australian Institute of Health and Welfare, Medical labour force 1995–2001, custom data, June 2004).4 Although this is partly driven by the feminisation of the medical workforce, working hours declined more for male doctors (by 7.4%) than for female doctors (6.4%). Few data are available about retirement rates, but the approach of retirement age for the “baby boomer” generation of doctors is another likely downward pressure on medical workforce supply.5 Additionally, increasing opportunities, and requirements, for medical practitioners to carry out non-clinical activities, such as management, administration, research, continuing education, and supervision, reduce the effective supply for direct provision of clinical services.6 The general practice (GP) workforce has been a particular concern, with perceived shortages that seem set to continue unless steps are taken to address this issue.7
Accurate projections of workforce supply are essential for effective planning, but the approaches used in Australia are limited. Current projections provided by the Australian Medical Workforce Advisory Committee (AMWAC) are generally limited to particular sectors or specialties within medicine. There has been no review of the medical workforce as a whole since 1996.8
A limitation of current Australian approaches to projecting workforce supply is the use of deterministic methods, which produce single-point estimates. These methods do not reflect the uncertainties inherent in projection modelling, and in the medical workforce supply system itself. Stochastic models, which use random numbers and probability distributions, produce results expressed as a probability distribution or range, which can be analysed statistically. Simulation has been identified as a preferred approach for health workforce modelling.9
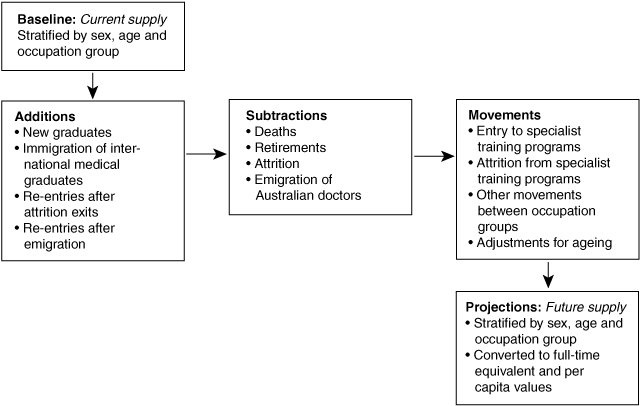
Our model was based on the “stocks and flows” approach. Our baseline year was 2001, and projections were made through to 2012. To generate projections, new graduations, immigrants and re-entrants to the workforce were added, and deaths, retirements and attrition exits subtracted for each year (Box 1). Adjustments were made for movement between occupations within the medical workforce, and for ageing, to estimate the number of doctors in subsequent years.
The model uses data from a wide range of sources which have not previously been drawn together for this type of analysis (Box 2). Key assumptions are summarised in Box 3. The main outcome measure was the number of full-time equivalent (FTE) doctors (per 100 000 persons) in broad occupational groups such as general practitioners, specialists, and clinicians overall.
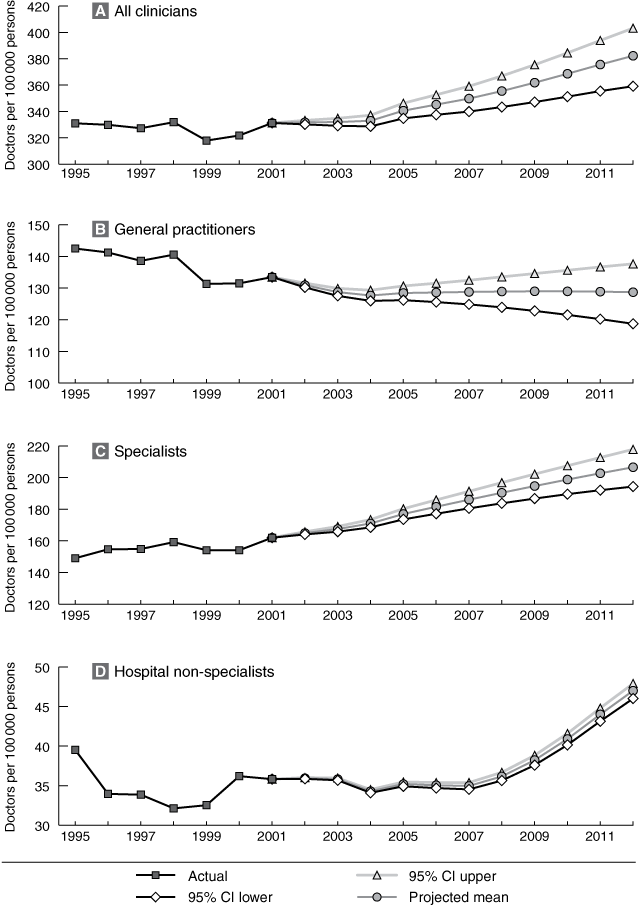
The total clinical workforce was about 330 FTE clinicians per 100 000 persons between 1995 and 2001, and was projected to reach 382 (95% CI, 359–403) per 100 000 persons in 2012 (Box 4). Most of this growth was projected to occur after 2004, with levels between 2001 and 2004 continuing recent past trends. For the GP workforce, past trends show a decline in the number of FTE general practitioners per 100 000 persons, from more than 140 in 1995 to 133 in 2001. This was projected to fall to about 129 per 100 000 persons by 2003 and remain at this level for the projection period (Box 4).
The specialist workforce was projected to rise from 162 FTE specialists per 100 000 persons in 2001 to 206 (95% CI, 194–218) per 100 000 persons in 2012, continuing the past pattern of growth (Box 4). The hospital non-specialist workforce showed some volatility from 1995 to 2001, varying from 32 to 40 FTE doctors per 100 000 persons. This workforce was projected to show little growth until 2007, and then rise to reach 47 (95% CI, 46–48) per 100 000 persons by 2012 (Box 4). The lack of growth before 2007 is largely attributable to increases in the number of vocational training positions, coupled with an absence of growth in the number of new graduates during this period.
The first series of alternative scenarios explored the effect of a changed pattern of intake of IMGs. None of the alternative scenarios differed significantly from the base case, with mean values of all three alternative scenarios falling within the confidence intervals of the base case scenario (Box 5). This was also the case for the high retirement rate scenario. In contrast, a low retirement rate was projected to result in a significantly larger FTE clinical workforce by 2012, and with decreasing working hours the workforce was projected to be significantly smaller (with projected means for both these scenarios outside the confidence intervals of the base case projections: see Box 5).
Neither a 10% decrease nor a 25% increase in GP training positions was likely to produce a significant difference from the base case projection of total GP workforce to 2012 (Box 5). However, a 25% increase in GP training positions would reduce the hospital non-specialist workforce. Under this scenario, the number of hospital non-specialists per 100 000 persons was projected to fall to 31.3 by 2007 and to be 38.3 by the end of the projection period. This is significantly lower than the number of hospital non-specialists projected under the base case scenario (47.0 per 100 000 persons).
The FTE GP workforce in 2004 was projected to be at its lowest level since 1995. The study indicates that a 25% increase in training intakes from 2005, even if it were possible, would only return the FTE GP workforce per capita to its 2001 level by 2012. The results suggest an entrenched, long-term shortage in this workforce. This is consistent with previous conclusions.7,12,19-21 For example, the recently completed AMWAC review concluded that future supply of the GP workforce would be unlikely to meet demand without significant additional entrants to the primary medical care workforce, in the order of an additional 400–500 per year.7
Persistent chronic GP shortages imply the need for some lateral thinking on how to ensure that Australia’s need for primary medical care can be met. Possible policy alternatives to supply enhancement, which should be the subject of further debate, include task substitution, demand management (including increased self-management) and remuneration changes.20-24
Retirement rates were identified as a key determinant of supply. Lower retirement rates, with more doctors staying in the workforce longer, would result in a significantly larger workforce, particularly in the short term. Retirement rates are especially important when a large proportion of the workforce is older, and so the relative contribution of these cohorts to total effective workforce supply is higher. In the latest national data, a quarter of the medical labour force were older than 55 years.4 With the ageing of the Australian medical workforce, retirement rates will remain an important determinant of total medical workforce supply.5 Further research to generate more accurate information about retirement trends, and identify potential policy levers to influence retirement intentions, would be useful for medical workforce planning.
The validity of our modelling may be investigated by comparing its projections with the actual workforce numbers in the early part of the projection period (ie, 2002 and 2003). Since the completion of our analysis, the annual national medical labour force surveys for these years have been published. For 2002, there is close similarity between the predictions of our model and the actual data (for example, a projected total medical workforce of 53 782 compared with an actual workforce of 53 991).25 For 2003, the projections were slightly lower than the actual workforce numbers (projected total, 54 294; actual total, 56 207).4 This suggests that the model may be a conservative estimate of growth, and any potential shortages may be less than we predict.
As with any modelling exercise, the projections depend on the parameter estimates used. For example, the retirement rates we used, which were based on AWMAC estimates,14 may have been too high. Our projected workforce for 2003 had 5.7% of doctors aged 65 years and older. In the actual data, doctors in this age group made up 8.5% of the workforce.4 This reinforces the need for better data about this important determinant of workforce numbers.
2 Data sources for the simulation model
3 Key assumptions of the base simulation model
Received 12 February 2006, accepted 15 March 2006
- Catherine M Joyce1
- John J McNeil2
- Johannes U Stoelwinder3
- Department of Epidemiology and Preventive Medicine, Monash University, Melbourne, VIC.
This research was supported by a National Health and Medical Research Council Primary Health Care Postgraduate Research Scholarship to Catherine Joyce, and a Project Grant from the Australian Government Department of Health and Ageing. Thanks to Odette Vogt and Glenice Taylor of the Australian Institute of Health and Welfare for their assistance and advice on medical labour force survey data, and to Deborah Schofield for comments on a draft of this article.
None identified.
- 1. Lennon B. Medical workforce expansion in Australia — commitment and capacity. Paper presented at the Ninth International Medical Workforce Collaborative Conference; 2005 Nov 16–19; Melbourne. Sydney: AMWAC. Available at: http://www.health.nsw.gov.au/amwac/amwac/9conf.html (accessed Nov 2005).
- 2. Patterson K, Ruddock P. New measure increases medical workforce. Media release. 19 March 2003. Available at: http://www.health.gov.au/internet/wcms/Publishing.nsf/Content/health-mediarel-yr2003-kp-kp03029.htm (accessed Nov 2005).
- 3. Birrell B, Hawthorne L. Medicare Plus and overseas-trained medical doctors. People Place 2004; 12: 84-100.
- 4. Australian Institute of Health and Welfare. Medical labour force 2003. Canberra: AIHW, 2005. (AIHW Catalogue No. HWL 32.) Available at: http://www.aihw.gov.au/publications/index.cfm/title/10153 (accessed Nov 2005).
- 5. Schofield DJ, Beard JR. Baby boomer doctors and nurses: demographic change and transitions to retirement. Med J Aust 2005; 183: 80-83. <MJA full text>
- 6. Joyce CM, McNeil JJ, Stoelwinder JU. Time for a new approach to medical workforce planning. Med J Aust 2004; 180: 343-346. <MJA full text>
- 7. Australian Medical Workforce Advisory Committee. The general practice workforce in Australia: supply and requirements to 2013. Sydney: AMWAC, 2005. (AMWAC Report 2005.2.) Available at: http://www.health.nsw.gov.au/amwac/reports.html (accessed Mar 2006).
- 8. Australian Medical Workforce Advisory Committee, Australian Institute of Health and Welfare. Australian medical workforce benchmarks. Sydney: AMWAC, 1996. (AMWAC Report 1996.1.) Available at: http://www.health.nsw.gov.au/amwac/reports.html (accessed Mar 2006).
- 9. O’Brien-Pallas L, Baumann A, Donner G, et al. Forecasting models for human resources in health care. J Adv Nurs 2001; 33: 120-129.
- 10. Australian Institute of Health and Welfare. Medical labour force 2001. Canberra: AIHW, 2003. (AIHW Catalogue No. HWL 28.) Available at: http://www.aihw.gov.au/publications/index.cfm/title/9529 (accessed Nov 2005).
- 11. Australian Medical Workforce Advisory Committee. Temporary resident doctors in Australia: distribution, characteristics and role. Sydney: AMWAC, 1999. (AMWAC Report 1999.3.) Available at: http://www.health.nsw.gov.au/amwac/reports.html (accessed Mar 2006).
- 12. Hawthorne L, Birrell B. Doctor shortages and their impact on the quality of medical care in Australia. People Place 2002; 10: 55-67.
- 13. Joyce C, McNeil JJ. Participation in the workforce by Australian medical graduates. Med Educ 2006; 40: 333-339.
- 14. Australian Medical Workforce Advisory Committee. Specialist medical workforce planning in Australia. A guide to the planning process used by the Australian Medical Workforce Advisory Committee. Sydney: AMWAC, 2003. (AMWAC Report 2003.1.) Available at: http://www.health.nsw.gov.au/amwac/reports.html (accessed Mar 2006).
- 15. Australian Bureau of Statistics. Deaths, Australia, 2002. Canberra: ABS, 2002. (ABS Catalogue No. 3302.0.)
- 16. Australian Medical Workforce Advisory Committee. The general practice workforce in Australia: supply and requirements 1999–2010. Sydney: AMWAC, 2000. (AMWAC Report 2000.2.) Available at: http://www.health.nsw.gov.au/amwac/reports.html (accessed Mar 2006).
- 17. Medical Training Review Panel. Seventh Report. Canberra: Commonwealth Department of Health and Ageing, 2003. Available at: http://www.health.gov.au/internet/wcms/Publishing.nsf/Content/health-workforce-education-mtrp7thr.htm (accessed Mar 2006).
- 18. Australian Bureau of Statistics. Population projections, Australia, 2002–2101. Canberra: ABS, 2003. (ABS Catalogue No. 3222.0.)
- 19. O’Dea JF, Kilham RJ. The inverse care law is alive and well in general practice [editorial]. Med J Aust 2002; 177: 78-79. http://www.mja.com.au/public/issues/177_02_150702/ode10352_fm.html
- 20. Access Economics. Primary health care for all Australians: an analysis of the widening gap between community need and the availability of GP services. A report to the Australian Medical Association. Canberra: Access Economics, 2002.
- 21. Brooks PM, Lapsley HM, Butt DB. Medical workforce issues in Australia: “tomorrow’s doctors — too few, too far”. Med J Aust 2003; 179: 206-208. <MJA full text>
- 22. Australian Medical Association. General practice key health strategy proposal: increasing the Australian general practice workforce. Canberra: AMA, 2002. Available at: http://www.ama.com.au/web.nsf/doc/WEEN-5GH3UL (accessed Nov 2005).
- 23. Brooks PM. The impact of chronic illness: partnerships with other healthcare professionals. Med J Aust 2003; 179: 260-262. <MJA full text>
- 24. Turner VF, Bentley PJ, Hodgson SA, et al. Telephone triage in Western Australia. Med J Aust 2002; 176: 100-103. <MJA full text>
- 25. Australian Institute of Health and Welfare. Medical labour force 2002. Canberra: AIHW, 2004. (AIHW Catalogue No. HWL 30.) Available at: http://www.aihw.gov.au/publications/index.cfm/title/10071 (accessed Nov 2005).
Abstract
Objective: To project the future size of the Australian medical workforce, from 2001 to 2012.
Design and setting: Stochastic simulation modelling of the Australian medical workforce, taking into account recent increases in medical school capacity and trends in the intake of foreign graduates.
Main outcome measures: Number of full-time equivalent (FTE) medical practitioners per 100 000 persons within various occupation groups from 2001 (baseline) to 2012.
Results: The total medical workforce was projected to rise from 53 384 in 2001 to 67 659 by 2012 (95% CI, 63 924–71 036). On a per capita basis, the number of FTE clinicians was projected to rise from 331 per 100 000 persons in 2001 to 382 (95% CI, 359–403) per 100 000 persons in 2012. The general practice workforce was projected to fall from 133 FTE general practitioners per 100 000 persons in 2001, to 129 per 100 000 persons in 2003, and then remain at around this level through to 2012. The specialist workforce was projected to show steady growth, rising from 162 FTE specialists per 100 000 persons in 2001 to 206 (95% CI, 194–218) per 100 000 persons in 2012.
Conclusions: The general practice workforce is likely to face continued chronic shortages, necessitating innovative policy responses to ensure that the community’s need for primary medical care is met. Retirement rates are a key determinant of workforce supply, suggesting a need to encourage general practitioners to remain active as long as they remain effective. Further refinement of stochastic models will help facilitate a more proactive approach to workforce planning.