




Volume 218 - Issue 5
The cost‐effectiveness of coronary calcium score‐guided statin therapy initiation for Australians with family histories of premature coronary artery disease
Authors: Prasanna Venkataraman, Amanda L Neil, Geoffrey K Mitchell, Tony Stanton, Stephen Nicholls, Andrew M Tonkin, Gerald F Watts and Thomas H Marwick
Med J Aust 2023; 218 (5): 216-222. || doi: 10.5694/mja2.51860
Published online: 20 March 2023
Published online: 20 March 2023
Expanding eligibility for statin therapy should selectively target people with subclinical atherosclerosis rather than simply lowering treatment thresholds
Abstract
Objectives: To compare the cost‐effectiveness of coronary artery calcium (CAC) score‐guided statin therapy criteria and American College of Cardiology/American Heart Association (ACC/AHA) guidelines (10‐year pooled cohort equation [PCE] risk ≥7.5%) with selection according to Australian guidelines (5‐year absolute cardiovascular disease risk [ACVDR]≥10%), for people with family histories of premature coronary artery disease.
Study design, setting: Markov microsimulation state transition model based on data from the Coronary Artery calcium score: Use to Guide management of Hereditary Coronary Artery Disease (CAUGHT‐CAD) trial and transition probabilities derived from published statin prescribing and adherence outcomes and clinical data.
Participants: 1083 people with family histories of premature coronary artery disease but no symptomatic cardiovascular disease.
Main outcome measures: Relative cost‐effectiveness over fifteen years, from the perspective of the Australian health care system, compared with usual care (Australian guidelines), assessed as incremental cost‐effectiveness ratios (ICERs), with a notional willingness‐to‐pay threshold of $50000 per quality‐adjusted life‐year (QALY) gained.
Results: Applying the Australian guidelines, 77 people were eligible for statin therapy (7.1%); with ACVDR 5‐year risk ≥2% and CAC score>0, 496 people (46%); with ACVDR 5‐year risk ≥2% and CAC score≥100, 155 people (14%); and with the ACC/AHA guidelines, 256 people (24%). The ICERs for CAC‐guided selection were $33108 (CAC ≥100) and $53028 per QALY gained (CAC>0); the ACC/AHA guidelines approach (ICER, $909241 per QALY gained) was not cost‐effective. CAC score‐guided selection (CAC ≥100) was cost‐effective for people with 5‐year ACVDR of at least 5%.
Conclusion: Expanding the number of people at low to intermediate CVD risk eligible for statin therapy should selectively target people with subclinical atherosclerosis identified by CAC screening. This approach can be more cost‐effective than simply lowering treatment eligibility thresholds.
The known: Statin treatment thresholds in Australian cardiovascular disease (CVD) prevention guidelines are more restrictive than overseas. Coronary artery calcium (CAC) scoring can be effective for reclassifying people at low to intermediate CVD risk.
The new: Systematic CAC screening of people with baseline 5‐year CVD risk of 5% or more is cost‐effective when a CAC score of 100 is the threshold for statin therapy, and for people with CVD risk of 8% when a non‐zero CAC score is the criterion.
The implications: CVD prevention guidelines for people at low to intermediate CVD risk should be revised to include CAC scoring in assessment for statin treatment eligibility.
The 2012 Australian National Vascular Disease Prevention Alliance cardiovascular disease primary prevention guidelines1 differ markedly from overseas guidelines in several respects. The American College of Cardiology/American Heart Association (ACC/AHA) guidelines2 assess risk with the pooled cohort equation (PCE), predicting hard cardiovascular outcomes only (death, myocardial infarction, stroke, resuscitated cardiac arrest), and may be less prone to overestimating risk than the Australian absolute cardiovascular disease risk (ACVDR) tool. Second, the current threshold for initiating statin therapy in Australia is ACVDR 5‐year CVD risk of 10%;1 the ACC/AHA guidelines recommend statin therapy for people with 10‐year PCE risk of 7.5%.2 Finally, the ACC/AHA guidelines, but not the Australian guidelines, recognise the value of coronary artery calcium (CAC) scores for guiding treatment of people at intermediate risk of cardiovascular events.1,2
CAC scores are correlated with atherosclerotic plaque burden and risk of cardiovascular disease (CVD) and, together with standard risk factors, can improve risk stratification; a consensus is emerging that statin therapy is warranted for people with CAC scores of 100 or more.3,4 Moreover, by identifying subclinical disease and the potential benefit of reducing low density lipoprotein cholesterol (LDL‐C) levels, CAC scoring may motivate clinicians to initiate and patients to adhere to statin therapy.5,6
Recent position statements by the Cardiac Society of Australia and New Zealand (CSANZ)7 and the National Heart Foundation (NHF)8 reflect CAC recommendations in overseas guidelines, but note that local information on outcomes and cost‐effectiveness is limited. A United States study found that statin treatment guided by CAC scores may be more cost‐effective than standard predicted risk thresholds, and that adherence to therapy is an important contributor to its benefit.9
We therefore evaluated the cost‐effectiveness of CAC‐guided and risk score‐based statin treatment thresholds by analysing treatment outcomes for Australians with family histories of premature coronary artery disease.
Methods
We analysed data from the Coronary Artery calcium score: Use to Guide management of HerediTary Coronary Artery Disease (CAUGHT‐CAD) trial10 (Australian New Zealand Clinical Trials Registry ACTRN12614001294640). This randomised controlled trial assessed the utility of CAC scoring for guiding risk evaluation and statin therapy as primary prevention in people with family histories of early onset coronary artery disease. In brief, CAC scores were calculated for 1083 men and women aged 40–70 years at low to intermediate CVD risk (5‐year ACVDR: 2–15%), but free of clinical cardiovascular disease at baseline (Supporting Information, table 1). We compared the cost‐effectiveness of following the Australian guidelines for statin therapy (ACVDR 5‐year risk ≥10%) with three sets of less restrictive eligibility criteria:
- people with ACVDR 5‐year risk ≥2% and CAC scores >0;
- people with ACVDR 5‐year risk ≥2% and CAC scores ≥100;
- people with 10‐year PCE risk ≥7.5% (ACC/AHA guidelines2).
Economic model
We evaluated economic and clinical outcomes over fifteen years from the perspective of the Australian health care system (Medicare, Pharmaceutical Benefits Scheme, public hospitals) in a Markov microsimulation state transition model (TreeAge Healthcare Pro 2018) (Box 1). In the model, all people were initially symptom‐free, receiving or not receiving statin therapy according to eligibility and the probability of statins being prescribed. Each year, statin therapy could be maintained or discontinued, or the person could experience a relevant event, including death from non‐cardiovascular causes. In the case of a non‐fatal cardiovascular event, the person was deemed to have entered a symptomatic, secondary prevention state. Health care costs and changes to health status, measured as quality‐adjusted life years (QALYs), were associated with time in each state and the transitions between states (Supporting Information, table 2).
Model assumptions and outcomes
The annual risk of coronary events was determined on the basis of the 10‐year Multi‐Ethnic Study of Atherosclerosis (MESA) risk,11 that of stroke events on the basis of 10‐year Framingham Stroke Risk12 (Supporting Information,
table 2). Numbers of deaths from non‐cardiovascular causes were derived from age and sex‐dependent mortality in the General Record of Incidence of Mortality dataset for 201713 (Supporting Information, table 3).
Based on the findings of the Swedish VIPVIZA evaluation of changes in CVD risk after ultrasound assessment of asymptomatic carotid plaque,6 our modelling of CAC‐guided selection assumed higher rates of statin therapy initiation, greater LDL‐C level reduction by statin treatment (1.0mmol/L with CAC screening [relative risk, 0.76]; 0.5mmol/L without CAC screening [relative risk, 0.88]), and lower rates of statin therapy discontinuation than for non‐CAC‐guided strategies (Australian1 and American guidelines2). Our assumptions regarding statin initiation (90% of eligible patients with CAC‐guided selection, 70% without CAC‐guided selection) and persistence were based on data from the CAUGHT‐CAD study14 and meta‐analysis of trials examining the influence of CAC scoring on primary prevention therapy.5
Assumptions about health status changes were based on the findings of Australian and American studies (Supporting Information, table 2). Statin therapy‐related harm (disutility) was deemed equivalent to losing two weeks of health over ten years (0.0031 QALYs). Total CAC screening costs included the computed tomography scan ($198) and costs related to adverse outcomes, incidental findings, and risk of cardiac stress testing. Treatment costs were based on the National Hospital Cost Data, and economic evaluations15,16 and the Medicare Benefits Schedule (MBS; http://www.mbsonline.gov.au). Medication costs were based on the Pharmaceutical Benefits Scheme (PBS; https://www.pbs.gov.au) dispensed price for the maximum quantity of atorvastatin (40mg), adjusted for lower treatment adherence associated with eligibility criteria not taking CAC scores into account. All costs were deflated to 2019 prices according to the Australian Institute of Health and Welfare Total Health Price Index17 and the Australian Bureau of Statistics consumer price index for health goods.18 Costs and outcomes were discounted by 3% per annum.
Statistical analysis
The statistical significance of differences between strategies or subgroups in baseline characteristics, costs, and QALYs were assessed in t tests (continuous variables) or χ2 tests (categorical variables) without adjustment for multiple comparisons. Incremental cost‐effectiveness ratios (ICERs) were calculated by dividing mean incremental cost differences by incremental effectiveness (QALYs gained). The 95% confidence interval (CI) for the ICER of a CAC‐guided strategy compared with standard care was derived from 1000 microsimulations. Cost‐effectiveness was defined by standard and strict (highly cost‐effective) willingness‐to‐pay thresholds of $50000 and $35000 per QALY gained respectively.19 Subgroup analyses assessed cost‐effectiveness by age, sex, socio‐economic status, and LDL‐C level.
We assessed the impact on cost‐effectiveness of varying individual parameter values (deterministic sensitivity analyses), including statin therapy initiation, statin adherence, time horizon, global discount rate (0%, 5%), and the costs and utility consequences for CVD and non‐CVD events, including death. Multi‐parameter probabilistic sensitivity analyses with 500 second‐order Monte Carlo simulations incorporated almost all model parameters (value distributions: Supporting Information, table 2). Probabilistic sensitivity analyses were used to derive confidence intervals and evaluate the uncertainty of our ICER estimates. Probabilistic sensitivity analyses randomly select parameter values according to their probability distributions; the aim is to assess whether a strategy is likely to be cost‐effective in practice, where parameter values may differ from those in our base model.
To assess the economic benefits of treatment at lower risk thresholds than recommended in Australian guidelines when risk is more accurately predicted, we also assessed the relative cost‐effectiveness of initiating statin therapy for people with 10‐year MESA risk of 7.5% or more (equivalent to a CVD event rate of 10% or more).
Ethics approval
Our study was approved by the Tasmanian Human Research Ethics Committee (14‐281) and by all participating institutions. All participants provided written informed consent for inclusion in the CAUGHT‐CAD trial.
Results
The baseline characteristics of the 1083 CAUGHT‐CAD participants included in our analysis are summarised in Box 2, their 10‐year predicted MESA risk by treatment strategy and statin therapy eligibility criteria in the Supporting Information, table 4. According to Australian guidelines,1 statin therapy would be recommended for 77 participants (7.1%). With ACVDR 5‐year risk ≥2% and CAC score>0 as the criteria, 496 people would be eligible (46%); with ACVDR 5‐year risk ≥2% and CAC score≥100, 155 would be eligible (14%). According to ACC/AHA guidelines,2 266 people were eligible for statin therapy (25%) (Supporting Information, table 4).
Costs and cost‐effectiveness
Compared with applying the standard Australian eligibility criteria,1 CAC‐guided strategies increased the mean cost to the health care system by $493 (95% CI, $466–521) per person with CAC score>0 as the criterion and by $289 (95% CI, $270–308) with CAC score≥100 as the criterion. With CAC score>0 as the criterion, 267 deaths and 795 symptomatic cardiovascular events were averted, achieving a mean increase of 0.0093 (95% CI, 0.0074–0.0112) QALYs per person at a mean ICER of $53028 per QALY gained. With CAC score≥100 as the criterion, 163 deaths and 330 symptomatic cardiovascular events were averted, achieving a mean increase of 0.0087 QALYs per person at an ICER of $33108 per QALY gained. The mean cost of applying the American guidelines2 was also higher than applying the Australian guidelines (+$92 per person; 95% CI, $81–103 per person), but did not increase utility. With a 10‐year MESA CVD risk threshold of 7.5% as the criterion for statin therapy, the number of eligible people was 209 (19.7%), with an estimated ICER of $37919 per QALY gained (Box 3).
Optimal risk threshold for coronary artery calcium scanning
The cost‐effectiveness of CAC score‐guided selection relative to Australian or American guidelines increased with baseline risk (Box 4; Supporting Information, tables 5 and 6). A strategy based on CAC scores greater than 0 was cost‐effective and dominated the current Australian strategy (ie, was cost‐effective and was less expensive) when the baseline 5‐year ACVDR risk was 10% or more, but was not cost‐effective if the baseline risk was less than 8% (Supporting Information, table 5). A strategy based on CAC scores ≥100 was cost‐effective if the baseline 5‐year ACVDR risk was at least 5% (Supporting Information, table 7).
Subgroup, sensitivity, and uncertainty analyses
CAC‐guided selection (CAC score>0) was cost‐effective for men, and for people over 60 years of age, with LDL‐C levels exceeding 4.0mmol/L, or from lower socio‐economic status areas (Box 5). The American strategy was more cost‐effective than the Australian approach for people with LDL‐C levels of 4.1mmol/L or more (Supporting Information, table 8).
Reducing CAC screening costs by $1 reduced the ICER for CAC‐guided selection (CAC score>0) compared with the standard Australian approach by $99 per QALY gained. Disregarding statin therapy disutility reduced the ICER (by $24832 per QALY gained); if disutility was deemed equivalent to losing four weeks of health over ten years (ie, twice the base estimate), the CAC‐guided strategy (CAC score>0) was no longer cost‐effective (mean change in ICER, $412251 per QALY gained) (Supporting Information, table 9). The costs and utility values associated with acute symptomatic CVD events had small effects on the cost‐effectiveness of CAC‐guided selection (CAC score>0) (Supporting Information, table 10).
Deterministic sensitivity analyses
Changes in relative risk reduction attributable to statin therapy for the Australian strategy (0.75–0.95, as a marker of statin adherence) had a smaller influence on the ICER for the CAC‐guided strategy (CAC score>0) than changes in relative risk reduction attributable to statin therapy with the CAC‐guided strategy (Supporting Information, table 11). With the Australian strategy, statin initiation in at least 80% of eligible people was required to render the CAC‐guided strategy (CAC score>0) highly cost‐effective (ICER < $35000/QALY gained) even at low (20%) initiation rates (Supporting Information, figure 1). This increased to >90% when the statin initiation rate in the Australian strategy was 80%.
Applying a shorter time horizon (ten years) increased the ICER for the CAC‐guided strategy by $133367 per QALY gained, a higher global discount rate (5%) by $15410 per QALY gained (Supporting Information, table 11).
Probabilistic sensitivity analysis
The mean cost for the CAC‐guided strategy (CAC score>0) was $462 per person (95% CI, $455–468) higher than for current Australian practice but was more effective (+0.0085 [95% CI, +0.0081–0.0090] QALY gained per person), yielding a mean ICER of $54055 (95% CI, $22 847–203834) per QALY gained. The mean incremental cost of the American strategy was $129 (95% CI, $126–132) higher than current Australian practice, but was not more effective (mean difference in utility, –0.0001 QALYs gained per person; 95% CI, –0.0002 to 0.0000 QALYs gained per person). Applying a willingness‐to‐pay threshold of $50000, the CAC score‐guided approach was cost‐effective in 50.5% of model iterations; applying a threshold of $35000, it was cost‐effective in 17.8% of iterations (Supporting Information, figure 2).
Discussion
Our major findings were that CAC‐guided statin treatment selection, but not simply reducing the risk threshold for commencing statin therapy (American guidelines), can be cost‐effective compared with current Australian recommended practice; that the quality of risk assessment and adherence to statin therapy influenced cost‐effectiveness; that CAC‐guided selection was more cost‐effective with a CAC score threshold of 100 than with a threshold of 0; and that CAC‐guided selection was not cost‐effective when baseline ACVDR risk was less than 5% (CAC ≥100) or 8% (CAC>0).
Initiating statin therapy for people with family histories of early onset coronary artery disease and CAC scores greater than 0 was more expensive but more cost‐effective than applying Australian guideline recommendations.1 However, at a willingness‐to‐pay threshold of $50000 per QALY gained, the probability that it was not cost‐effective for an individual patient was almost 50%. The ICER could be reduced by screening only people at higher baseline CVD risk: those aged 60 years or more (217 of 356 [61%] had positive CAC scans; Supporting Information, table 12) or with 5‐year ACVDR risk of at least 6%, men, and people from lower socio‐economic status areas. Our findings also support CSANZ7 and NHF8 statements that a CAC score of 100 is a suitable eligibility threshold for statin treatment, as is an ACVDR threshold of 5% for CAC assessment.7 Nevertheless, traditional risk factors retain their independent predictive value, and statin treatment is appropriate for people with low CAC scores but at higher baseline risk.
PCE scores seem better correlated with subclinical disease than the ACVDR,21 and the 10‐year MESA risk (which takes both CAC scores and traditional risk factors into account) outperforms the ACVDR with respect to absolute risk prediction and reclassification.4,12 Optimal risk reclassification and not treating people with low CVD risk is important for the cost‐effectiveness of CAC score‐guided selection. Lower treatment thresholds (American guidelines) increase the number of people treated but do not increase mean benefit, probably because of statin disutility and the low value of extending treatment to people with low CAC scores. In contrast, extending treatment to people with an equivalent MESA 10‐year risk of 7.5%, or to anyone with non‐zero CAC scores (about 45% of the study sample), were each more cost‐effective than the American guideline recommendations when compared with the Australian guidelines. Lower treatment thresholds may therefore be economically justifiable if more accurate risk assessment tools are used.
Moreover, if we assumed that statin therapy reduces CVD risk by 25% (equivalent to LDL‐C reduction of 1.0mmol/L) for all selection strategies, CAC score‐guided selection was not markedly more cost‐effective than the Australian approach. Our findings that lower treatment thresholds alone may not be cost‐effective are consistent with those of studies in similar health care systems (eg, the United Kingdom), where acute health care costs are lower than in the United States.22 The limits of CAC score‐guided reclassification of risk was evident for people with baseline risk ACVDR of 5% or lower, for whom the proportion of positive scans is small and 10‐year CVD risk can be low, despite non‐zero CAC scores.3
Assumptions about statin initiation, adherence, and persistence influenced the estimated cost‐effectiveness of CAC score‐guided selection, and therefore the generalisability of our findings to all people with family histories of early onset coronary artery disease. Our model assumed an initiation rate of 90% for the CAC score‐based strategy, but in one prospective intervention study only 77% of people with CAC scores of 100 or more subsequently commenced cholesterol‐ or blood pressure‐lowering therapy.23 We found that a statin initiation rate of at least 90% was required for the CAC‐guided strategy (CAC score>0) to be highly cost‐effective. This is optimistic; reported initiation rates in the community are generally no higher than 50% and may be as low as 15%.14,23
Model values for absolute LDL‐C reduction with the CAC score‐based strategy (1.0mmol/L) and for the difference between CAC score‐ and non‐CAC‐guided strategies (about 0.5mmol/L) were derived from the VIPVIZA study.6,24 Greater reductions in LDL‐C when subclinical atherosclerosis is assessed have been reported,24,25 providing robust evidence that taking it into account can help reduce CVD risk to a greater extent than standard care, perhaps because of improved medication adherence and lifestyle changes, or more aggressive management of risk factors.5,24 An important assumption of our model was that LDL‐C reduction would be greater with the CAC‐guided strategy over fifteen years. CVD risk was reduced for three years in the VIPVIZA study, but whether this benefit is sustained in the longer term has not been established.26
Statin therapy discontinuation (assumed rates: CAC‐guided selection: 35%; Australian and American guideline‐guided selection: 45%) moderately influenced cost‐effectiveness. The persistence of lipid level reduction in people who underwent CAC scanning range between 69% and 90%,5 but one meta‐analysis found that long term statin therapy persistence in the general community was lower than 60%.27 Our findings suggest that CAC screening may play a role beyond reclassifying risk in people at intermediate risk of CVD. A CAC‐guided strategy for people with higher baseline CVD risk was less expensive than the Australian guidelines, probably because of greater on‐treatment LDL‐C reduction and treatment persistence that result in lower treatment costs for symptomatic CVD. Recommendations for statin therapy for this group do not markedly differ by strategy, as most participants with high baseline risk had positive CAC scores and were eligible for statin therapy using any strategy.
Limitations
Our study included people with family histories of premature coronary artery disease, but generally at low CVD risk (low rates of diabetes and smoking); the role for CAC assessment in de‐escalating therapy in people at high risk is, in any case, limited. Second, MESA and PCE risk algorithms have not been validated in an Australian population; systematic overestimation of 10‐year risk using MESA would bias our results in favour of CAC screening. We did not model improvements in other manifestations of atherosclerosis, such as peripheral vascular disease, nor did we model the effect of statin selection strategy on anti‐hypertensive treatment, as guideline‐recommended pharmacotherapy does not take CAC into account.28 However, identifying CAC may also encourage better blood pressure control (not modelled), which would increase the cost‐effectiveness of CAC‐guided selection.24 Third, we did not assess indirect costs (eg, productivity losses), perhaps leading to underestimation of the cost‐effectiveness of CAC‐guided selection in younger people. Fourth, we did not model statin treatment after risk re‐assessment (with any selection strategy) over 15 years. Finally, values for the probability of specialist referral and stress testing by strategy were based on the authors’ opinions because relevant publicly available data are not available; varying the values in sensitivity analyses yielded similar results to the main analysis. We did not include invasive coronary angiography referrals in our model because the participants did not have symptomatic CVD; further, CAC screening does not increase downstream medical testing costs in the medium term.25
Conclusion
A CAC‐guided strategy for selecting people with family histories of premature coronary artery disease for statin therapy (CAC score>0) was more cost‐effective than selection according to Australian CVD prevention guidelines if treatment adherence rates are taken into account. Systematic CAC assessment was cost‐effective if statin therapy was initiated in people with baseline ACVDR risk of at least 5% and CAC scores of 100 or more. Incorporating non‐traditional risk factors and refining criteria for statin treatment should be considered when revising primary CVD prevention guidelines in Australia.
Box 1 – The Markov microsimulation state transition model used in our analysis*
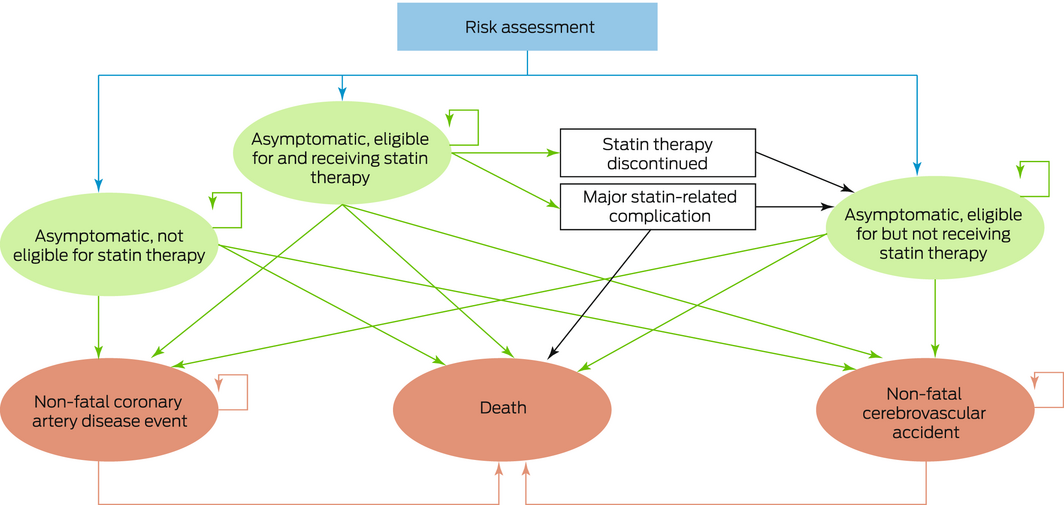
* For further details, see Supporting Information, table 2.
Box 2 – Baseline characteristics of the 1083 CAUGHT‐CAD participants included in our analysis
|
|
Coronary artery calcium score |
||||||||||||||
|
Characteristic |
0 |
>0 |
P* |
≥100 |
P* |
||||||||||
|
|
|||||||||||||||
|
Participants |
587 |
496 |
|
|
|
||||||||||
|
Age (years), median (IQR) |
54 (48–59) |
59 (54–63) |
<0.001 |
59 (55–63) |
<0.001 |
||||||||||
|
Age at coronary artery disease onset in relative (years), median (IQR) |
52 (48–57) |
52 (48–57) |
0.55 |
52 (48–57) |
0.86 |
||||||||||
|
Sex (men) |
230 (39%) |
294 (59%) |
<0.001 |
109 (70%) |
<0.001 |
||||||||||
|
Total cholesterol (mmol/L), median (IQR) |
5.5 (5.0–6.0) |
5.6 (5.1–6.0) |
0.41 |
5.6 (5.2–6.0) |
0.39 |
||||||||||
|
High density lipoprotein cholesterol (mmol/L), median (IQR) |
1.5 (1.2–1.8) |
1.4 (1.2–1.7) |
0.15 |
1.4 (1.2–1.7) |
0.06 |
||||||||||
|
Smoking history |
|
|
0.38 |
|
0.09 |
||||||||||
|
Non‐smoker |
348 (60%) |
277 (56%) |
|
82 (53%) |
|
||||||||||
|
Ex‐smoker |
203 (35%) |
182 (39%) |
|
59 (38%) |
|
||||||||||
|
Weekly smoker |
9 (2%) |
4 (1%) |
|
3 (2%) |
|
||||||||||
|
Daily smoker |
20 (3%) |
22 (4%) |
|
11 (7%) |
|
||||||||||
|
Systolic blood pressure (mmHg), mean (SD) |
130 (14) |
130 (13) |
0.76 |
132 (13) |
0.09 |
||||||||||
|
Hypertension treatment |
89 (15%) |
107 (22%) |
0.008 |
35 (23%) |
0.14 |
||||||||||
|
Diabetes mellitus |
8 (1%) |
9 (2%) |
0.68 |
3 (2%) |
0.72 |
||||||||||
|
Socio‐economic status: IRSAD, median (IQR) |
1029 (985–1072) |
1034 (985–1073) |
0.52 |
1031 (989–1073) |
0.39 |
||||||||||
|
Pooled cohort equation 10‐year risk, median (IQR) |
3.1% (1.7–5.2%) |
5.9% (3.1–9.9%) |
<0.001 |
7.7 (4.0–12.4) |
<0.001 |
||||||||||
|
|
|||||||||||||||
|
IQR = interquartile range; IRSAD = Index of Relative Social Advantage and Disadvantage;20 SD = standard deviation. * Compared with coronary artery calcium score = 0. |
|||||||||||||||
Box 3 – Relative cost‐effectiveness of coronary artery calcium (CAC) score‐guided statin eligibility, applying American College of Cardiology/American Heart Association criteria,2 or applying Multi‐Ethnic Study of Atherosclerosis criteria1 (compared with Australian guidelines1)
|
|
Australian guidelines: 5‐year CVD risk≥10%* |
Coronary artery calcium (CAC) score‐guided approach |
American guidelines: 10‐year pooled cohort equation risk≥7.5% |
MESA score≥7.5% |
|||||||||||
|
|
5‐year ACVDR≥2%/CAC score>0 |
5‐year ACVDR≥2%/CAC score≥100 |
|||||||||||||
|
|
|||||||||||||||
|
Number of microsimulation trials |
100000 |
100000 |
100000 |
100000 |
100000 |
||||||||||
|
Number of people eligible for statin therapy |
77 (7.1%) |
496 (45.8%) |
155 (14.3%) |
266 (24.6%) |
209 (19.7%) |
||||||||||
|
Health care system costs per person, mean (95% CI) |
$4977 ($4909–5046) |
+$493 (+$466–521) |
+$289 (+$270–308) |
+$92 (+$81–103) |
+$288 (+$267–309) |
||||||||||
|
Utility: QALYs gained per person, mean (95% CI) |
9.587 (9.580–9.595) |
+0.009 (+0.007–0.011) |
+0.009 (+0.007–0.010) |
+0.000 (–0.001 to +0.001) |
+0.008 (+0.006–0.009)† |
||||||||||
|
Incremental cost‐effectiveness ratio (per QALY gained) |
— |
$53028 |
$33108 |
$909241 |
$37919 |
||||||||||
|
Deaths |
13792 |
–267 |
–163 |
–29 |
–155 |
||||||||||
|
Incident CVD events averted (fatal/non‐fatal) |
|
|
|
|
|
||||||||||
|
Coronary artery disease |
6709 |
–611 |
–272 |
–73 |
–396 |
||||||||||
|
Cerebrovascular accidents |
2900 |
–184 |
–57 |
–28 |
–68 |
||||||||||
|
Number needed to scan to prevent one CVD event |
— |
125 |
303 |
— |
215 |
||||||||||
|
Person‐years per symptomatic CVD event averted |
49859 |
–4286 |
–1242 |
–474 |
–2512 |
||||||||||
|
Major statin complications |
289 |
+2554 |
+560 |
+685 |
+910 |
||||||||||
|
Person‐years of statin therapy |
86175 |
+328405 |
+71932 |
+92668 |
+117023 |
||||||||||
|
|
|||||||||||||||
|
ACVDR = absolute cardiovascular disease risk; CI = confidence interval; CVD = cardiovascular disease; MESA = Multi‐Ethnic Study of Atherosclerosis;11 QALY = quality‐adjusted life year. * These values are for the CAC>0 and American guidelines simulation trials. For the MESA and CAC ≥100 strategies, separate microsimulation trials were performed; consequently, the cost and effectiveness values for current Australian practice were slightly different; for the sake of clarity, they are not included in the table. For all comparisons with Australian guidelines, P <0.001, except † P =0.84. |
|||||||||||||||
Box 4 – Incremental cost and incremental effectiveness of the coronary artery calcium score‐guided statin therapy eligibility (compared with Australian guidelines), by baseline 5‐year absolute cardiovascular risk (ACVDR)
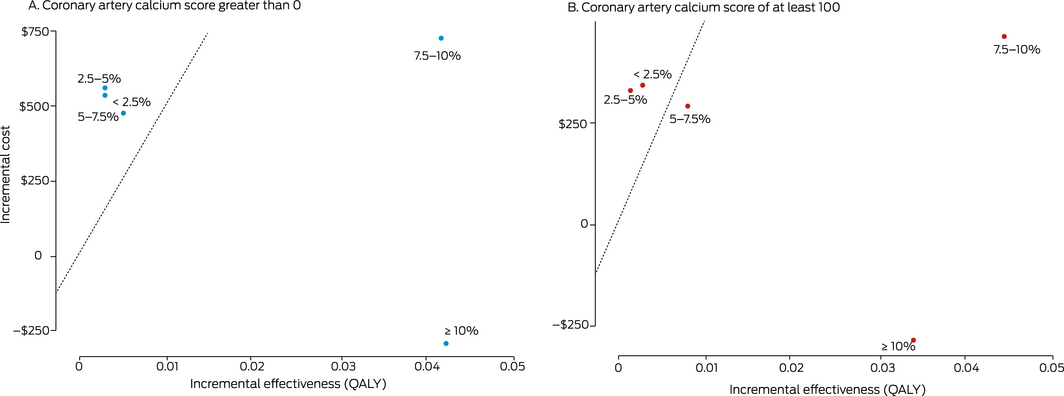
Points indicate 5‐year ACVDR; dashed line indicates willingness‐to‐pay threshold of $50000 per quality‐adjusted life year (QALY) gained.
Box 5 – Relative cost‐effectiveness of coronary artery calcium (CAC) score‐guided statin eligibility (CAC score>0; compared with Australian guidelines1), by socio‐demographic and lipid characteristics
|
Characteristic |
Proportion of model iterations |
Incremental cost effectiveness ratio |
|||||||||||||
|
|
|||||||||||||||
|
Age (years) |
|
|
|||||||||||||
|
40 to under 50 |
23061 (23%) |
$58644 |
|||||||||||||
|
50 to under 60 |
43329 (43%) |
$101329 |
|||||||||||||
|
60 or older |
33609 (34%) |
$33707 |
|||||||||||||
|
Sex |
|
|
|||||||||||||
|
Men |
48551 (49%) |
$22452 |
|||||||||||||
|
Women |
51449 (51%) |
$2683201 |
|||||||||||||
|
Socio‐economic status: IRSAD score |
|
|
|||||||||||||
|
Low* |
26921 (27%) |
$39407 |
|||||||||||||
|
High |
73079 (73%) |
$60999 |
|||||||||||||
|
Low‐density lipoprotein cholesterol (mmol/L) |
|
|
|||||||||||||
|
≥4.0 |
17515 (18%) |
$38787 |
|||||||||||||
|
<4.0 |
82485 (82%) |
$55536 |
|||||||||||||
|
|
|||||||||||||||
|
IRSAD = Index of Relative Social Advantage and Disadvantage.20 * Below the median Australian IRSAD score for all postcodes. |
|||||||||||||||
Competing interests
No relevant disclosures.
Acknowledgements
This investigation was supported by a National Health and Medical Research Council project grant (GRT1080582) and a Postgraduate Scholarship for Prasanna Venkataraman (GRT1169357).
References
- National Vascular Disease Prevention Alliance. Guidelines for the management of absolute cardiovascular disease risk. 2012. https://irp.cdn‐website.com/5a7b1d9a/files/uploaded/Absolute_CVD_Risk_Full_Guidelines.pdf (viewed Dec 2022).
- Arnett DK, Blumenthal RS, Albert MA, et al. 2019 ACC/AHA guideline on the primary prevention of cardiovascular disease. Executive summary: a report of the American College of Cardiology/American Heart Association task force on clinical practice guidelines. J Am Coll Cardiol 2019; 74: 1376‐1414.
- Lloyd‐Jones DM, Braun LT, Ndumele CE, et al. Use of risk assessment tools to guide decision‐making in the primary prevention of atherosclerotic cardiovascular disease: a special report from the American Heart Association and American College of Cardiology. Circulation 2019; 139: e1162‐e1177.
- Blaha MJ, Whelton SP, Al Rifai M, et al. Comparing risk scores in the prediction of coronary and cardiovascular deaths: Coronary Artery Calcium Consortium. JACC Cardiovasc Imaging 2021; 14: 411‐421.
- Gupta A, Lau E, Varshney R, et al. The identification of calcified coronary plaque is associated with initiation and continuation of pharmacological and lifestyle preventive therapies: a systematic review and meta‐analysis. JACC Cardiovasc Imaging 2017; 10: 833‐842.
- Näslund U, Ng N, Lundgren A, et al; VIPVIZA trial group. Visualization of asymptomatic atherosclerotic disease for optimum cardiovascular prevention (VIPVIZA): a pragmatic, open‐label, randomised controlled trial. Lancet 2019; 393: 133‐142.
- Hamilton‐Craig CR, Chow CK, Younger JF, et al. Cardiac Society of Australia and New Zealand position statement executive summary: coronary artery calcium scoring. Med J Aust 2017; 207: 357‐361. https://www.mja.com.au/journal/2017/207/8/cardiac‐society‐australia‐and‐new‐zealand‐position‐statement‐executive‐summary
- Jennings GL, Audehm R, Bishop W, et al. National Heart Foundation of Australia position Statement on coronary calcium scoring for primary prevention of cardiovascular disease in Australia. Med J Aust 2021; 214: 434‐439. https://www.mja.com.au/journal/2021/214/9/national‐heart‐foundation‐australia‐position‐statement‐coronary‐artery‐calcium
- Venkataraman P, Kawakami H, Huynh Q, et al; CAUGHT‐CAD investigators. Cost‐effectiveness of coronary artery calcium scoring in people with a family history of coronary disease. JACC Cardiovasc Imaging 2021; 14: 1206‐1217.
- Marwick TH, Whitmore K, Nicholls SJ, et al; CAUGHT‐CAD Investigators. Rationale and design of a trial to personalize risk assessment in familial coronary artery disease. Am Heart J 2018; 199: 22‐30.
- McClelland RL, Jorgensen NW, Budoff M, et al. 10‐Year coronary heart disease risk prediction using coronary artery calcium and traditional risk factors: derivation in the MESA (Multi‐Ethnic Study of Atherosclerosis) with validation in the HNR (Heinz Nixdorf Recall) study and the DHS (Dallas Heart Study). J Am Coll Cardiol 2015; 66: 1643‐1653.
- Dufouil C, Beiser A, McLure LA, et al. Revised Framingham stroke risk profile to reflect temporal trends. Circulation 2017; 135: 1145‐1159.
- Australian Institute of Health and Welfare. General record of incidence of mortality (GRIM) data (AIHW cat. no. PHE 229). https://www.aihw.gov.au/reports/life‐expectancy‐deaths/grim‐books/contents/about (viewed Dec 2020).
- Venkataraman P, Huynh Q, Nicholls SJ, et al; CAUGHT‐CAD investigators. Impact of a coronary artery calcium‐guided statin treatment protocol on cardiovascular risk at 12 months: results from a pragmatic, randomised controlled trial. Atherosclerosis 2021; 334: 57‐65.
- National Heart Foundation. Economic cost of acute coronary syndrome in Australia: the cost to governments. 2018. https://resources.heartfoundation.org.au/images/uploads/publications/ACS_Overview_of_Reports_‐_Cost_of_ACS_to_Governments—Individuals_and_Families_August_2018.pdf (viewed Jan 2022).
- Independent Hospital Pricing Authority. National hospital data collection report: public sector, round 21 financial year 2016–17; appendix tables, version 9.0. 12 Mar 2019. https://www.ihacpa.gov.au/sites/default/files/2022‐08/Round%2021%20NHCDC%20Report%20‐%20Appendix%20Tables.xlsx (viewed Jan 2023).
- Australian Institute of Health and Welfare. Health expenditure Australia 2017–18 (AIHW cat. no. HWE 77; Health and welfare expenditure no. 65). 2019. https://www.aihw.gov.au/getmedia/80dcaae7‐e50f‐4895‐be1f‐b475e578eb1b/aihw‐hwe‐77.pdf (viewed Jan 2022).
- Australian Bureau of Statistics. Consumer price index, Australia. Reference period Dec 2019. 29 Jan 2020. https://www.abs.gov.au/statistics/economy/price‐indexes‐and‐inflation/consumer‐price‐index‐australia/dec‐2019#main‐contributors‐to‐change (viewed Jan 2021).
- Edney LC, Haji Ali Afzali H, Cheng TC, Karnon J. Estimating the reference incremental cost‐effectiveness ratio for the Australian health system. Pharmacoeconomics 2018; 36: 239‐252.
- Australian Bureau of Statistics. 2033.0.55.001. Census of population and housing: Socio‐Economic Indexes for Areas (SEIFA), Australia, 2016. 27 Mar 2018. https://www.abs.gov.au/AUSSTATS/abs@.nsf/DetailsPage/2033.0.55.0012016?OpenDocument#Publications (viewed Jan 2023).
- Venkataraman P, Stanton T, Liew D, et al. Coronary artery calcium scoring in cardiovascular risk assessment of people with family histories of early onset coronary artery disease. Med J Aust 2020; 213: 170‐177. https://www.mja.com.au/journal/2020/213/4/coronary‐artery‐calcium‐scoring‐cardiovascular‐risk‐assessment‐people‐family
- Ferket BS, Hunink MG, Khanji M, et al. Cost‐effectiveness of the polypill versus risk assessment for prevention of cardiovascular disease. Heart 2017; 103: 483‐491.
- Denissen SJ, van der Aalst CM, Vonder M, et al. Impact of a cardiovascular disease risk screening result on preventive behaviour in asymptomatic participants of the ROBINSCA trial. Eur J Prev Cardiol 2019; 26: 1313‐1322.
- Schilling C, Knight J, Mortimer D, et al. Australian general practitioners initiate statin therapy primarily on the basis of lipid levels; New Zealand general practitioners use absolute risk. Health Policy 2017; 121: 1233‐1239.
- Rozanski A, Gransar H, Shaw LJ, et al. Impact of coronary artery calcium scanning on coronary risk factors and downstream testing the EISNER (early identification of subclinical atherosclerosis by noninvasive imaging research) prospective randomized trial. J Am Coll Cardiol 2011; 57: 1622‐1632.
- Bengtsson A, Norberg M, Ng N, et al. The beneficial effect over 3 years by pictorial information to patients and their physician about subclinical atherosclerosis and cardiovascular risk: results from the VIPVIZA randomized clinical trial. Am J Prev Cardiol 2021; 7: 100199.
- Ofori‐Asenso R, Jakhu A, Zomer E, et al. Adherence and persistence among statin users aged 65 years and over: a systematic review and meta‐analysis. J Gerontol A Biol Sci Med Sci 2018; 73: 813‐819.
- National Heart Foundation of Australia. Guidelines for the diagnosis and management of hypertension in adults. 2016. https://www.heartfoundation.org.au/getmedia/c83511ab‐835a‐4fcf‐96f5‐88d770582ddc/PRO‐167_Hypertension‐guideline‐2016_WEB.pdf (viewed Dec 2022).
Fatty Liver Disease in Australia: A Narrative Review on the Epidemiology, Natural History, Prognostication and Management in People With Metabolic Dysfunction
Karl Vaz, Daniel Clayton-Chubb, William W. Kemp, Stuart K. Roberts, Ammar Majeed
Sex Differences in Management and Outcomes of People With ST-Elevation Myocardial Infarction, New South Wales, 2011–2020: A Retrospective Cohort Study
Adam C. Livori, Jedidiah I. Morton, Dianna J. Magliano, Jonathan E. Shaw
Rethinking Rheumatic Fever Diagnosis: Progress, Pitfalls and the Path Towards a Definitive Test
Anna P. Ralph, Rachel Webb, Tom Parks, Nicole J. Moreland, Asha C. Bowen, Benjamin Jones, Emma Ndagire, Andrea Z. Beaton
Sex Differences in Management and Outcomes of People With ST-Elevation Myocardial Infarction, New South Wales, 2011–2020: A Retrospective Cohort Study
Samia Kazi, Simone Marschner, Clara K. Chow
Distribution of Cardiovascular Disease Risk Based on the Updated 2023 Guideline-Recommended Australian Cardiovascular Disease Risk Algorithm and Comparison With the 2012 Algorithm: An Observational Study
Nina Lazarevic, Meghana Bhat, Grace Joshy, Danielle C. Butler, Mark Woodward, Anushka Patel, Rod T. Jackson, Garry Jennings, Rosemary Wyber, Ellie Paige, Emily Banks
They Brought the Hospital to Me
Hugh N. Burrill