


The known: Self‐reported wheat sensitivity is common, affecting about 10% of people worldwide, but its incidence is not known. A notable proportion of people without coeliac disease avoid dietary gluten.
The new: Self‐reported wheat sensitivity was reported by 14% of respondents in both 2015 and 2018; the numbers of cases of new and of resolved sensitivity were similar during this period. About one‐quarter of respondents reported avoiding dietary gluten.
The implications: Many Australians unnecessarily subject themselves to gluten‐free diets. There is considerable overlap between people with non‐coeliac gluten sensitivity and those with functional gastrointestinal disorders.
Coeliac disease is an immune‐mediated systemic condition that affects about 1% of the Australian population.1,2,3 It manifests as a small intestinal enteropathy triggered by exposure to dietary gluten, for which the treatment is a lifelong gluten‐free diet.4 However, many Australians not diagnosed with coeliac disease also avoid gluten, having reported physiological symptoms they relate to gluten ingestion.1,5 Others avoid gluten because of its presumed general health benefits, despite evidence to the contrary.6,7,8,9
In recent years, non‐coeliac wheat or gluten sensitivity has been identified,10 characterised by gastrointestinal and other symptoms after ingesting wheat‐containing food that are not attributable to either coeliac disease (identified by serological testing and duodenal biopsy) or wheat allergy (IgE‐mediated immune allergy test).11,12 A formal diagnosis of non‐coeliac wheat or gluten sensitivity requires a labour‐intensive double blind crossover dietary challenge with gluten or wheat and placebo over at least 8 weeks,12,13 after which only a small fraction of people are found to have non‐coeliac gluten sensitivity.11 While specific clinical, serological, and pathological characteristics have been linked with the condition, no biomarkers have been established.14 Further, the relationship of non‐coeliac gluten or wheat sensitivity with other gastrointestinal disorders — including irritable bowel syndrome (IBS), functional dyspepsia, and wheat sensitivity disorders such as coeliac disease,15 wheat allergy, and eosinophilic oesophagitis16 — is yet to be defined.
A more practical working concept in clinical practice for people who report symptomatic benefit while on a gluten‐free diet is self‐reported wheat sensitivity (SRWS), or self‐reported non‐coeliac wheat sensitivity (SR‐NCWS) if coeliac disease has been excluded.17 The reported prevalence of SR‐NCWS ranges between 4.3% and 14.9%, with a pooled global prevalence of about 10%.17 We have previously reported significant overlap between SR‐NCWS and functional gastrointestinal disorders; 45% of people with SR‐NCWS fulfilled criteria for either functional dyspepsia or IBS.5 However, data on the incidence or natural history of SR‐NCWS have not been published.
Our aims in this study were to define the incidence of and factors associated with SR‐NCWS. We also aimed to describe the prevalence of gluten or wheat avoidance in the general Australian population and the reasons for avoidance.
Methods
Participants
The participant group was a subset of a general adult population group who responded to our 2015 Digestive Health and Wellbeing postal survey.5 In brief, 8499 adult participants (aged 18 years or more) were randomly selected from electoral rolls for the Newcastle and Gosford regions (metropolitan cities and their surroundings in coastal New South Wales; inclusion on the electoral roll is legally required for all Australian adults), of whom 3542 accepted invitations to participate in the 2015 survey.5 In 2018, we forwarded a second questionnaire to the 2330 respondents who had indicated they were willing to be contacted for follow‐up.
Measures
We forwarded participants the Digestive Health and Wellbeing survey in both 2015 and 2018 (Supporting Information). The survey included questions about a variety of factors:
- an abbreviated, previously validated Rome Questionnaire regarding functional gastrointestinal symptoms experienced over the past three months, with frequency assessed quantitatively (number per week) or qualitatively (from “never” to “always”);18
- medical diagnoses;
- “Do you have stomach or bowel problems when you eat wheat‐ or gluten‐based foods (eg, bread)?”;
- questions about gluten avoidance, including reasons for avoidance and whether avoidance was complete or partial (2018 questionnaire only);
- non‐specific psychological distress, assessed with the validated Kessler six‐question (K6) scale (range of scores, 0–30; higher scores indicate less distress);19
- demographic information, including age, sex, current use of proton pump inhibitors, and lifestyle factors (including smoking status).
Data linkage facilitated comparison of responses by participants to the two surveys.
Definitions
IBS and functional dyspepsia were diagnosed according to modified Rome criteria (ie, not self‐reported diagnoses). We applied modified Rome III criteria during the 2015 survey5 and modified Rome IV criteria during the 2018 survey (Supporting Information). Self‐reported wheat sensitivity was defined by respondents stating that:
- they had “stomach or bowel problems” when they ate wheat‐based foods;
- they had never been told by their doctor that they had coeliac disease; and
- they did not have inflammatory bowel disease, coeliac disease, or colonic polyps or colon cancer.
Procedures
A total of 2330 participants were forwarded the 2018 Digestive Health and Wellbeing survey in early 2018; we employed the Dillman total design method for following up non‐responders.20 The follow‐up protocol included a reminder/thank you letter mailed to all participants in week 1, a replacement survey sent to non‐responders in week 4, and a reminder/thank you letter sent in week 5 to those who had not responded by week 4. Participants received no remuneration for participation.
Statistical analysis
Statistical analysis was performed in Stata 15. Confidence intervals [CIs] for prevalence estimates were calculated with the binomial exact method. Prevalence figures for the two time points were compared in McNemar tests. Risk factor analysis for SR‐NCWS incidence and resolution (comparison of 2015 and 2018 responses) used unconditional multiple logistic regression with backward elimination, including factors from the 2015 survey: comorbid medical conditions (apart from coeliac disease and wheat intolerance), psychological distress (K6), functional dyspepsia and IBS diagnoses (Rome III criteria), age, and sex. Risk factor analysis for wheat or gluten avoidance in 2018 (single time point analysis) included factors from the 2018 survey: comorbid medical conditions, SR‐NCWS, functional dyspepsia and IBS diagnoses (Rome IV criteria), age, and sex. Independent risk factors for self‐reported wheat sensitivity were identified by backward elimination. P < 0.05 (two‐tailed) was deemed statistically significant.
Ethics approval
The study was approved by the Hunter New England Human Research Ethics Committee (NSW REGIS ethics reference, 2019/ETH03890).
Results
Response rate and sample characteristics
Of the 2330 people forwarded the 2018 survey, 145 were excluded (127 return‐to‐sender responses, 18 deceased addressees); 1322 of 2185 invitees returned the survey (response rate, 60.5%). The mean age of respondents was 63.2 years old (standard deviation [SD], 14.0 years; range, 22–97 years), and 648 were men (49%). Thirteen people reported coeliac disease diagnoses (prevalence, 1.0%; 95% CI, 0.5–1.5%).
The mean age of non‐respondents was lower (55.9 years; SD, 17.3 years) and the proportion who were men was smaller (44.0%) than those of respondents.
Self‐reported non‐coeliac wheat sensitivity (SR‐NCWS)
In participants completing both surveys, the prevalence of SR‐NCWS was similar in the two surveys (2015: 179 of 1294 respondents who responded to both surveys and for whom pertinent 2015 data were available, 13.8% [95% CI, 12.0–15.8%]; 2018: 182 of 1307 respondents, 13.9% [95% CI, 12.1–15.9%]). A total of 69 of 1301 respondents (5.3%; 95% CI, 4.2–6.7%) reported SR‐NCWS in 2018 but not 2015, an incidence of 1.8% (23 new cases) per year. Of the 179 people with SR‐NCWS in 2015, 74 (41%, or 5.7% of all respondents) did not report it in 2018. In a multivariate model, SR‐NCWS in 2015 was associated with having IBS or a food allergy, and was negatively associated with being male or older (Box 1, Box 2).
Having functional dyspepsia in 2015 was associated with incident SR‐NCWS reported in 2018; male sex and older age were negatively associated with incident SR‐NCWS (Box 2). Conversely, having functional dyspepsia in 2015 was negatively associated with resolution of SR‐NCWS by 2018, while being male was associated with resolution (Box 3). The most frequent adverse symptoms reported by people with SR‐NCWS were bloating (130 respondents, 71%), abdominal distention (82, 45%), fatigue (51, 28%), and abdominal pain (46, 25%) (Box 4).
Wheat and gluten avoidance
Wheat or gluten avoidance was reported in 2018 by 316 of 1304 respondents providing responses to this question (24.2%; 95% CI, 22.9–27.7%); 267 (20.5%) reported partial avoidance and 49 (3.8%) complete avoidance of wheat or gluten. All thirteen participants with coeliac disease avoided wheat and gluten. Among the 180 people with SR‐NCWS, 128 (71.1%; 95% CI, 63.9–77.6%) avoided wheat or gluten (103 [57.2%] partially, 25 [13.9%] completely). Among the 316 people avoiding wheat and gluten, the most frequent reasons were general health (168, 53.2%), abdominal symptoms (123, 38.9%), and to aid weight loss (109, 34.5%). Among the 128 people with SR‐NCWS avoiding wheat and gluten, the most frequent reasons were general health (69, 54%), abdominal pain (47, 37%), and weight loss (38, 30%). Among the 186 people without SR‐NCWS avoiding wheat and gluten, the most frequent reasons were general health (99, 53%) abdominal pain (76, 41%), and weight loss (71, 38%) (Box 5).
Fifty‐six of 138 people with IBS (41%) and 277 of 1184 people without IBS (23.5%) avoided wheat and gluten; 69 of 237 people with functional dyspepsia (29%) and 265 of 1085 people without functional dyspepsia (24.4%) avoided wheat and gluten. Factors independently associated with wheat and gluten avoidance included having SR‐NCWS, gluten intolerance, a food allergy, or IBS according to Rome IV criteria (Box 6).
Discussion
We have reported the first study to examine incidence and resolution rates of SR‐NCWS. The overall prevalence of SR‐NCWS according to the 2015 and 2018 surveys was similar (about 14%); similar proportions of surveyed participations reported new wheat sensitivity in 2018 (69 of 1301 respondents, 5.3%) or that their former wheat sensitivity was no longer evident (74 of 179 respondents in 2015, 5.7%). The factors associated with new SR‐NCWS were being younger or female, and having functional dyspepsia, each of which have also been associated with SR‐NCWS in other cross‐sectional prevalence studies.5 Functional dyspepsia was associated with lower odds of SR‐NCWS resolving between the two surveys, as was being male. IBS was associated with having SR‐NCWS in 2015.5 As being younger or female, which were associated with both baseline and incident SR‐NCWS, are recognised risk factors for functional gastrointestinal disorders,21,22 our findings are consistent with an epidemiological association between IBS and SR‐NCWS.
We found that almost one‐quarter of respondents were currently avoiding dietary wheat or gluten, but the prevalence of coeliac disease in Australia is only 1%. A 2016 Australian dietary survey with more than 86 000 adult participants (women, 73%) found that 12.1% were avoiding either wheat or gluten.23 Although this study was based on a voluntary online survey and therefore subject to ascertainment bias, the fact that this proportion was lower than our finding suggests that the number of people choosing to avoid wheat or gluten has increased. This interpretation is supported by an American study that found the prevalence of gluten‐free diet adherence had risen from 0.6% in 2009 to 2.1% in 2014, while the prevalence of coeliac disease was stable;24 these figures, however, are considerably lower than those for people reporting wheat‐ or gluten‐free diets in Australia (total avoidance by 3.8% of participants in our study).
Gluten avoidance was associated with having IBS in our study. Wheat is a source of fructans, food components excluded by the low FODMAP (fermentable oligo‐, di‐, monosaccharides and polyols) diet; as FODMAPs have been linked with symptom generation in IBS, this diet is now standard treatment for people with this disorder.25,26 Many people with SR‐NCWS are sensitive to fructans rather than gluten,27 which may explain the epidemiological overlap between SR‐NCWS and IBS.5 The relationship between functional dyspepsia and SR‐NCWS is less clear. Both gluten and fructans have been associated with functional dyspepsia in observational studies,28 and some patients with functional dyspepsia were found to have formal non‐coeliac gluten or wheat sensitivity in dietary crossover trials.29 Duodenal eosinophilia occurs in people with functional dyspepsia or non‐coeliac gluten or wheat sensitivity, suggesting a pathophysiological link.30,31
We found that the predominant motives for avoiding dietary wheat or gluten included general health and averting adverse reactions, which may explain why many more people avoid wheat or gluten than have coeliac disease or SR‐NCWS. A cross‐sectional survey of 99 Americans adhering to or who had previously adhered to gluten‐free diets identified weight loss, general health and well‐being, curiosity, and acne, narcolepsy or migraine prevention as motives, none of which have established connections with wheat ingestion.32 A large cross‐sectional survey in Argentina found that 0.9% of people (95% CI, 0.5–1.6%) chose gluten‐free diets for reasons unrelated to gut sensitivity, including weight control or general health.33
Identifying genuinely wheat‐sensitive individuals is important because the gluten‐free diet has a number of potential disadvantages, including adverse effects on cardiovascular risk, higher rates of micronutrient deficiency, and even increased ingestion of toxins such as arsenic.7,8,9,34,35,36,37 That gluten avoidance improves weight control or general health is not supported by published evidence. An Italian study found a high rate of metabolic syndrome in patients with newly diagnosed coeliac disease one year after commencing a gluten‐free diet (29.5%, compared with 2% at the start of the gluten‐free diet);8 a systematic review, however, did not identify similar findings in other studies.9 This is reassuring for patients with coeliac disease who require gluten‐free diets.
However, the safety of a gluten‐free diet for people with coeliac disease does not indicate that it has health benefits for those who do not, and few investigations of this question have been published. A study that assessed gluten intake in a large population sample (110 017 participants) with a validated food frequency questionnaire found that increasing estimated gluten consumption was associated with lower cardiovascular risk (highest v lowest gluten intake quintiles: adjusted hazard ratio, 0.85; 95% CI, 0.77–0.93).38 Together with our findings, this suggests that a large proportion of people in Australia avoid gluten or wheat for reasons of weight control or general health without convincing evidence supporting this choice.
Strengths and limitations
Our study had a number of strengths, including the large sample size and high response rate at follow‐up. However, many of the comorbid conditions included in the risk factor analyses (including coeliac disease) were self‐reported, and dietary gluten avoidance was not examined in the initial survey, which prevented our estimating its incidence. The participants were from metropolitan areas, and our results may not be generalisable to rural or remote locations. Further, the 2015 cohort was probably representative of the population from which it was drawn, but the final 2018 cohort may have been subject to ascertainment bias, as it comprised people who were willing to return both the 2015 and 2018 questionnaires. Finally, surveys 3 years apart yield only partial insights into the natural history of SR‐NCWS and do not provide details about time to resolution of SR‐NCWS in affected participants.
Conclusions
Self‐reported non‐coeliac wheat sensitivity is common, and its prevalence in our population sample was similar in two surveys undertaken 3 years apart. Irritable bowel syndrome was strongly associated with baseline (2015) and functional dyspepsia was associated with incident (2018) SR‐NCWS. Gluten avoidance is also common, with 24% of our sample avoiding dietary wheat or gluten.
Box 1 – Multivariate analysis of factors associated with self‐reported non‐coeliac wheat sensitivity (SR‐NCWS) in 2015 by participants who returned both the 2015 and 2018 surveys*
Characteristic (2015 survey) |
Respondents with SR‐NCWS |
Respondents without SR‐NCWS |
P |
Odds ratio (95% CI)† | |||||||||||
Total number of respondents |
179 |
1115 |
|||||||||||||
Age (years), mean (SD), per year |
54.5 (12.6) |
59.8 (14.1) |
0.001 |
0.97 (0.97–0.99) |
|||||||||||
Sex (men) |
43/179 (24%) |
591/1108 (53.3%) |
0.001 |
0.32 (0.22–0.47) |
|||||||||||
Irritable bowel syndrome (Rome III criteria) |
57/179 (32%) |
119/1115 (10.7%) |
0.001 |
3.50 (2.37–5.18) |
|||||||||||
Functional dyspepsia (Rome III criteria) |
48/179 (27%) |
154/1115 (13.8%) |
0.43 |
— |
|||||||||||
Food allergy |
23/179 (13%) |
61/1115 (5.5%) |
0.005 |
2.17 (1.24–3.79) |
|||||||||||
Atopic disease‡ |
25/179 (14%) |
105/1115 (9.4%) |
0.88 |
— |
|||||||||||
Autoimmune disease§ |
27/179 (15%) |
121/1115 (10.9%) |
0.33 |
— |
|||||||||||
Migraine |
34/179 (19%) |
111/1115 (10.0%) |
0.46 |
— |
|||||||||||
Proton pump inhibitor use |
39/173 (22%) |
196/1085 (18.1%) |
0.21 |
— |
|||||||||||
Kessler score, mean (SD) |
24.8 (5.7) |
26.0 (6.1) |
0.72 |
— |
|||||||||||
CI = confidence interval; SD = standard deviation. * Area under curve for model, 0.75 (95% CI, 0.72–0.79). † Models generated by multiple logistic regression with backward elimination; odds ratios pertain to final model after elimination of non‐significant variables. ‡ Composite endpoint including animal and pollen allergies. § Composite endpoint including scleroderma, rheumatoid arthritis, and psoriasis. | |||||||||||||||
Box 2 – Multivariate analysis of baseline factors associated with incident non‐coeliac wheat sensitivity (SR‐NCWS) in 2018 in participants who returned both the 2015 and 2018 surveys*
Characteristic (2015 survey) |
Respondents with incident SR‐NCWS |
Respondents without incident SR‐NCWS |
P |
Odds ratio (95% CI)† | |||||||||||
Total number of respondents |
69 |
1232 |
|||||||||||||
Age (years), mean (SD), per year |
51.5 (13.3) |
59.5 (14.0) |
< 0.001 |
0.97 (0.95–0.98) |
|||||||||||
Sex (men) |
14/69 (20%) |
623/1226 (51%) |
< 0.001 |
0.29 (0.16–0.53) |
|||||||||||
Irritable bowel syndrome (Rome III criteria) |
12/69 (17%) |
16951232 (13%) |
0.40 |
— |
|||||||||||
Functional dyspepsia (Rome III criteria) |
18/69 (26%) |
187/1232 (15%) |
0.049 |
1.81 (1.00–3.26) |
|||||||||||
Food allergy |
8/69 (12%) |
77/1232 (6%) |
0.18 |
— |
|||||||||||
Atopic disease‡ |
11/69 (16%) |
121/1232 (10%) |
0.53 |
— |
|||||||||||
Autoimmune disease§ |
7/69 (10%) |
143/1232 (12%) |
0.61 |
— |
|||||||||||
Migraine |
10/69 (14%) |
138/1232 (11%) |
0.82 |
— |
|||||||||||
Proton pump inhibitor use |
8/67 (12%) |
229/1196 (19.2%) |
0.27 |
— |
|||||||||||
Kessler score, mean (SD) |
25.5 (5.9) |
26.0 (6.1) |
0.77 |
— |
|||||||||||
CI = confidence interval; SD = standard deviation. * Area under curve for model, 0.73 (95% CI, 0.67–0.79). † Models generated by multiple logistic regression with backward elimination; odds ratios pertain to final model after elimination of non‐significant variables. ‡ Composite endpoint including animal and pollen allergies. § Composite endpoint including scleroderma, rheumatoid arthritis, and psoriasis. | |||||||||||||||
Box 3 – Multivariate analysis of baseline factors associated with resolution of non‐coeliac wheat sensitivity (SR‐NCWS) between 2015 and 2018*
Characteristic (2015 survey) |
Respondents with resolved SR‐NCWS |
Respondents with unresolved SR‐NCWS |
P |
Odds ratio (95% CI) | |||||||||||
Total number of respondents |
74 |
102 |
|||||||||||||
Age (years), mean (SD), per year |
56.3 (12.5) |
52.7 (12.2) |
0.09 |
— |
|||||||||||
Sex (men) |
25/74 (34%) |
18/102 (18%) |
0.009 |
2.85 (1.35–6.01) |
|||||||||||
Irritable bowel syndrome (Rome III criteria) |
20/74 (27%) |
35/102 (34%) |
0.58 |
— |
|||||||||||
Functional dyspepsia (Rome III criteria) |
13/74 (18%) |
33/102 (32%) |
0.010 |
0.36 (0.16–0.81) |
|||||||||||
Food allergy |
6/74 (8%) |
17/102 (17%) |
0.08 |
— |
|||||||||||
Atopic disease† |
11/74 (15%) |
16/102 (16%) |
0.34 |
— |
|||||||||||
Autoimmune disease‡ |
10/74 (14%) |
15/102 (15%) |
0.79 |
— |
|||||||||||
Migraine |
17/74 (23%) |
16/102 (16%) |
0.15 |
— |
|||||||||||
Proton pump inhibitor use |
17/69 (25%) |
21/101 (21%) |
0.52 |
— |
|||||||||||
Kessler score, mean (SD) |
25.6 (5.6) |
24.3 (5.9) |
0.32 |
— |
|||||||||||
CI = confidence interval; SD = standard deviation. * Area under curve for model, 0.62 (95% CI, 0.54–0.70). † Composite endpoint including animal and pollen allergies. ‡ Composite endpoint including scleroderma, rheumatoid arthritis, and psoriasis. | |||||||||||||||
Box 4 – Symptoms associated with wheat ingestion by the 182 respondents with self‐reported non‐coeliac wheat sensitivity in 2018*
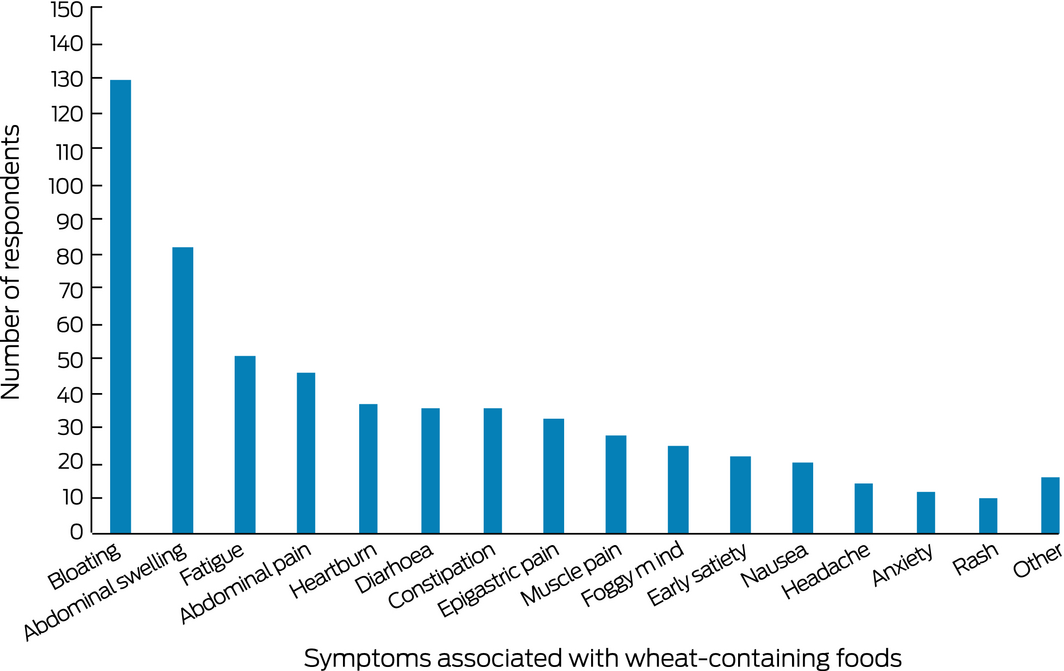
*Respondents could cite more than one symptom.
Box 5 – Reasons for avoiding gluten reported by 316 participants adhering to a gluten‐free diet, by self‐reported non‐coeliac wheat sensitivity status*
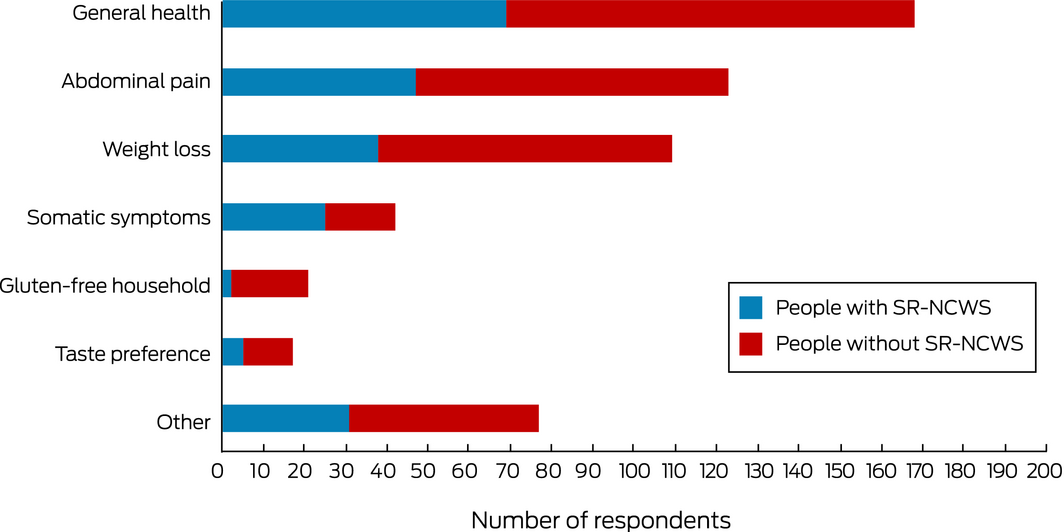
*Respondents could cite more than one reason.
Box 6 – Multivariate analysis of factors associated with avoiding dietary gluten in 2018*
Characteristic (2018 survey) |
Respondents avoiding gluten |
Respondents not avoiding gluten |
P |
Odds ratio (95% CI) | |||||||||||
Total number of respondents |
316 |
988 |
|||||||||||||
Age (years), mean (SD) |
59.6 (12.3) |
62.8 (14.2) |
0.38 |
— |
|||||||||||
Sex (men) |
109/308 (35%) |
514/950 (54%) |
0.10 |
— |
|||||||||||
Self‐reported non‐coeliac wheat sensitivity |
128/314 (41%) |
52/978 (5%) |
< 0.001 |
10.6 (7.31–15.4) |
|||||||||||
Gluten intolerance (doctor diagnosis) |
37/316 (12%) |
2/988 (0.2%) |
< 0.001 |
34 (7.7–150) |
|||||||||||
Irritable bowel syndrome diagnosis |
52/316 (16%) |
82/988 (8%) |
0.036 |
1.62 (1.03–2.53) |
|||||||||||
Functional dyspepsia (Rome III criteria) |
66/316 (21%) |
168/988 (17%) |
0.17 |
— |
|||||||||||
Inflammatory bowel disease |
9/316 (3%) |
17/988 (2%) |
0.11 |
— |
|||||||||||
Food allergy |
47/316 (15%) |
49/988 (5%) |
0.026 |
1.85 (1.08–3.17) |
|||||||||||
Psoriasis |
24/316 (7%) |
53/988 (5%) |
0.87 |
— |
|||||||||||
Migraine |
45/316 (14%) |
91/988 (9%) |
0.63 |
— |
|||||||||||
Gastro‐oesophageal reflux |
97/316 (31%) |
243/988 (25%) |
0.14 |
— |
|||||||||||
Parkinson disease |
1/316 (0.3%) |
7/988 (0.7%) |
0.92 |
— |
|||||||||||
Kessler score, mean (SD) |
25.4 (5.9) |
25.9 (6.1) |
0.46 |
— |
|||||||||||
CI = confidence interval; SD = standard deviation. * Coeliac disease not included in model. Area under curve for model, 0.73 (95% CI, 0.70–0.76). | |||||||||||||||
Received 20 January 2019, accepted 13 August 2019
- Michael DE Potter1,2
- Michael P Jones3
- Marjorie M Walker1
- Natasha A Koloski4,5
- Simon Keely1
- Gerald Holtmann4,5
- Nicholas J Talley AC1,2
- 1 University of Newcastle, Newcastle, NSW
- 2 John Hunter Hospital, Newcastle, NSW
- 3 Macquarie University, Sydney, NSW
- 4 University of Queensland, Brisbane, QLD
- 5 Princess Alexandra Hospital, Brisbane, QLD
This project was partially supported by a grant from Prometheus Laboratories.
No relevant disclosures.
- 1. Anderson RP, Henry MJ, Taylor R, et al. A novel serogenetic approach determines the community prevalence of celiac disease and informs improved diagnostic pathways. BMC Med 2013; 11: 188.
- 2. Chin MW, Mallon DF, Cullen DJ, et al. Screening for coeliac disease using anti‐tissue transglutaminase antibody assays, and prevalence of the disease in an Australian community. Med J Aust 2009; 190: 429–432. https://www.mja.com.au/journal/2009/190/8/screening-coeliac-disease-using-anti-tissue-transglutaminase-antibody-assays-and.
- 3. Walker MM, Ludvigsson JF, Sanders DS. Coeliac disease: review of diagnosis and management. Med J Aust 2017; 207: 173–178. https://www.mja.com.au/journal/2017/207/4/coeliac-disease-review-diagnosis-and-management.
- 4. Fasano A, Catassi C. Celiac disease. N Engl J Med 2012; 367: 2419–2426.
- 5. Potter MDE, Walker MM, Jones MP, et al. Wheat intolerance and chronic gastrointestinal symptoms in an Australian population‐based study: association between wheat sensitivity, celiac disease and functional gastrointestinal disorders. Am J Gastroenterol 2018; 113: 1036–1044.
- 6. Vici G, Belli L, Biondi M, Polzonetti V. Gluten free diet and nutrient deficiencies: a review. Clin Nutr 2016; 35: 1236–1241.
- 7. Zanini B, Mazzoncini E, Lanzarotto F, et al. Impact of gluten‐free diet on cardiovascular risk factors. A retrospective analysis in a large cohort of coeliac patients. Dig Liver Dis 2013; 45: 810–815.
- 8. Tortora R, Capone P, De Stefano G, et al. Metabolic syndrome in patients with coeliac disease on a gluten‐free diet. Aliment Pharmacol Ther 2015; 41: 352–359.
- 9. Potter MDE, Brienesse SC, Walker MM, et al. The effect of the gluten free diet on cardiovascular risk factors in patients with coeliac disease: a systematic review. J Gastroenterol Hepatol 2018; 33: 781–791.
- 10. Biesiekierski JR, Iven J. Non‐coeliac gluten sensitivity: piecing the puzzle together. United European Gastroenterol J 2015; 3: 160–165.
- 11. Molina‐Infante J, Carroccio A. Suspected nonceliac gluten sensitivity confirmed in few patients after gluten challenge in double‐blind, placebo‐controlled trials. Clin Gastroenterol Hepatol 2017; 5: 339–348.
- 12. Catassi C, Elli L, Bonaz B, et al. Diagnosis of non‐celiac gluten sensitivity (NCGS): the Salerno Experts’ Criteria. Nutrients 2015; 7: 4966–4977.
- 13. Potter M, Walker MM, Talley NJ. Non‐coeliac gluten or wheat sensitivity: emerging disease or misdiagnosis? Med J Aust 2017; 207: 211–215. https://www.mja.com.au/journal/2017/207/5/non-coeliac-gluten-or-wheat-sensitivity-emerging-disease-or-misdiagnosis.
- 14. Volta U, Caio G, Karunaratne TB, et al. Non‐coeliac gluten/wheat sensitivity: advances in knowledge and relevant questions. Expert Rev Gastroenterol Hepatol 2017; 11: 9–18.
- 15. Rosinach M, Fernández‐Bañares F, Carrasco A, et al. Double‐blind randomized clinical trial: gluten versus placebo rechallenge in patients with lymphocytic enteritis and suspected celiac disease. PLoS One 2016; 11: e0157879.
- 16. Potter MDE, Walker MM, Keely S, Talley NJ. What's in a name? “Non‐coeliac gluten or wheat sensitivity”: controversies and mechanisms related to wheat and gluten causing gastrointestinal symptoms or disease. Gut 2018; 67: 2073–2077.
- 17. Aziz I. The global phenomenon of self‐reported wheat sensitivity. Am J Gastroenterol 2018; 113: 945–948.
- 18. Palsson OS, Whitehead WE, van Tilburg MAL, et al. Development and validation of the Rome IV Diagnostic Questionnaire for adults. Gastroenterology 2016; 150: 1481–1491.
- 19. Kessler RC, Andrews G, Colpe LJ, et al. Short screening scales to monitor population prevalences and trends in non‐specific psychological distress. Psychol Med 2002; 32: 959–976.
- 20. Dillman DA. Mail and telephone surveys. New York: Wiley Interscience, 1978.
- 21. Lovell RM, Ford AC. Global prevalence of and risk factors for irritable bowel syndrome: a meta‐analysis. Clin Gastroenterol Hepatol 2012; 10:712–721.e4.
- 22. Ford AC, Marwaha A, Sood R, Moayyedi P. Global prevalence of, and risk factors for, uninvestigated dyspepsia: a meta‐analysis. Gut 2015; 64: 1049–1057.
- 23. Hendrie G, Baird D, Golley S, Noakes M. CSIRO Healthy Diet Score 2016. Sept 2016. https://web.archive.org/web/20170925072449/https://www.totalwellbeingdiet.com/media/524038/16-00679_CSIRO-Healthy-Diet-Score-2016_WEB_singlepages.pdf (viewed Oct 2019).
- 24. Choung RS, Unalp‐Arida A, Ruhl CE, et al. Less hidden celiac disease but increased gluten avoidance without a diagnosis in the United States: findings from the National Health and Nutrition Examination Surveys from 2009 to 2014. Mayo Clin Proc 2017; 92: 30–38.
- 25. Nanayakkara WS, Skidmore PM, O'Brien L, et al. Efficacy of the low FODMAP diet for treating irritable bowel syndrome: the evidence to date. Clin Exp Gastroenterol 2016; 9: 131–142.
- 26. Gibson PR, Shepherd SJ. Food choice as a key management strategy for functional gastrointestinal symptoms. Am J Gastroenterol 2012; 107: 657–666.
- 27. Skodje GI, Sarna VK, Minelle IH, et al. Fructan, rather than gluten, induces symptoms in patients with self‐reported non‐celiac gluten sensitivity. Gastroenterology 2017; 154: 529–539.
- 28. Duncanson KR, Talley NJ, Walker MM, Burrows TL. Food and functional dyspepsia: a systematic review. J Hum Nutr Diet 2017; 31: 390–407.
- 29. Elli L, Tomba C, Branchi F, et al. Evidence for the presence of non‐celiac gluten sensitivity in patients with functional gastrointestinal symptoms: results from a multicenter randomized double‐blind placebo‐controlled gluten challenge. Nutrients 2016; 8: 84.
- 30. Talley NJ, Walker MM, Aro P, et al. Non‐ulcer dyspepsia and duodenal eosinophilia: an adult endoscopic population‐based case–control study. Clin Gastroenterol Hepatol 2007; 5: 1175–1183.
- 31. Carroccio A, Mansueto P, Iacono G, et al. Non‐celiac wheat sensitivity diagnosed by double‐blind placebo‐controlled challenge: exploring a new clinical entity. Am J Gastroenterol 2012; 107: 1898–1906.
- 32. Pember SE, Rush SE. Motivation for gluten‐free diet adherence among adults with and without a clinically diagnosed gluten‐related illness. Calif J Health Promot 2016; 14: 68–73.
- 33. Cabrera‐Chávez F, Dezar GV, Islas‐Zamorano AP, et al. Prevalence of self‐reported gluten sensitivity and adherence to a gluten‐free diet in Argentinian adult population. Nutrients 2017; 9: E81.
- 34. Norsa L, Shamir R, Zevit N, et al. Cardiovascular disease risk factor profiles in children with celiac disease on gluten‐free diets. World J Gastroenterol 2013; 19: 5658–5664.
- 35. Barone M, Della Valle N, Rosania R, et al. A comparison of the nutritional status between adult celiac patients on a long‐term, strictly gluten‐free diet and healthy subjects. Eur J Clin Nutr 2016; 70: 23–27.
- 36. Hallert C, Grant C, Grehn S, et al. Evidence of poor vitamin status in coeliac patients on a gluten‐free diet for 10 years. Aliment Pharmacol Ther 2002; 16: 1333–1339.
- 37. Bulka CM, Davis MA, Karagas MR, et al. The unintended consequences of a gluten‐free diet. Epidemiology 2017; 28: e24–e25.
- 38. Lebwohl B, Cao Y, Zong G, et al. Long term gluten consumption in adults without celiac disease and risk of coronary heart disease: prospective cohort study. BMJ 2017; 357: j1892.
Abstract
Objectives: To determine the incidence of self‐reported non‐coeliac wheat sensitivity (SR‐NCWS) and factors associated with its onset and resolution; to describe the prevalence of factors associated with gluten avoidance.
Design: Longitudinal cohort study; analysis of responses to self‐administered validated questionnaires (Digestive Health and Wellbeing surveys, 2015 and 2018).
Setting, participants: Subset of an adult population sample randomly selected in 2015 from the electoral rolls for the Newcastle and Gosford regions of New South Wales.
Main outcome measures: Prevalence of SR‐NCWS (2015, 2018) and incidence and resolution of SR‐NCWS, each by demographic and medical factors; prevalence of gluten avoidance and reasons for gluten avoidance (2018).
Results: 1322 of 2185 eligible participants completed the 2018 survey (response rate, 60.5%). The prevalence of SR‐NCWS was similar in 2015 (13.8%; 95% CI, 12.0–15.8%) and 2018 (13.9%; 95% CI, 12.1–15.9%); 69 of 1301 respondents (5.3%) reported developing new onset (incident) SR‐NCWS between 2015 and 2018 (incidence, 1.8% per year). Incident SR‐NCWS was significantly associated with a diagnosis of functional dyspepsia, and negatively associated with being male or older. Gluten avoidance was reported in 2018 by 24.2% of respondents (20.5% partial, 3.8% complete avoidance); general health was the most frequent reason for avoidance (168 of 316 avoiders, 53%). All 13 participants with coeliac disease, 56 of 138 with irritable bowel syndrome (41%), and 69 of 237 with functional dyspepsia (29%) avoided dietary gluten.
Conclusions: The prevalence of SR‐NCWS was similar in 2015 and 2018. Baseline (2015) and incident SR‐NCWS (2018) were each associated with functional gastrointestinal disorders. The number of people avoiding dietary gluten exceeds that of people with coeliac disease or SR‐NCWS, and general health considerations and abdominal symptoms are the most frequently reported reasons for avoidance.