


The known: Cervical cancer incidence and mortality are higher for Aboriginal and Torres Strait Islander women than for other Australian women. Early in the human papillomavirus (HPV) vaccination program, coverage was lower for Indigenous than non‐Indigenous girls in northern Australia.
The new: First dose coverage was high (> 80%) for both sexes in four jurisdictions in 2015–2016; in New South Wales and Queensland, coverage was similar for Indigenous and non‐Indigenous 12‐year‐olds. HPV vaccination course completion rates were generally lower for Indigenous adolescents.
The implications: High first dose vaccine coverage of Indigenous adolescents is being achieved, and we now need strategies for improving course completion.
Vaccination against human papillomavirus (HPV) is safe and effective.1 A quadrivalent HPV vaccine against HPV types 16 and 18 (which cause 70% of cervical cancers) and types 6 and 11 (which cause most genital warts) was used in Australia from 2007 to 2017 (three doses at 0, 2 and 6 months); in 2018 it was replaced by a nonavalent vaccine (two‐dose schedule). A catch‐up program for females aged 12–26 years (2007–2009) was followed by routine vaccination of girls at 12–13 years of age in a school‐based program. From 2013, boys were also included in the program, with a 2‐year catch‐up for boys up to 15 years of age. The national vaccination coverage achieved has been high: in 2016, 87% (dose 1), 84% (dose 2) and 79% (dose 3) for 15‐year‐old girls, and 81% (dose 1), 79% (dose 2) and 73% (dose 3) for 15‐year‐old boys.2
The incidence of cervical cancer is more than twice as high for Aboriginal and Torres Strait Islander (Indigenous Australian) women as for other Australian women, and the associated mortality is more than three times as high.3 A comprehensive analysis found the cervical screening participation rate in Queensland to be consistently much lower for Indigenous than non‐Indigenous Australian women aged 20–69 years during 2000–2011;4 further, high grade cervical abnormalities were detected more frequently5 and clinical investigation of abnormalities was slower.6 Prior to the HPV vaccination program, the prevalence of HPV types 16 and 18 was similar among Indigenous and non‐Indigenous women,7 consistent with findings that post‐vaccination reductions in the incidence of genital warts and in the prevalence of HPV infections have been similar for Indigenous and non‐Indigenous women.8,9,10
HPV vaccination coverage estimates for Indigenous Australian adolescents have not been published since the initial estimates for the Northern Territory and Queensland, the two jurisdictions with adequate reporting of Indigenous status in 2011.11 First dose uptake was similar for Indigenous and non‐Indigenous girls in Queensland, but the schedule completion rate was lower, while first dose coverage was lower for Indigenous girls in the NT but the completion rate was similar to that for non‐Indigenous girls.11
The National HPV Vaccination Program Register (2008–2018) was legally authorised to record the Indigenous status of vaccine recipients, based on self‐identification as Aboriginal and/or Torres Strait Islander Australians. Reporting of Indigenous status was initially poor, with 50% of notifications with recorded status “unknown” (Box 1). The register worked with state and territory authorities and the Australian Department of Health to identify and overcome barriers to reporting Indigenous status, such as not including Indigenous status fields in school consent forms, failing to report recorded status to the registry, collecting status data in a manner not compliant with the national reporting standard (inadequate response options), not following up incomplete forms, not explaining the reason for recording status to parents, health care staff lacking the confidence, knowledge, or cultural competence to ask vaccine recipients or their parents to identify as Indigenous, and families being worried about disclosing their Indigenous status.12
In this article, we describe the increase in the proportion of HPV vaccine recipients who identified as Indigenous Australians between 2007 and 2017, and report HPV vaccination coverage estimates for children aged 12 from four jurisdictions in which data quality for Indigenous status reporting was adequate in 2015.
Methods
To estimate HPV vaccination coverage, we analysed data from the National HPV Vaccination Program Register on notified valid doses (ie, those complying with minimum spacing intervals) for children aged 12 years in 2015 (data status: 22 November 2018); the registry data were derived from jurisdictional programs and vaccination providers. The numbers of boys and girls aged 12 in each state were estimated from Australian Bureau of Statistics (ABS) estimated residential population data for June 2015.13 Some students who were 12 years old in 2015 were first offered vaccination at age 13 in 2016, depending on their school‐year level of enrolment in the vaccination program. As the ABS does not publish single year jurisdictional population estimates for Indigenous Australians by sex (ie, birth cohort) because of the relatively small population sizes, we used ABS data for state‐level Indigenous estimated residential populations of 12‐year‐old children and applied the sex ratio published by the ABS for 10–14‐year‐old Indigenous children.14
Indigenous status
To determine whether reporting of Indigenous status in a jurisdiction was adequate for our analysis, we assessed three factors for all six Australian states and both mainland territories. First, we compared the proportion of Indigenous adolescents expected if HPV vaccination coverage was similar for Indigenous and non‐Indigenous students with the proportion of Indigenous adolescents derived from ABS population estimates. Second, we interpreted the proportion of vaccine recipients with unknown Indigenous status as a measure of incomplete or inadequate collection and reporting. Third, we compared the proportion of people of unknown Indigenous status with the total population proportion of Indigenous students.
Statistical analysis
For our primary analysis, children identified as Aboriginal, Torres Strait Islander, or both for any notified HPV vaccination dose were classified as Indigenous; if their Indigenous status was unreported or unknown, vaccine recipients were classified as non‐Indigenous. We also conducted two sensitivity analyses: in the first, we assigned children of unknown status to “Indigenous” or “non‐Indigenous” according to the ratio of Indigenous to non‐Indigenous students of known status; in the second, we assumed that all children of unknown status were Indigenous Australians.
Course completion rates were estimated by year of first dose, from 2013 (initial vaccination of boys) to 2016, by sex and Indigenous status. The course completion rate (proportion of children who received dose 1 who also received dose 3) did not depend on the completeness of Indigenous status reporting, as course completion was separately calculated for children who identified as Indigenous or non‐Indigenous, without reference to the total population of children.
Ethics approval
Ethics approval was provided by the NT Department of Health and Menzies School of Health Research Human Research Ethics Committee (reference, HREC 2018‐3227).
Results
HPV vaccination of more than 3.4 million people (at least one dose) was recorded by the Register during 2007–2017. The proportion of HPV vaccine recipients who identified as Indigenous Australians increased from 2.0% in 2007 to 5.0% in 2017 (Box 1).
Completeness of Indigenous status reporting
The data quality of Indigenous status reporting in Queensland, New South Wales, the Australian Capital Territory, and the NT improved during this period (data not shown). By 2015, it was adequate in these four states and territories for estimating HPV vaccination coverage for children by Indigenous status. In three of the four jurisdictions, the proportions of people with unknown Indigenous status were smaller than 5%. In Queensland, a technical problem prevented transfer of Indigenous status data from some of the largest providers during 2012–2015; the problem was ameliorated but not eliminated by retrospectively updating register records if the source record indicated that the student was an Indigenous Australian (Box 2). The completeness of Indigenous status reporting (proportion unknown) and proportion of all notifications received that were identified as from Indigenous Australians in 2015 and 2016 are summarised by jurisdiction in Box 2.
HPV vaccination coverage, by dose
HPV vaccination dose 1 coverage exceeded 80% in all groups (range, 83.3–97.7%). Coverage was similar for Indigenous and non‐Indigenous girls in Queensland, lower for Indigenous girls in the ACT (88.7% v 97.7%) and the NT (91.1% v 97.0%), and higher for Indigenous girls in NSW (95.9% v 89.9%); it was similar for Indigenous and non‐Indigenous boys in all jurisdictions except the NT (88.6% v 96.3%). Dose 3 coverage (range, 61.2–87.7%) was markedly lower for all Indigenous 12‐year‐olds in all jurisdictions, except for girls in NSW (Box 3).
In the first sensitivity analysis, assigning data for children of unknown Indigenous status according to the ratio of Indigenous to non‐Indigenous recipients of known status did not substantially affect coverage estimates, except that in the NT the differences in estimated coverage were smaller. In the second sensitivity analysis, assigning all data from children of unknown status to the Indigenous group increased the estimated coverage for Indigenous children, in some cases to more than 100%, and in most groups coverage was greater than for non‐Indigenous vaccine recipients (Supporting Information, table 1).
Course completion rates
Course completion rates varied between years, and by sex and jurisdiction. Rates were generally higher for non‐Indigenous than Indigenous children, the differences ranging between –0.4 and 14.5 percentage points for girls and between –3.9 and 25.0 percentage points for boys (Box 4).
Discussion
We found that HPV vaccine uptake by Indigenous Australian adolescents is high. Coverage varies between jurisdictions, as do differences in coverage between Indigenous and non‐Indigenous adolescents. It is noteworthy that completeness of reporting of Indigenous status in NSW, the state with the largest population of Indigenous adolescents, is now very high (Box 2). HPV vaccine dose 1 uptake in NSW was higher for Indigenous than for other girls, and the rates for Indigenous and non‐Indigenous boys were similar; coverage was similar for both sexes in Queensland and for boys in all jurisdictions except the NT, and lower for Indigenous girls in both territories. The differences between Indigenous and non‐Indigenous students in the NT (girls, 91% v 97%; boys, 89% v 96%) were similar to those for NT girls in 2007–09 (76% v 83%),11 although the gaps narrowed if we assumed that a proportion of vaccine recipients of unknown Indigenous status were Indigenous Australians. The difference in course completion rates in Queensland did not decline between 2013 and 2016, and is an important challenge for the vaccination program. The poorer completion rates in the ACT may be caused by differences in processes and data completeness for missed doses, as catch‐up doses, which may or may not be notified to the register, are given by general practitioners in this territory rather than in schools; in the NT and Queensland, state immunisation registers routinely captured GP‐administered as well as school doses, and in NSW most catch‐up was undertaken in schools.
In each jurisdiction, estimated HPV vaccination coverage of Indigenous students was much higher than reported in many countries, including the United States, New Zealand and France.1 This high level of coverage is consistent with findings of large falls in the prevalence of HPV and the incidence of genital warts in Indigenous people.8,9,10 The vaccine achieves strong herd protection even at relatively low coverage,15 and the benefits of vaccination were substantially augmented in Australia by the large scale catch‐up program.16 If a single dose of HPV vaccine proves adequate for protection (as some observational data suggest17), effective vaccine coverage is already high (greater than 85% for Indigenous girls and 80% for Indigenous boys in all four jurisdictions). Modelling indicates that sustained coverage exceeding 80% in both sexes will eventually achieve local elimination of vaccine‐targeted HPV types.15
In the NT, HPV vaccine courses have routinely been delivered over a longer time span than elsewhere, particularly to young Indigenous people, whose vaccination status is routinely checked each time they visit a community clinic. This may explain the lower completion rates in 2016 than in 2015 for Indigenous girls and boys in the NT.
The move to the two‐dose HPV vaccination schedule in 2018 may further improve completion rates. However, the wider spacing of doses (dose 2 is given 6–12 months after the first) may be as much a barrier to completion as was the 6‐month span of the three doses of the old program. Logistic barriers to course completion (absence from school, being unaware another dose was needed, forgetting or not having time to make an appointment) are more common in Australia than active withdrawal of consent.18,19 The specific barriers for Indigenous students and their families are unknown, but their rates of school absenteeism are high,20 greater population mobility may make it more difficult to contact parents and guardians,21 and structural barriers, resource limitations, and the lack of culturally appropriate services can generally reduce health care access for Indigenous people.22,23,24 The extent to which barriers to other timely vaccinations, such as socio‐economic disadvantage,25 affect HPV vaccination course completion by Indigenous adolescents is not known.
Limitations
Monitoring HPV vaccination coverage of Indigenous adolescents is challenging because of data‐related problems. The HPV Register did not hold information about unvaccinated individuals, and accurate assignment of Indigenous status relied on the status question being asked and the answer reported. The accuracy of ABS estimated resident population estimates for single year‐of‐age cohorts of Indigenous people stratified by sex, even at state/territory level, is unclear, preventing their routine provision for coverage estimates. Accuracy was further compromised by population movement, changes in Indigenous identification over time, and extrapolation of periodic census estimates to reflect aging of the cohort. Because of their smaller population sizes, the estimates for the NT and ACT will be less robust than for NSW and Queensland, as minor discrepancies will have relatively large effects. Recent census estimates have lowered Indigenous population estimates for the NT. The data presented in this article were the best available under these conditions.
Imperfect identification of Indigenous vaccine recipients in the HPV register would reduce the accuracy of coverage estimates for both Indigenous and non‐Indigenous children: misclassifying an Indigenous child as non‐Indigenous simultaneously inflates the non‐Indigenous coverage estimate (by adding to the numerator but not the denominator) and reduces the Indigenous estimate (by being included in the denominator but not the numerator). We attempted to remedy this by proportionally assigning doses for children of unknown status in a sensitivity analysis, but the results were similar to those of the primary analysis, except in the NT, where there is a small population and high proportion of Indigenous adolescents. Assigning all children of unknown Indigenous status to the Indigenous group clearly overestimated Indigenous vaccination coverage, with some dose 1 estimates exceeding 100%.
The process undertaken in NSW to improve the reporting of Indigenous status is noteworthy, given that HPV vaccination coverage of Indigenous students in four states could not be estimated because of deficiencies in data completeness. In NSW, school program vaccination nurses are empowered to check that the Indigenous status question is completed in the consent form, an approach supported by cultural awareness training.
Conclusion
Although we cannot provide a national picture of HPV vaccination coverage of Indigenous Australian adolescents, our findings indicate there is much to celebrate in terms of high initiation rates. However, further work is required to ensure that vaccination courses are completed. Engagement with Indigenous communities to explore their experiences and understanding of HPV vaccination, and to seek guidance on culturally appropriate strategies for improving coverage, is needed. High quality data and accurate reporting of HPV vaccination coverage rates among Indigenous adolescents are critical for monitoring progress for Indigenous Australians nationally. While reporting of school doses to the HPV Vaccination Program Register was effectively complete, the Australian Immunisation Register, which now also encompasses HPV vaccinations, should better capture doses delivered in general practice. Under the National Immunisation Program, people who missed school doses have an extended opportunity until the age of 19 years for catch‐up vaccination. More complete reporting of doses administered in primary care, including doses provided in Aboriginal Medical Services, may close some of the apparent gaps in completion rates that are based predominantly on school vaccination data. Vaccination against HPV is an important opportunity for reducing the higher incidence of cervical cancer among Indigenous Australian women through primary prevention.
Box 1 – Human papillomavirus (HPV) vaccine recipients, as reported to the National HPV Vaccination Program Register by year of first dose receipt, Australia, 2007–2017, by recorded Indigenous status*
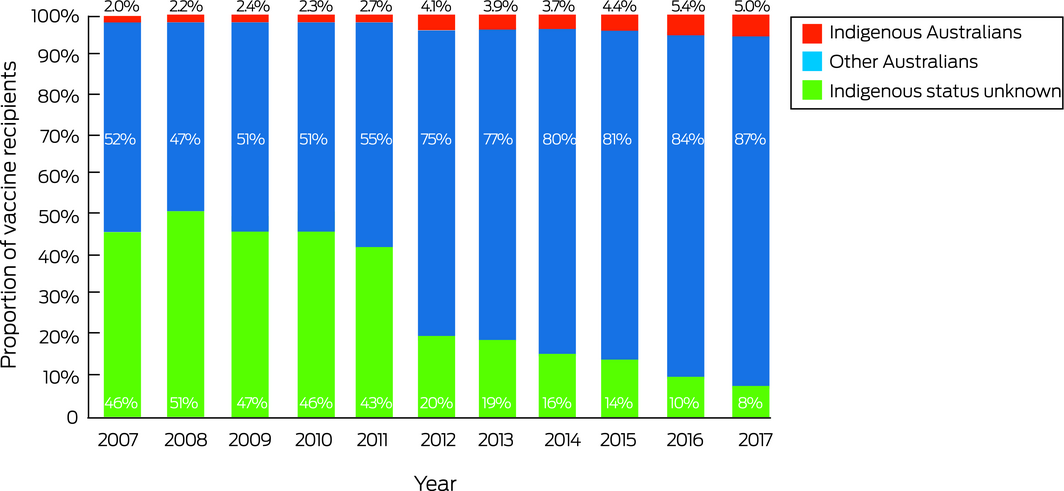
* National HPV Vaccination Program Register data status: 20 November 2018. ◆
Box 2 – Proportion of all human papillomavirus (HPV) vaccination notifications received by the national HPV register in 2015 and 2016,* by jurisdiction and Indigenous status; estimated proportion of Indigenous Australians among 12‐year‐old children
|
|
Australian Capital Territory |
New South Wales |
Northern Territory |
Queensland |
|||||||||||
|
|
|||||||||||||||
|
Estimated proportion of Indigenous Australians among 12‐year‐old children in 201513,14 |
2.9% |
5.3% |
45.2% |
7.7% |
|||||||||||
|
Registry notification data |
|
|
|
|
|||||||||||
|
2015 notifications, by Indigenous status |
|
|
|
|
|||||||||||
|
All Australians |
4683 |
79 046 |
3755 |
36 441 |
|||||||||||
|
Indigenous |
116 (2.5%) |
4406 (5.6%) |
1323 (35.2%) |
2126 (5.8%) |
|||||||||||
|
Not Indigenous |
4435 (94.7%) |
73 989 (93.6%) |
2313 (61.6%) |
18 413 (50.5%) |
|||||||||||
|
Unknown/missing |
132 (2.9%) |
651 (0.8%) |
119 (3.2%) |
15 902 (43.6%)‡ |
|||||||||||
|
2016 notifications, by Indigenous status† |
|
|
|
|
|||||||||||
|
All Australians |
5046 |
80 385 |
3477 |
100 847 |
|||||||||||
|
Indigenous |
142 (2.8%) |
4683 (5.8%) |
1474 (42.4%) |
7524 (7.5%) |
|||||||||||
|
Not Indigenous |
4831 (95.7%) |
75 130 (93.5%) |
1847 (53.1%) |
68 632 (68.0%) |
|||||||||||
|
Unknown/missing |
73 (1.5%) |
572 (0.7%) |
156 (4.5%) |
24 691 (24.5%)‡ |
|||||||||||
|
|
|||||||||||||||
|
* National HPV Vaccination Program Register data status: 22 November 2018. † As some students who were 12 years old in 2015 commenced vaccination at age 13 in 2016, completeness of Indigenous status reporting in 2016 is also important. ‡ Because of a technical problem, some councils did not transfer Indigenous status data, and they were recorded as “missing”. All notifications with the status of “Indigenous Australian” were retrospectively transferred to the register. ◆ |
|||||||||||||||
Box 3 – Human papillomavirus (HPV) vaccination coverage estimates for children aged 12 years in 2015, by sex, dose, jurisdiction and Indigenous status*
|
Estimated HPV vaccination coverage† |
Girls |
Boys |
|||||||||||||
|
Indigenous Australians |
Other Australians |
Indigenous Australians |
Other Australians |
||||||||||||
|
|
|||||||||||||||
|
Australian Capital Territory |
|
|
|
|
|||||||||||
|
Children aged 12 (estimated)‡ |
64 |
2044 |
62 |
2173 |
|||||||||||
|
Number receiving doses 1/2/3 |
57/54/43 |
1996/1954/1788 |
58/56/42 |
2072/1991/1802 |
|||||||||||
|
Proportions receiving doses 1/2/3 |
89%/84%/67% |
97.7%/95.6%/87.5% |
94%/91%/68% |
95.3%/91.6%/82.9% |
|||||||||||
|
New South Wales |
|
|
|
|
|||||||||||
|
Children aged 12 (estimated)‡ |
2354 |
41 532 |
2450 |
44 008 |
|||||||||||
|
Number receiving doses 1/2/3 |
2257/2127/1944 |
37 327/36 439/34 727 |
2097/1967/1779 |
37 841/36 873/35 008 |
|||||||||||
|
Proportions receiving doses 1/2/3 |
95.9%/90.4%/82.6% |
89.9%/87.7%/83.6% |
85.6%/80.3%/72.6% |
86.0%/83.8%/79.5% |
|||||||||||
|
Northern Territory |
|
|
|
|
|||||||||||
|
Children aged 12 (estimated)‡ |
736 |
958 |
798 |
904 |
|||||||||||
|
Number receiving doses 1/2/3 |
671/624/550 |
929/898/840 |
707/603/501 |
871/832/757 |
|||||||||||
|
Proportions receiving doses 1/2/3 |
91.1%/84.7%/74.7% |
97.0%/93.8%/87.7% |
88.6%/75.6%/62.8% |
96.3%/92.0%/83.7% |
|||||||||||
|
Queensland |
|
|
|
|
|||||||||||
|
Children aged 12 (estimated)‡ |
2257 |
26 782 |
2350 |
28 281 |
|||||||||||
|
Number receiving doses 1/2/3 |
1971/1790/1501 |
23 311/22 512/21 006 |
1936/1717/1437 |
28 281/23 557/22 607 |
|||||||||||
|
Proportions receiving doses 1/2/3 |
87.3%/79.3%/66.5% |
87.0%/84.1%/78.4% |
82.4%/73.1%/61.2% |
83.3%/79.9%/73.7% |
|||||||||||
|
|
|||||||||||||||
|
* National HPV Vaccination Program Register data status: 22 November 2018. † Notifications with unknown or missing Indigenous status were assumed to be from non‐Indigenous children. ‡ Based on Australian Bureau of Statistics estimates. The proportions of Indigenous children by sex were estimated with the published proportions for children aged 10–14 years.13,14 ◆ |
|||||||||||||||
Box 4 – Human papillomavirus (HPV) vaccination course completion rates* by juridiction, Indigenous status, and sex for courses initiated during 2013–2016†
|
Year of course initiation |
Girls |
Boys |
|||||||||||||
|
Indigenous Australians |
Non‐Indigenous Australians |
Difference |
Indigenous Australians |
Non‐Indigenous Australians |
Difference |
||||||||||
|
|
|||||||||||||||
|
Australian Capital Territory |
|
|
|
|
|
|
|||||||||
|
2013 |
72% |
85.4% |
13.4% |
74% |
82.4% |
8.3% |
|||||||||
|
2014 |
72% |
86.4% |
13.9% |
59% |
83.9% |
25.0% |
|||||||||
|
2015 |
73% |
87.6% |
14.5% |
76% |
87.5% |
11.5% |
|||||||||
|
2016 |
78% |
86.6% |
8.4% |
60% |
84.1% |
24.4% |
|||||||||
|
New South Wales |
|
|
|
|
|
|
|||||||||
|
2013 |
86.7% |
93.5% |
6.9% |
76.5% |
88.6% |
12.2% |
|||||||||
|
2014 |
87.6% |
93.3% |
5.7% |
77.5% |
87.5% |
10.0% |
|||||||||
|
2015 |
86.1% |
92.9% |
6.8% |
82.4% |
92.6% |
10.2% |
|||||||||
|
2016 |
88.7% |
94.4% |
5.8% |
85.7% |
94.8% |
9.1% |
|||||||||
|
Northern Territory |
|
|
|
|
|
|
|||||||||
|
2013 |
88.8% |
88.4% |
–0.4% |
86.4% |
89.6% |
3.2% |
|||||||||
|
2014 |
88.5% |
91.7% |
3.2% |
81.4% |
90.5% |
9.0% |
|||||||||
|
2015 |
81.8% |
84.7% |
2.9% |
75.4% |
71.4% |
–3.9% |
|||||||||
|
2016 |
70.9% |
81.6% |
10.7% |
60.5% |
79.0% |
18.5% |
|||||||||
|
Queensland |
|
|
|
|
|
|
|||||||||
|
2013 |
79.6% |
90.1% |
10.6% |
77.5% |
87.4% |
9.8% |
|||||||||
|
2014 |
78.3% |
91.1% |
12.8% |
76.5% |
88.7% |
12.2% |
|||||||||
|
2015 |
81.9% |
90.4% |
8.6% |
79.7% |
89.4% |
9.7% |
|||||||||
|
2016 |
79.9% |
90.5% |
10.6% |
79.8% |
89.4% |
9.7% |
|||||||||
|
|
|||||||||||||||
|
* Proportions of people who received dose 3 as a proportion of those who received dose 1. Absolute numbers are reported in Supporting Information, table 2. † National HPV Vaccination Program Register data status: 22 November 2018. ◆ |
|||||||||||||||
Received 21 August 2018, accepted 18 March 2019

Abstract
Objective: To estimate human papillomavirus (HPV) vaccination coverage and course completion rates for Indigenous adolescents in four Australian states and territories.
Participants, setting: Adolescents who were 12 years old in 2015 and received the quadrivalent HPV vaccine (three doses: 0, 2, 6 months) as part of the National HPV Vaccination Program in 2015 or 2016 in New South Wales, Queensland, the Northern Territory, or the Australian Capital Territory.
Main outcome measures: Estimated HPV vaccination coverage by dose and by Indigenous status and sex, based on National HPV Vaccination Program Register data; vaccination course completion rates (proportion of dose 1 recipients who received dose 3) for 12‐year‐olds vaccinated during 2013–2016, by sex, jurisdiction, and Indigenous status.
Results: Dose 1 coverage exceeded 80% for all Indigenous status/jurisdiction/sex groups (range, 83.3–97.7%). Coverage was similar for Indigenous and non‐Indigenous girls in Queensland (87.3% v 87.0%), lower for Indigenous girls in the ACT (88.7% v 97.7%) and the NT (91.1% v 97.0%), and higher in NSW (95.9% v 89.9%); it was similar for Indigenous and non‐Indigenous boys in all jurisdictions except the NT (88.6% v 96.3%). Dose 3 coverage (range, 61.2–87.7%) was markedly lower for Indigenous than non‐Indigenous 12‐year‐olds in all jurisdictions, except for girls in NSW (82.6% v 83.6%).
Conclusion: HPV vaccine coverage is high, but course completion is generally lower for Indigenous adolescents. Strategies for improving completion rates for Indigenous Australians are needed to end the higher burden of cervical cancer among Indigenous than non‐Indigenous women.