


The known The Australian HPV vaccination program has led to significant declines in a number of HPV-related conditions, including diagnoses of genital warts in young women and heterosexual men at sexual health clinics.
The new We found marked declines in the proportions of young Indigenous women and men attending sexual health clinics for the first time who were diagnosed with genital warts following introduction of the HPV vaccination program, similar to declines among non-Indigenous young women and men.
The implications Sustained high HPV vaccine coverage rates and monitoring are needed to close the gap between Indigenous and non-Indigenous Australians in the rates of cervical and other HPV-related cancers in older women.
The Australian national human papillomavirus (HPV) vaccination program commenced in April 2007. Free vaccination was provided to 12–13-year-old girls in schools; this was supplemented by a 3-year catch-up program for 13–18-year-old girls in schools and for 18–26-year-old women through family doctors in July 2007.1 In 2013, boys were added to the program, providing free HPV vaccination to 12–13-year-old boys in schools and, for 2 years, a catch-up program for 14–15-year-old boys. Australia uses the quadrivalent HPV vaccine (Gardasil), protecting against HPV types 6 and 11, which cause ano-genital warts, and HPV types 16 and 18, which cause cancer.2,3
The Australian HPV vaccination program has had very promising results. High coverage rates among vaccine-eligible girls have been achieved, 73% receiving all three doses in 2010.4 Significant reductions in the prevalence of HPV-related conditions have been seen; diagnoses of genital warts in young women and heterosexual men at sexual health clinics,5,6 inpatient treatment of genital warts at private hospitals,7 hospital admissions for genital warts,8 the prevalence in young women of HPV types targeted by the quadrivalent vaccine,9,10 and the incidence of high grade cervical abnormalities11 have all declined.
Measuring the impact of the HPV vaccination program in Aboriginal and/or Torres Strait Islander (Indigenous) people is important because cervical cancer rates among Indigenous women are twice as high as among non-Indigenous women.12 Similar findings have been reported overseas; a meta-analysis of data from 35 studies found that indigenous women had elevated risks of invasive cervical cancer and related mortality (pooled risk ratios, 1.72 and 3.45 respectively).13 Indigenous Australians experience poorer outcomes than non-Indigenous people for a range of conditions,14 including some sexually transmissible infections (STIs).15-17 In response to these inequities, the Australian Government initiated the Closing the Gap program in 2008,18 followed in 2014 by the Fourth National Aboriginal and Torres Strait Islander Blood-borne Viruses and STI Strategy, 2014–2017, which includes the aim of achieving high rates of HPV vaccination.19
Despite their disproportionately high rates of cervical cancer, there is a lack of information on HPV vaccination and its impact, including on the prevalence of genital warts, in indigenous populations around the world. A recent systematic review20 did not find any studies that reported the effect of HPV vaccination programs in indigenous populations. The aim of our study was therefore to examine the effect of the HPV vaccination program on diagnoses of genital warts in Indigenous Australians, and to compare this with data for non-Indigenous Australians.
Methods
Routinely collected de-identified data were collated from 39 clinics in the Genital Warts Surveillance Network (http://kirby.unsw.edu.au/projects/genital-warts-surveillance-network). The network, including 47% of all sexual health clinics in Australia, was established in 2008 to measure the effects of the Australian HPV vaccination program on the prevalence of genital warts. The participating clinics, all of which have computerised medical records systems, are the largest such clinics by patient volume, accounting for more than 90% of all sexual health clinic consultations in Australia. Patient demographic and behavioural data (age, sex, Indigenous status, country of birth, sex of their sexual partners) and data on the clinical diagnosis of genital warts were collated.
Data analysis
Australian-born patients who attended one of the clinics for the first time between January 2004 and December 2014 were included in the study. Analysis was restricted to Australian-born patients because the HPV vaccine is available free of charge only to Australian permanent residents and citizens (residency status is not routinely collected at clinics), and to first visits to exclude patients with recurrent genital warts diagnoses. Patients of unknown Indigenous status were excluded. Men who reported having sex only with men or with both men and women in the past 12 months were classified as men who have sex with men (MSM), and men who reported having sex only with women as heterosexual.
The study period was divided into a pre-vaccination period (2004–2007) and a vaccination period (2008–2014). All data from 2007 were included in the pre-vaccination period. The proportion of patients diagnosed with genital warts was calculated by dividing the number of new diagnoses by the number of patients seen, and the relative percentage change in proportion over time was calculated.
The pattern of change in diagnoses was described using univariate Poisson regression models, with the number of diagnoses as the outcome and the calendar year as the independent variable. Results are presented as average annual trends (average annual proportional change in rates; eg, for 10% average increase, average annual trend = 1.10). Models were separately fitted for the pre-vaccination and vaccination periods; the pre-vaccination period was assessed to identify any changes related to factors other than vaccination. Model fit was assessed in Pearson χ2 tests and by visually comparing it with the observed proportions (online Appendix, figures 1–3).
The average difference between the pre-vaccination and vaccination periods in the proportions of patients diagnosed with genital warts was analysed in univariate Poisson models, with the number of diagnoses as the outcome and the vaccination period as the binary independent variable. Results are presented as summary rate ratios (SRRs).
The magnitude of the difference between Indigenous and non-Indigenous people in rate change was quantified in a bivariate Poisson model, using the number of diagnoses as the outcome, including an interaction term for Indigenous status and year. Results are presented as the ratio of the SRRs for diagnoses in non-Indigenous and Indigenous people to account for potential differences in patient numbers by vaccination period for each group.
A sensitivity analysis that excluded the 2007 data was conducted with the same methods to allow a wash-in period for the intervention. Results were qualitatively compared with those of the primary analyses to assess any reduction in the proportion of diagnoses during 2007 associated with vaccinations during the second half of 2007.
Analyses for three age groups were conducted: people under 21 (all women in this age group were eligible to receive free HPV vaccination, but boys aged 12–15 years were only eligible to receive it from early 2013), people aged 21–30 years (most women in this age group were eligible to receive free HPV vaccination, and all women by the end of the study period), and those over 30 (few women in this age group were eligible to receive free HPV vaccination). No men over 21 had been eligible for free vaccination at any time. Analyses for MSM were not stratified by age because of the small number of observations.
All analyses were conducted in Stata 13.1 (StataCorp).
Ethics approval
Ethics approval for the study was provided by the Aboriginal Health and Medical Research Council (reference, 1099/15), the St Vincent’s Hospital Sydney Human Research Ethics Committee (reference, 08/051), by the state-based human research ethics committees, and by the governance offices overseeing each participating clinic.
Results
A total of 220 761 Australian-born patients were seen at the participating sexual health clinics for the first time between 2004 and 2014. 5162 records (2.3%) were excluded because information on Indigenous status was missing; of the remaining 215 599 patients, 15 638 (7.3%) identified themselves as Indigenous and 91 689 (42.5%) were women. The median age of the 215 599 patients was 27 years (interquartile range [IQR], 21–36 years); the median age of the Indigenous patients was 22 years (IQR, 18–32 years).
Women
The rates of diagnosis of genital warts were consistently lower for Indigenous women than non-Indigenous women in each age group (Box 1; online Appendix, table 1).
Average annual trend
There was no trend in annual diagnosis rates for the pre-vaccination period. During the vaccination period, the annual diagnosis rate declined for both Aboriginal and non-Aboriginal women aged 30 years or less, but not for women over 30 (Box 2).
Vaccination v pre-vaccination periods
The average annual rates of diagnosis declined significantly between the pre-vaccination and vaccination periods for both Indigenous (SRR for Indigenous women under 21, 0.12; 95% confidence interval [CI], 0.07–0.21; P < 0.001; for 21–30-year-old women, 0.41; 95% CI, 0.27–0.61 P < 0.001) and non-Indigenous women under 30 years of age (SRR for non-Indigenous women under 21, 0.21; 95% CI, 0.19–0.24; P < 0.001; for 21–30-year-old women, 0.43; 95% CI, 0.40–0.46; P < 0.001) (Box 2).
Ratio of SRRs
The reduction in the proportion of clinic patients diagnosed with genital warts associated with the vaccination period was similar for Indigenous and non-Indigenous women, and the fall was significantly greater only for Indigenous women under 21 (SRR ratio, 1.72; 95% CI, 1.72–2.91; P = 0.043) (Box 2).
Heterosexual men
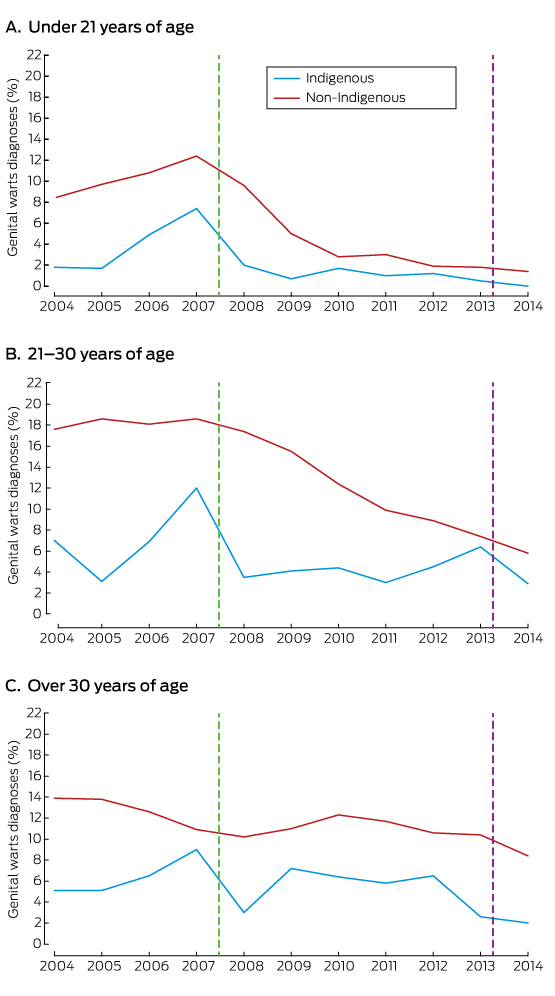
The rates of diagnosis of genital warts were consistently lower for Indigenous men than Australian-born non-Indigenous men in each age group (Box 3; online Appendix, table 2).
Average annual trend
There was an increase in annual diagnosis rates during the pre-vaccination period for both Indigenous and non-Indigenous men under 21 (each P < 0.05), but no statistically significant change for those aged 21–30 years, nor for Indigenous men over 30. There was, however, a decline in rate for non-Indigenous men over 30 during this period (P = 0.001). During the vaccination period, there was no change in diagnosis rates among younger Indigenous men but a decline in those over 30 (P = 0.04). There was a decline in diagnosis rates among all non-Indigenous men, with the greatest decline among those under 21 (P < 0.001) (Box 2).
Vaccination v pre-vaccination periods
The average annual rates of diagnosis were statistically significantly lower during the vaccination period than the pre-vaccination period for younger Indigenous men (SRR for Indigenous men under 21, 0.25; 95% CI, 0.12–0.49; P < 0.001; for 21–30-year-old men, 0.56; 95% CI, 0.35–0.90; P = 0.016), but not for those over 30; the reductions were significantly lower for all non-Indigenous men (SRR for non-Indigenous men under 21, 0.33; 95% CI, 0.28–0.39; P < 0.001; for 21–30-year-old men, 0.60; 95% CI, 0.56–0.63; P < 0.001; for those over 30, 0.83; 95% CI, 0.78–0.89; P < 0.001) (Box 2).
Ratio of SRRs
The level of change in the proportion of clinic patients diagnosed with genital warts associated with the vaccination period was similar for Indigenous and non-Indigenous men in all age groups (Box 2).
Men who have sex with men
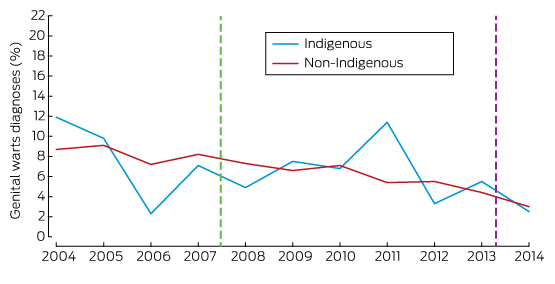
The rates of diagnosis of genital warts were similar for Indigenous and non-Indigenous MSM (Box 4; online Appendix, table 3).
Average annual trends
There was no trend in the diagnosis rates for Indigenous or non-Indigenous MSM during the pre-vaccination period. Similar reductions in rate were measured in both groups during the vaccination period, but the change was not statistically significant for Indigenous MSM (Box 2).
Vaccination v pre-vaccination periods
There was no significant change in the average annual rate of diagnosis for Indigenous MSM (SRR, 0.74; 95% CI, 0.40–1.36; P = 0.33), but the rate declined significantly among non-Indigenous MSM (SRR, 0.64; 95% CI, 0.59–0.70; P < 0.001) (Box 2).
Ratio of SRRs
The reduction in the proportion of MSM diagnosed with genital warts associated with the vaccination period was not significantly different for Indigenous and non-Indigenous men (Box 2).
Sensitivity analysis
The results of the sensitivity analysis were qualitatively similar to those of the primary analysis. Trend results were attenuated by the reduced time frame and need to be interpreted with caution, but there was no significant downward trend in rate during the pre-vaccination period. SRRs were similar to those in the primary analysis, but were influenced slightly by the reduced time frame (online Appendix, tables 4 and 5).
Discussion
We found that there have been marked declines since the introduction of the national HPV vaccination program in the proportions of Indigenous and non-Indigenous women under 21 attending sexual health clinics for the first time who are diagnosed with genital warts. The decline for Indigenous women under 21 was higher than for non-Indigenous women of the same age. Marked decreases were also found for young Indigenous heterosexual men and non-Indigenous heterosexual men of all ages. The decline in heterosexual men is probably due to herd protection, as it is too early to expect any substantial direct effect of the vaccination of boys. The declines in the proportions of diagnoses in older Indigenous men were not statistically significant, probably because of the small number of patients in this group (online Appendix, table 2).
The reductions in the proportions of Indigenous and non-Indigenous young people attending sexual health clinics diagnosed with genital warts are remarkable; in recent times, very few interventions have achieved such dramatic declines in an STI, with the exception of donovanosis.16 While the number of genital warts diagnoses has been declining since 2007, those of chlamydia has been increasing. Data from the Australian Collaboration of Coordinated Enhanced Sentinel Surveillance study, which includes the same clinics as our study, reported that the proportion of Indigenous women attending these clinics who were chlamydia-positive had risen from 14.4% in 2006 to 19.8% in 2011 (for trend, P = 0.01); the rate in young Indigenous men was stable (2006, 15.8%; 2011, 16.2%; P = 0.23).21
We found no significant difference between the rates of decline in genital wart diagnoses in Indigenous and non-Indigenous women — except among those under 21, for whom the decline was greater among Indigenous women — nor between those for Indigenous and non-Indigenous heterosexual men or MSM. In contrast, data from the HPV vaccination catch-up program for Indigenous women in Queensland and Northern Territory indicated that coverage rates were lower among Indigenous women than non-Indigenous women in Queensland, particularly for the third dose; in the Northern Territory in 2011, however, completion rates for the three doses were similar for the two populations.22 The clinics included in our study included only a subset of Indigenous people in each state and territory, so it is possible that some differences may have been masked.
The proportion of MSM diagnosed with genital warts declined significantly among non-Indigenous but not among Indigenous patients. MSM presumably do not benefit from the herd protection achieved by the HPV vaccination program, and the decline in the diagnosis rate among non-Indigenous MSM is probably explained by the increasing number of MSM seen at sexual health clinics in the past decade (Appendix, table 3). MSM have been encouraged to attend sexual health clinics more frequently for asymptomatic screening, whereas asymptomatic Indigenous men have always been a priority population.23
This study has several strengths. First, it is the first to examine trends in the diagnoses of genital warts in Indigenous people attending sexual health clinics. Second, these data come from a national surveillance network with wide geographic coverage. Third, retrospective data were available, so we could compare the number of diagnoses of genital warts during the vaccination and pre-vaccination periods. There are three main limitations to our study. First, it was an ecological study, and the falls in the proportions of clinic patients diagnosed with genital warts cannot be directly attributed to the HPV vaccination program. However, the sudden fall in diagnosis rates after its commencement and the dose–response relationship (that is, the number of diagnoses of genital warts fell as the number of people vaccinated increased) support a causal association. Second, the Indigenous patients included in our study are not representative of all Indigenous people because sexual health clinics see patients who are at higher risk of STIs than the general population;24 for some states a smaller proportion of Indigenous people was included, so that there may be local differences; and many Indigenous people receive health care from the Aboriginal and Community Controlled Health Services and other primary health services.25 Third, the numbers of patients in some groups were small, so that the 95% CIs for trends and SRRs were wide.
Current levels of HPV vaccination coverage among young Indigenous Australians of vaccine-eligible age are providing them with the same benefit as non-Indigenous Australians, closing the gap with respect to genital warts in young women. Older Indigenous women still have disproportionately high rates of cervical pathology and cancer, so that cervical cancer screening coverage for these women should be increased. Sustaining high HPV vaccination rates and monitoring coverage in Indigenous communities should also close the gap for cervical and other HPV-related cancers.
Box 1 – Proportion of Indigenous and non-Indigenous Australian-born women diagnosed with genital warts at first visit to a sexual health clinic, 2004–2014*
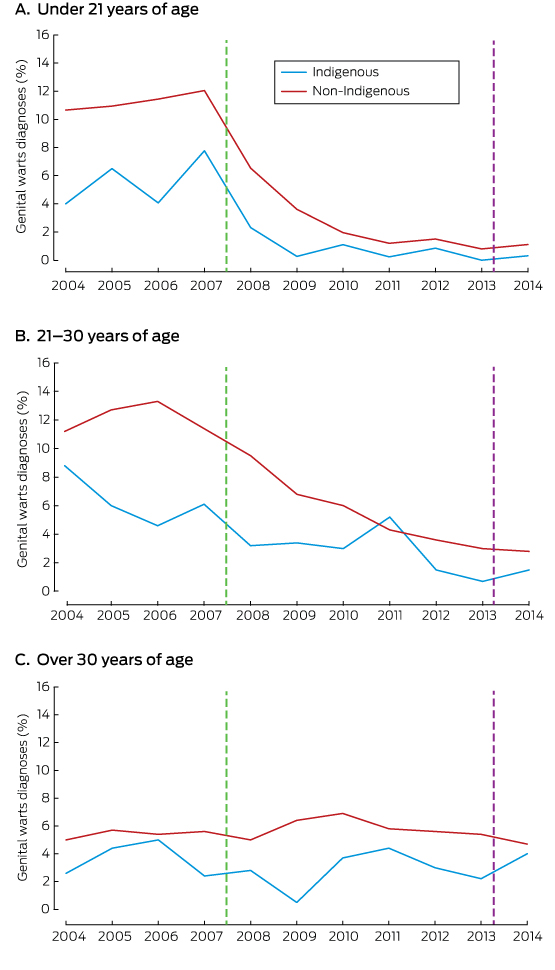
* The vertical lines indicate the start of the HPV vaccination programs for girls (2007) and boys (2013).
Box 2 – Average annual trends in the diagnosis of genital warts at 39 Australian sexual health clinics, with summary rate ratios (SRRs), 2004–2014
|
Sex |
Age (years) |
Indigenous status |
Pre-vaccination period (2004–2007) |
Vaccination period (2008–2014) |
Vaccination v pre-vaccination |
SRR ratio, non-Indigenous v Indigenous patients‡ |
P |
||||||||
|
Average annual trend (95% CI)* |
P |
Average annual trend (95% CI)* |
P |
SRR (95% CI)† |
P |
||||||||||
|
|
|||||||||||||||
|
Women |
12–20 |
Indigenous |
1.18 (0.93–1.49) |
0.16 |
0.69 (0.52–0.92) |
0.010 |
0.12 (0.07–0.21) |
< 0.001 |
|
|
|||||
|
|
|
non-Indigenous |
1.04 (0.99–1.1) |
0.14 |
0.69 (0.64–0.74) |
< 0.001 |
0.21 (0.19–0.24) |
< 0.001 |
1.72 (1.02–2.91) |
0.043 |
|||||
|
|
21–30 |
Indigenous |
0.87 (0.66–1.13) |
0.30 |
0.84 (0.73–0.96) |
0.010 |
0.41 (0.27–0.61) |
< 0.001 |
|
|
|||||
|
|
|
non-Indigenous |
1.01 (0.98–1.05) |
0.45 |
0.80 (0.78–0.83) |
< 0.001 |
0.43 (0.40–0.46) |
< 0.001 |
1.05 (0.69–1.59) |
0.83 |
|||||
|
|
> 30 |
Indigenous |
1.01 (0.75–1.37) |
0.94 |
1.07 (0.93–1.24) |
0.33 |
0.84 (0.51–1.36) |
0.47 |
|
|
|||||
|
|
|
non-Indigenous |
1.03 (0.96–1.10) |
0.40 |
0.98 (0.95–1.01) |
0.14 |
1.05 (0.94–1.16) |
0.39 |
1.25 (0.76–2.06) |
0.38 |
|||||
|
Men |
12–20 |
Indigenous |
1.73 (1.10–2.71) |
0.017 |
0.78 (0.61–1.01) |
0.057 |
0.25 (0.12–0.49) |
< 0.001 |
|
|
|||||
|
|
|
non-Indigenous |
1.14 (1.02–1.26) |
0.019 |
0.71 (0.66–0.77) |
< 0.001 |
0.33 (0.28–0.39) |
< 0.001 |
1.34 (0.66–2.74) |
0.42 |
|||||
|
|
21–30 |
Indigenous |
1.33 (0.92–1.94) |
0.13 |
1.02 (0.88–1.18) |
0.80 |
0.56 (0.35–0.90) |
0.016 |
|
|
|||||
|
|
|
non-Indigenous |
1.01 (0.98–1.05) |
0.47 |
0.83 (0.82–0.85) |
< 0.001 |
0.60 (0.56–0.63) |
< 0.001 |
1.06 (0.66–1.69) |
0.82 |
|||||
|
|
> 30 |
Indigenous |
1.22 (0.86–1.74) |
0.26 |
0.88 (0.78–0.99) |
0.040 |
0.67 (0.42–1.08) |
0.10 |
|
|
|||||
|
|
|
non-Indigenous |
0.93 (0.89–0.97) |
0.001 |
0.97 (0.95–0.99) |
0.008 |
0.83 (0.78–0.89) |
< 0.001 |
1.24 (0.77–2.01) |
0.38 |
|||||
|
MSM |
All |
Indigenous |
0.77 (0.48–1.24) |
0.28 |
0.88 (0.75–1.02) |
0.09 |
0.74 (0.40–1.36) |
0.33 |
|
|
|||||
|
|
|
non-Indigenous |
0.96 (0.90–1.02) |
0.205 |
0.88 (0.85–0.90) |
< 0.001 |
0.64 (0.59–0.70) |
< 0.001 |
0.87 (0.47–1.61) |
0.66 |
|||||
|
|
|||||||||||||||
|
MSM = men who have sex with men; SRR = summary rate ratio. * Average annual change in notification rate, based on univariate Poisson models with diagnoses as dependent variable and calendar year as independent variable. † Vaccination v pre-vaccination period SRR, based on univariate Poisson models with diagnoses as dependent variable and vaccination period as independent variable. ‡ Ratio of SRRs, based on Poisson models with diagnoses as dependent variable and with Indigenous status and vaccination period and associated interaction term as independent variables. Results may differ when calculated directly from table SRRs because of rounding. |
|||||||||||||||
Received 19 May 2016, accepted 15 November 2016
- Hammad Ali1
- Hamish McManus1
- Catherine C O'Connor2
- Denton Callander1
- Marlene Kong1
- Simon Graham3
- Dina Saulo1
- Christopher K Fairley4
- David G Regan1
- Andrew Grulich1
- Nicola Low5
- Rebecca J Guy1
- Basil Donovan1
- 1 The Kirby Institute, University of New South Wales, Sydney, NSW
- 2 Sexual Health Service, Sydney Local Health District, Sydney, NSW
- 3 University of Melbourne, Melbourne, VIC
- 4 Melbourne Sexual Health Centre, Alfred Hospital, Melbourne, VIC
- 5 Institute of Social and Preventive Medicine, Universität Bern, Bern, Switzerland
The Genital Warts Surveillance Network receives funding from Seqirus (formerly bioCSL) and the Australian Department of Health. Hammad Ali, Rebecca Guy and Basil Donovan are supported by National Health and Medical Research Council fellowships. Simon Graham is supported by a McKenzie Postdoctoral Fellowship and by the Melbourne Poche Centre for Indigenous Health at the University of Melbourne. We acknowledge the staff members of the clinics that provided data for this study. Site investigators for Genital Warts Surveillance Network clinics include: Eva Jackson (Nepean and Blue Mountains Sexual Health and HIV Clinics), Darren Russell (Cairns Sexual Health Clinic), Emanuel Vhalkis (Coffs Harbour and Grafton Sexual Health Clinics), Manoji Gunathilake (Clinic 34, Alice Springs and Darwin), Alison Nikitas (Murrumbidgee and Southern NSW Sexual Health Services), Maree O’Sullivan (Gold Coast Sexual Health Service), Debbie Allen (Hold Street Clinic), Nathan Ryder (Hunter New England Sexual Health Clinics), Katherine Brown (Illawarra and Shoalhaven Sexual Health Clinics), David Smith (Lismore and Tweed Heads Sexual Health Services), Yoges Paramsothy (Liverpool and Campbelltown Sexual Health Clinics), Christopher Fairley (Melbourne Sexual Health Centre), Cheryn Palmer (Princess Alexandra Hospital Sexual Health Clinic), Stephen Davies (Clinic 16, Royal North Shore Hospital), Catherine C. O’Connor (RPA Sexual Health Clinic), Anna McNulty (Sydney Sexual Health Centre), Arun Menon (Townsville Sexual Health Services), and David Lewis (Western Sydney Sexual Health Centre).
Christopher Fairley owns shares in CSL Pty Ltd. Basil Donovan, Christopher Fairley, David Regan, Hammad Ali, Andrew Grulich and Rebecca Guy currently receive research funding and have previously received honoraria from CSL Biotherapies. Basil Donovan and Rebecca Guy have received honoraria from Sanofi Pasteur MSD. Basil Donovan, Christopher Fairley and AEG have received honoraria from Merck. Andrew Grulich sits on the Australian advisory board for the Gardasil vaccine.
- 1. Garland SM, Skinner SR, Brotherton JML. Adolescent and young adult HPV vaccination in Australia: achievements and challenges. Prev Med 2011; 53: S29-S35.
- 2. Forster AS, Marlow LAV, Wardle J, et al. Interest in having HPV vaccination among adolescent boys in England. Vaccine 2012; 30: 4505-4510.
- 3. Olsson SE, Villa LL, Costa RLR, et al. Induction of immune memory following administration of a prophylactic quadrivalent human papillomavirus (HPV) types 6/11/16/18 L1 virus-like particle (VLP) vaccine. Vaccine 2007; 25: 4931-4939.
- 4. Gertig DM, Brotherton JML, Saville M. Measuring human papillomavirus (HPV) vaccination coverage and the role of the National HPV Vaccination Program Register, Australia. Sex Health 2011; 8: 171-178.
- 5. Ali H, Donovan B, Wand H, et al. Genital warts in young Australians five years into national human papillomavirus vaccination programme: national surveillance data. BMJ 2013; 346: f2032.
- 6. Read TRH, Hocking JS, Chen MY, et al. The near disappearance of genital warts in young women 4 years after commencing a national human papillomavirus (HPV) vaccination programme. Sex Transm Infect 2011; 87: 544-547.
- 7. Ali H, Guy RJ, Wand H, et al. Decline in in-patient treatments of genital warts among young Australians following the national HPV vaccination program. BMC Infect Dis 2013; 13: 1-6.
- 8. Smith MA, Liu B, McIntyre P, et al. Fall in genital warts diagnoses in the general and Indigenous Australian population following implementation of a national human papillomavirus vaccination program: analysis of routinely collected national hospital data. J Infect Dis 2014; 211: 91-99.
- 9. Tabrizi SN, Brotherton JM, Kaldor JM, et al. Fall in human papillomavirus prevalence following a national vaccination program. J Infect Dis 2012; 206: 1645-1651.
- 10. Chow EP, Danielewski JA, Fehler G, et al. Human papillomavirus in young women with Chlamydia trachomatis infection 7 years after the Australian human papillomavirus vaccination programme: a cross-sectional study. Lancet Infect Dis 2015; 15: 1314-1323.
- 11. Brotherton JML, Fridman M, May CL, et al. Early effect of the HPV vaccination programme on cervical abnormalities in Victoria, Australia: an ecological study. Lancet 2011; 377: 2085-2092.
- 12. Whop LJ, Baade P, Garvey G, et al. Cervical abnormalities are more common among Indigenous than other Australian women: a retrospective record-linkage study, 2000–2011. PLoS One 2016; 11: 1-12.
- 13. Vasilevska M, Ross SA, Gesink D, et al. Relative risk of cervical cancer in indigenous women in Australia, Canada, New Zealand, and the United States: a systematic review and meta-analysis. J Pub Health Pol 2012; 33: 148-164.
- 14. Australian Institute of Health and Welfare. The health and welfare of Australia’s Aboriginal and Torres Strait Islander peoples (AIHW Cat. No. IHW 42). Canberra: AIHW, 2011.
- 15. O’Connor C, Ali H, Guy R, et al. High chlamydia positivity rates In Indigenous people attending Australian sexual health services. Med J Aust 2014; 200: 595-598. <MJA full text>
- 16. The Kirby Institute. HIV, viral hepatitis and sexually transmissible infections in Australia: annual surveillance report 2015. Sydney: The Kirby Institute, UNSW Australia, 2015. http://kirby.unsw.edu.au/sites/default/files/hiv/resources/2015%20Annual%20Surveillance%20Report%20of%20HIV%2C%20viral%20hepatitis%2C%20STIs.pdf (accessed Jan 2017).
- 17. The Kirby Institute. Bloodborne viral and sexually transmissible infections in Aboriginal and Torres Strait Islander people: annual surveillance report 2015. Sydney: The Kirby Institute, UNSW Australia, 2015. http://kirby.unsw.edu.au/sites/default/files/hiv/resources/2015%20Aboriginal%20Surveillance%20Report%20of%20HIV%2C%20viral%20hepatitis%2C%20STIs.pdf (accessed Jan 2017).
- 18. Australian Government, Department of the Prime Minister and Cabinet. Closing the Gap. Prime Minister’s report 2016. Canberra: Department of the Prime Minister and Cabinet, 2016. http://closingthegap.dpmc.gov.au/assets/pdfs/closing_the_gap_report_2016.pdf (accessed Jan 2017).
- 19. Australian Government, Department of Health. Fourth National Aboriginal and Torres Strait Islander blood-borne viruses and sexually transmissible infections strategy, 2014–2017. Canberra: Department of Health, 2014. https://health.gov.au/internet/main/publishing.nsf/Content/4CBA8EFCE045DFA9CA257BF00020A9D0/$File/ATSI-BBV-STI-Strategy2014-v3.pdf (accessed Jan 2017).
- 20. Drolet M, Bénard É, Boily M-C, et al. Population-level impact and herd effects following human papillomavirus vaccination programmes: a systematic review and meta-analysis. Lancet Infect Dis 2015; 15: 565-580.
- 21. Ali H, Guy RJ, Fairley CK, et al. Understanding trends in genital Chlamydia trachomatis can benefit from enhanced surveillance: findings from Australia. Sex Transm Infect 2012; 88: 552-557.
- 22. Brotherton J, Murray SL, Hall MA, et al. Human papillomavirus vaccine coverage among female Australian adolescents: success of the school-based approach. Med J Aust 2013; 199: 614-617. <MJA full text>
- 23. Ali H, Donovan B, Fairley CK, et al. Increasing access by priority populations to Australian sexual health clinics. Sex Transm Dis 2013; 40: 819-821.
- 24. Ali H, Donovan B, Fairley CK, et al. Are Australian sexual health clinics attracting priority populations? Sex Health 2013; 10: 456-459.
- 25. Ward J, Bryant J, Worth H, et al. Use of health services for sexually transmitted and blood-borne viral infections by young Aboriginal people in New South Wales. Aust J Prim Health 2013; 19: 81-86.
Abstract
Objectives: To examine the impact of the national human papillomavirus (HPV) vaccination program (available to girls and women [12–26 years] since 2007 and to boys [12–15 years] since 2013) on the number of diagnoses of genital warts in Australian Aboriginal and Torres Strait Islander (Indigenous) people.
Design, setting, participants: Analysis of routinely collected data from patients attending 39 sexual health clinics (SHCs) in the Genital Warts Surveillance Network for the first time.
Major outcome: The average annual proportion of Indigenous and non-Indigenous SHC patients diagnosed with genital warts during the pre-vaccination (2004–2007) and vaccination periods (2008–2014), stratified by age group and sex.
Results: 7.3% of the 215 599 Australian-born patients with known Indigenous status and seen for the first time at participating SHCs during 2004–2014 were Indigenous Australians. The average proportion of female Indigenous patients diagnosed with warts was lower during the vaccination period than during the pre-vaccination period (in those under 21, summary rate ratio [SRR], 0.12; 95% CI, 0.07–0.21; P < 0.001); in 21–30–year olds: SRR, 0.41; 95% CI, 0.27–0.61; P < 0.001); there was no significant difference for women over 30 (SRR, 0.84; 95% CI, 0.51–1.36; P = 0.47). The proportion of male Indigenous heterosexual SHC patients under 21 diagnosed with warts was also lower during the vaccination period (SRR, 0.25; 95% CI, 0.12–0.49; P < 0.001), with no significant changes among older Indigenous men over 30.
Conclusions: There were marked declines in the proportions of diagnoses of genital warts in young Indigenous women and men attending SHCs after the introduction of the HPV vaccination program. If high levels of HPV vaccine coverage are sustained, HPV-related cancer rates should also decline.