


Abstract
Objective: To determine whether Care Navigation (CN), a nurse-led hospital-based coordinated care intervention, reduced the use of hospital services and improved quality of life for patients with chronic illness.
Design: Randomised controlled trial; participants were allocated to CN or standard care.
Participants and setting: Patients with chronic illness presenting to the emergency department of Nepean Hospital, Sydney, New South Wales. High-risk status for an unplanned admission was defined as i) three or more unplanned hospital admissions in 12 months for patients aged ≥ 70 or at least one admission for cardiac or respiratory disease in patients aged 16–69 years; or ii) judged by a CN nurse to be high risk and likely to benefit.
Main outcome measures: Numbers of re-presentations or readmissions, quality of life, time to re-presentation, readmission or death, length of stay, and access to hospital and community health services.
Results: 500 participants were randomised between May 2010 and February 2011; 359 by previous unplanned admission and 141 by clinical impression. The CN group received more community health services (rate ratio, 1.94; 95% CI, 1.35–2.81; P < 0.001) than participants receiving standard care; however, this did not result in statistically significant differences in number of re-presentations (rate ratio, 0.83; 95% CI, 0.68–1.01; P = 0.07), number of readmissions (rate ratio, 0.85; 95% CI, 0.70–1.04; P = 0.11), quality of life at 24 months (mean difference, 0; 95% CI, − 0.10 to 0.09, P = 0.93), or other measures.
Conclusions: CN did not improve quality of life or reduce unplanned hospital presentations or admissions despite community health services almost doubling. Future service development should explore potential benefits of linking navigated intrahospital care to ongoing, proactive care planning and delivery in the community.
Trial registration: ACTRN12609000554268.
Chronic, non-communicable diseases including cardiovascular diseases, oral health care, mental disorders and musculoskeletal diseases comprised 85% of the total burden of illness in Australia and New Zealand in the 2008–09 financial year, incurring direct health care costs of $27 billion.1 Respiratory illness, heart disease and diabetes comprised 80% of the total burden of illness and injury and 70% of health expenditure in Australia in 2004.2,3
Fragmentation of health care with poor coordination and communication among care agencies and a lack of continuity of care are noted as problems.4 As a consequence, some consumers rely heavily on local hospital emergency departments (EDs) to provide ongoing care. Although Australian and overseas studies have emphasised coordination problems in the management of chronic care, little is known about what defines well coordinated care, and what comprises an effective program.5-7
Australian coordinated care experiments between 1997 and 20058 often ended up costing more than standard care, and fewer than half showed an improvement in patient wellbeing.8-10
Western Sydney's health services to older people and those with chronic illness were reviewed by the (then) Sydney West Area Health Service's Service Redesign Unit and PricewaterhouseCoopers in 2007.11 The resulting Care Navigation (CN) framework was intended to help patients with chronic illness access services and providers in a more coordinated and timely way, using alternatives to hospital admission where possible for patients with acute deterioration. Those presenting to the ED would have their care more completely coordinated.
We conducted a randomised controlled trial (RCT) to test the hypotheses that, compared with standard care, CN would:
- be superior for participants with complex chronic illness, improve quality of life, and reduce emergency re-presentations and hospital readmissions;
- extend time to first re-presentation and first readmission, and reduce length of stay; and
- have no effect on the mortality rate.
Methods
The study protocol has been published elsewhere.12 Ethics approval was granted by Sydney West Area Health Service Human Research Ethics Committee – Nepean Campus (HREC/09/NEPEAN/55), and ratified by the University of Sydney Research Integrity office.
We conducted a pragmatic RCT. Researchers who collected outcome data or performed statistical analyses were blinded to treatment allocation. Patients and CN nurses were not blinded owing to the nature of the intervention.
Eligible patients who presented to Nepean Hospital ED between 17 May 2010 and 25 February 2011 were identified by an algorithm implemented in the ED patient tracking system, and were approached to consent to participate in the trial. The inclusion algorithm identified patients who had three or more unplanned admissions to a Sydney West Area Health Service hospital in any previous 12-month period and were either aged ≥ 70 years or aged ≥ 45 years if they were of Aboriginal or Torres Strait Islander descent; or aged 16–69 years with at least one admission for a respiratory- or cardiology-related condition. Patients were also eligible if a CN nurse determined that a patient would benefit from receiving CN.
Patients were ineligible if they had previously received CN; were medically unable to participate in study activities (questionnaire completion); were admitted to hospital more than one CN business day before randomisation; or did not provide consent.
Randomisation was stratified by age (≥ 70 years; 16–69 years), and participants were randomly allocated 1 : 1 to CN and standard care. The sequence of treatment allocation was determined by block design. A phone-based randomisation service provided by the National Health and Medical Research Council Clinical Trials Centre was used to allocate treatment arms to participants after consent was given. Participants were followed up for 24 months after randomisation.
Intervention
Three nursing roles were allocated: Inbound, Inflight and Outbound. Two full-time nurses were employed to conduct CN through the recruitment period and for 24 months of follow-up. One nurse conducted the Inbound role — managing patients at presentation to the ED, assessing their current health status and risk of readmission, and directing them to the best method of care in the hospital or community. A second nurse carried out the Inflight role — monitoring the progress of patients' care and minimising delays to discharge from the hospital ward. The second CN nurse also carried out the Outbound role — reviewing patients' hospital stay, assessing the need for out-of-hospital care facilities and making arrangements for ongoing care after departure from hospital.
CN nurses used an electronic assessment form to identify medical and psychosocial risks of readmission, and to identify patients in the ED who might not require hospital admission if community-based care could be organised instead.
Data collection
Baseline demographics were collected from New South Wales Health's Health Information Exchange (HIE) system.
The three primary outcomes of the trial were a reflection of the aims of CN: i) number of re-presentations to a Western Sydney or Blue Mountains EDs; ii) number of readmissions to a Western Sydney or Blue Mountains hospital; and iii) quality of life. Re-presentation and readmission data were collected electronically from the HIE database. Participants completed the EQ-5D-3L questionnaire13 at baseline, 12 and 24 months.
Mortality data were obtained from the National Death Index maintained by the Australian Institute of Health and Welfare. HIE data were used to investigate the time that participants spent in and between hospital visits.
Allied health referral data were obtained from the NSW Health Cerner database. Community health service referral data were obtained from the Community Health Information Management Enterprise (CHIME) and provided by Western Sydney/Nepean Blue Mountains Local Health District Community Health, Information Management and Logistical Support. Medicare Benefits Schedule and Pharmaceutical Benefits Scheme data were provided by Medicare Australia Statistics.
Statistical analyses
Primary analyses were intention-to-treat. The main outcomes were analysed using negative binomial models to estimate the incidence rate ratios of re-presentations and readmissions, and change in EQ-5D score from baseline at 24 months using an analysis of covariance (ANCOVA).
Other outcomes were analysed using negative binomial generalised estimating equation models (length of stay in ED, in ward, and total length of hospital stay; time from arrival in ED to first seen by doctor, and to first allied health referral). For the time-to-event outcomes, time to first ED re-presentation and time to first hospital readmission, we used Kaplan–Meier curves and a Cox proportional hazards model to estimate the hazard ratio.
The total follow-up for each patient was used as an offset. All regression models included treatment arm and the stratification variable (age group) as explanatory variables. Further adjusted analyses were conducted for all outcomes, for sex and the number of ED presentations in the 12 months before randomisation (quartiles). Post-hoc subgroup analyses were conducted on the primary outcomes with respect to age strata; number of ED presentations or hospital admissions in the 12 months before randomisation; whether participants were identified as appropriate for CN by clinician flagging; or whether participants had a carer. A two-sided P of 0.05 or less was considered significant. Data were analysed using SAS, version 9.3 (SAS Institute).
Power calculation
We planned to recruit 500 patients over 12 months and expected a 20% loss to follow-up, leaving a final sample size of 400 with 90% power to detect a 20% reduction in hospital readmissions (rate ratio of 0.8), assuming a 5% significance level and a Poisson distribution with an average of 2.5 admissions per patient over 24 months in the control group, compared with 2.0 in the intervention group. A sample of 400 gave 80% power to detect a 15% reduction in hospital readmissions and a clinically significant difference in presentations. It also allowed us to detect a mean difference of 10 points on the EQ-5D scale, with about 80% power at a 5% significance level. This calculation is based on pilot data that estimated standard deviation of EQ-5D scores to be 35 points.6
Besides the quantitative studies of the effect of CN, a process evaluation gave qualitative insights into the process of the provision of care. Extensive interviews with service providers included tracking how the model of care changed over the course of the intervention. These data will be presented in a subsequent publication.
Results
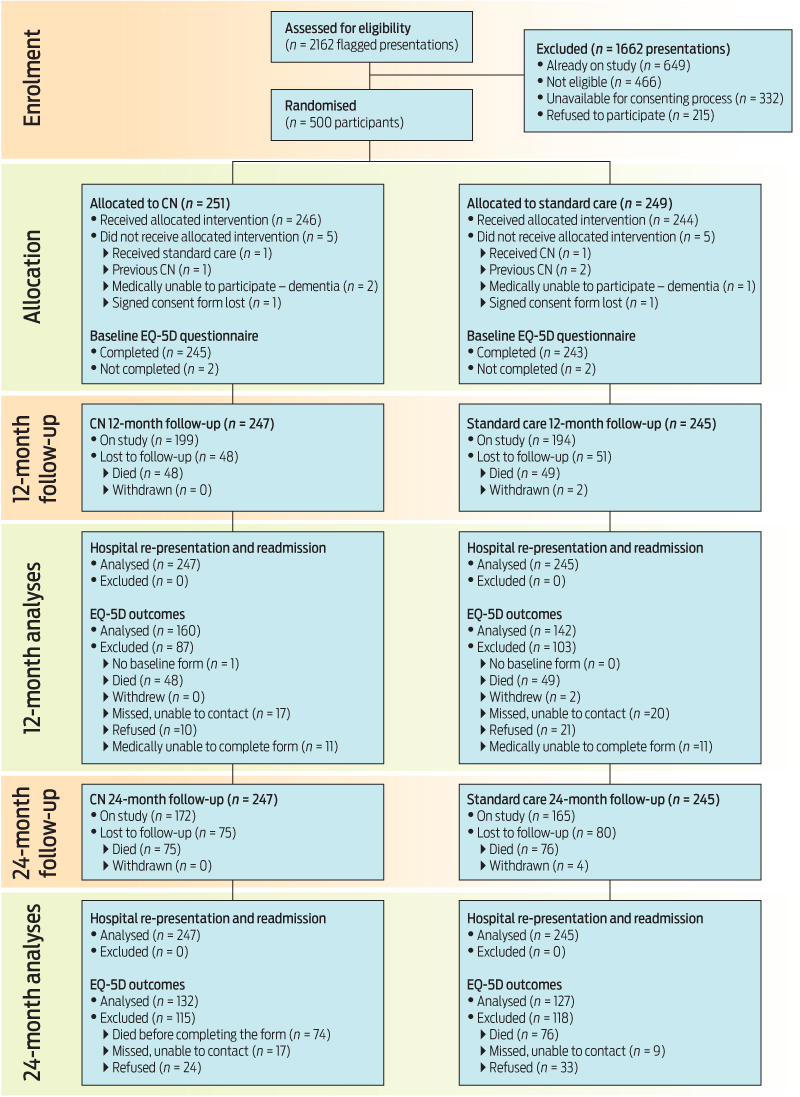
Five hundred patients were recruited to the study between May 2010 and February 2011. Box 1 shows the flow of participants' progress through the study. Participant baseline demographic information by study arm is presented in Box 2. Randomisation provided an even distribution between study arms for all demographic variables except sex — the CN group had 55% women compared with 45% in the standard care group. Three-quarters of participants were born in Australia, and four of these were reported in the hospital patient database as being Indigenous. Most participants presented to the ED on a weekday, during the daytime, and 88% were admitted to hospital at their randomisation visit.
Primary outcomes
The comparison of outcomes by treatment type is shown in Box 3. The mean number of ED re-presentations during the 24-month follow-up period was not statistically significantly reduced in the CN group (6.28; 95% CI, 5.44–7.26) compared with the standard care group (7.57; 95% CI, 6.55–8.74). This corresponds to a 17% reduction in re-presentation (95% CI, − 1% to 32%; P = 0.07). Similarly, there was no significant reduction in the mean number of hospital readmissions during the follow-up period in the CN group (4.38; 95% CI, 3.79–5.06) compared with the standard care group (5.16; 95% CI, 4.46–5.96). This corresponds to a 15% reduction (95% CI, − 4% to 30%; P = 0.11). Quality of life at 24 months did not differ significantly between the CN and standard care groups, with a mean difference of zero (95% CI, − 0.10 to 0.09; P = 0.93). Further analyses adjusted for sex and ED presentations before randomisation were similar.
CN had no significant treatment effect on any primary outcome in any of the subgroups analysed (results not shown).
Secondary outcomes
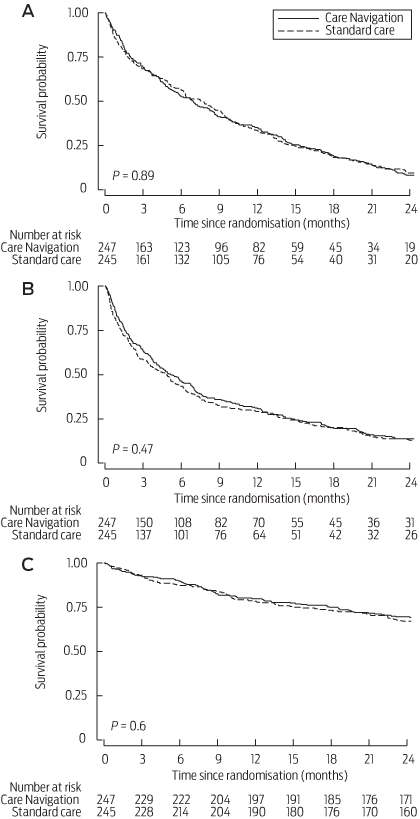
CN did not affect the time to first re-presentation after randomisation (hazard ratio, 1.01; 95% CI, 0.84–1.23; P = 0.89; Box 4A), or the time to first readmission (hazard ratio, 0.93; 95% CI, 0.77–1.13; P = 0.47; Box 4B). CN had no effect on the mean number of hours spent in the ED at the randomisation visit (rate ratio, 0.95; 95% CI, 0.82–1.11; P = 0.54) or over the subsequent 24 months (rate ratio, 0.99; 95% CI, 0.90–1.08; P = 0.80; Box 3). CN did not significantly reduce the mean number of days admitted to a ward at the randomisation visit (rate ratio, 1.2; 95%, CI, 0.82–1.76; P = 0.36) or over the subsequent 24 months (rate ratio, 0.98; 95% CI, 0.82–1.17; P = 0.82; Box 3). CN had no effect on mortality (hazard ratio, 0.92; 95% CI, 0.67–1.26; P = 0.60; Box 4C).
Process outcomes
More than six times the number of patients in the CN group (119/247 [48%]; 95% CI, 42–54) had their medications reviewed by a hospital pharmacist when presenting to hospital than those in the standard care group (19/245 [8%], 95% CI, 5–12); the overall difference was statistically significant (rate ratio, 6.35; 95% CI, 4.03–10.02; P < 0.001). However, there was no difference in the number of prescription medications dispensed over the 24-month follow-up period. CN had no effect on any other inhospital allied health or diagnostic services (results not shown).
Patients in the CN group received more services per year from community health (rate, 13.80; 95% CI, 10.69–17.8) than standard care patients (rate, 7.10; 95% CI, 5.46–9.23); the overall difference was statistically significant (rate ratio, 1.94; 95% CI, 1.35–2.81; P < 0.001). Most of these services were the result of referrals from hospitals (CN rate, 1.00 per year; 95% CI, 0.88–1.13 v standard care rate, 0.38; 95% CI, 0.32–0.45; P < 0.001). CN did not change the number of service payments claimed from the Medicare Benefits Schedule by general practitioners, non-hospital allied health professionals or consultant physicians (results not shown).
Delivery of intervention
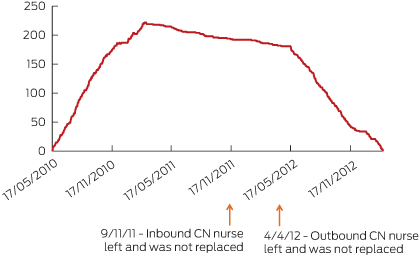
CN began in May 2010. Nursing personnel was reduced from two nurses to one nurse on 9 November 2011. The remaining CN nurse reviewed existing risk assessments, updating participants' requirements where required, but did not carry out any other part of the Inbound CN role due to availability of time and a lack of expertise in ED nursing. CN ceased at Nepean Hospital on 4 April 2012, when the remaining CN nurse left the position. Box 5 depicts the availability of CN nurses along with the number of participants actively in the study in the intervention arm throughout the study period. Per-protocol analyses based on 12 months of follow-up or the period when CN nurses were available demonstrated no difference between standard care and CN in any of the primary or secondary outcomes (results not shown).
Discussion
CN did not improve quality of life or reduce unplanned hospital presentations or admissions despite community health services almost doubling. This study sought to establish whether an energetic hospital care coordination program could enable patients admitted with an exacerbation of chronic illness to receive sufficient assistance in hospital and in the community, to reduce their need for future readmission.
There is a growing body of evidence that outcomes for people living with chronic illness can be improved, and hospital attendances reduced, by redesign of the health care delivery system across primary, secondary and acute sectors to ensure equitable, structured, proactive, coordinated, culturally sensitive care; decision support and clinical information systems that support this care; case management for complex patients; empowerment and support for self-management by patients and their carers; and community mobilisation.4,14,15 The impact of these changes is greatest when multiple, integrated improvements are made in care delivery.16
CN was an attempt to organise these services from a hospital base. However, it was no more effective than the existing processes of care at Nepean Hospital in improving self-reported quality of life, reducing hospital presentations or admissions, reducing the time patients spent in hospital or delaying readmission. CN had no effect on mortality. No intervention effect was detected in any of the subgroups analysed. However, CN did have an impact on the processes of care following discharge. Patients in the intervention group received more services from community health agencies, mainly nursing services.
Patients in the CN group spent the same amount of time in hospital and were referred to inhospital allied health or diagnostic services at the same rates as the standard care group. Delivery of CN was largely within the hospital, with limited arrangements made for ongoing care after departure. While these arrangements presumably reflected the care navigators' assessment of the participants' current and expected needs at that time, subsequent changes in their clinical needs would have been managed by health service structures and services that were similar in the two arms of the trial.
Attempts to formally evaluate interventions in health care systems are fraught by changes in the environment of care as staff change, funding sources change, and higher service priorities come to dominate the care scene. CN suffered the effects of all these real-world variations.
While study recruitment achieved the predetermined target of 500 participants and complete data were available for analysis from 492 (98%) at the end of the study, implementation of the intervention varied during the study; in particular, the number of CN nurses reduced from two to one 18 months after recruitment commenced. The second nurse left 4.5 months later, when CN ceased at the hospital, and the final 10 months of the study period had no CN. However, analysis limited to the period when both nurses were available showed no intervention effect on any of the primary or secondary outcomes.
CN during hospital admission with increased referrals for community health services after discharge was too small an intervention in the overall health system to have an impact. Future service development should explore the potential benefits of linking navigated intrahospital care to ongoing, proactive care planning and delivery in the community.
2 Participant baseline demographic information by study arm
Demographic variable | Care Navigation (n = 247) | Standard care (n = 245) | |||||||||||||
Age in years at randomisation, mean (SD) | 73.3 (12.3) | 74.9 (11.8) | |||||||||||||
Age at randomisation by strata, no. (%) | |||||||||||||||
≥ 70 years | 171 (69%) | 171 (70%) | |||||||||||||
16–69 years | 76 (31%) | 74 (30%) | |||||||||||||
Sex, no. (%) | |||||||||||||||
Female | 135 (55%) | 110 (45%) | |||||||||||||
Male | 112 (45%) | 135 (55%) | |||||||||||||
Country or region of birth, no. (%) | |||||||||||||||
Australia | 188 (76%) | 183 (75%) | |||||||||||||
Europe | 40 (16%) | 46 (19%) | |||||||||||||
Other/not stated | 19 (8%) | 16 (7%) | |||||||||||||
Preferred language, no. (%) | |||||||||||||||
English | 232 (94%) | 219 (89%) | |||||||||||||
Non-English | 10 (4%) | 13 (5%) | |||||||||||||
Not stated | 5 (2%) | 13 (5%) | |||||||||||||
Marital status, no. (%) | |||||||||||||||
Married or de facto | 117 (47%) | 127 (52%) | |||||||||||||
Single, widowed, separated or divorced | 129 (52%) | 116 (47%) | |||||||||||||
Not stated | 1 (< 1%) | 2 (1%) | |||||||||||||
Funding source for services (in addition to Medicare), no. (%) | |||||||||||||||
None | 166 (67%) | 166 (68%) | |||||||||||||
Private health insurance | 10 (4%) | 13 (5%) | |||||||||||||
Department of Veterans' Affairs card, all types | 21 (9%) | 12 (4%) | |||||||||||||
Compensation | 2 (1%) | 2 (1%) | |||||||||||||
Not stated | 48 (19%) | 52 (21%) | |||||||||||||
Primary SRG assigned to hospital admissions in the 12 months before randomisation, no. (%)* | |||||||||||||||
Cardiology | 85 (34%) | 89 (36%) | |||||||||||||
Surgery | 58 (23%) | 39 (16%) | |||||||||||||
Respiratory | 38 (15%) | 49 (20%) | |||||||||||||
Other† | 107 (43%) | 97 (40%) | |||||||||||||
No. of emergency department presentations in the 12 months before randomisation, mean (SD) | |||||||||||||||
1 | 33 (13) | 47 (19) | |||||||||||||
2–3 | 92 (37) | 88 (36) | |||||||||||||
4–5 | 68 (28) | 67 (27) | |||||||||||||
≥ 6 | 54 (22) | 43 (18) | |||||||||||||
No. of unplanned hospital admissions in the 12 months before randomisation, mean (SD) | |||||||||||||||
0 | 7 (3) | 13 (5) | |||||||||||||
1 | 53 (21) | 50 (20) | |||||||||||||
2 | 53 (21) | 45 (18) | |||||||||||||
3–4 | 83 (34) | 76 (31) | |||||||||||||
≥ 5 | 51 (21) | 61 (25) | |||||||||||||
Eligibility criteria used at randomisation visit, no. (%) | |||||||||||||||
Electronic algorithm | 181 (73%) | 170 (69%) | |||||||||||||
Clinician flag | 66 (27%) | 75 (31%) | |||||||||||||
Unplanned hospital admissions at randomisation, no. (%) | 222 (90%) | 209 (85%) | |||||||||||||
SRG = service-related group. * Percentages exceed 100% as some participants with more than one previous admission were listed under more than one primary SRG. † Including gastroenterology; geriatrics; cancer; neurology; renal medicine; rehabilitation; immunology and infectious diseases; endocrinology; non-subspecialty medicine; ear, nose and throat; psychiatry – acute, maintenance, drug and alcohol, unallocated, pain management; renal dialysis; palliative care; gynaecology; or dermatology.
3 Comparison of outcomes of Care Navigation and standard care for the 24 months after randomisation
Outcome | Care Navigation | Standard care | RR/HR/MD (95% CI) | P | |||||||||||
Primary | |||||||||||||||
Mean no. of re-presentations (95% CI) | 6.28 (5.44–7.26) | 7.57 (6.55–8.74) | RR, 0.83 (0.68–1.01) | 0.07 | |||||||||||
Mean no. of readmissions (95% CI) | 4.38 (3.79–5.06) | 5.16 (4.46–5.96) | RR, 0.85 (0.70–1.04) | 0.11 | |||||||||||
Quality of life 24 months after randomisation — | 0.14 (0.08–0.21) | 0.15 (0.08–0.22) | MD, 0 (− 0.10 to 0.09) | 0.93 | |||||||||||
Secondary | |||||||||||||||
Median time from randomisation to first ED re-presentation, days (IQR) | 111 (89–143) | 103 (72–148) | HR, 1.01 (0.84–1.23) | 0.89 | |||||||||||
Median time from randomisation to first hospital readmission, days (IQR) | 155 (121–205) | 144 (102–178) | HR, 0.93 (0.77–1.13) | 0.47 | |||||||||||
Median time from randomisation to death, days (IQR) | — | — | HR, 0.92 (0.67–1.26) | 0.60 | |||||||||||
Mean length of ED stay, hours (95% CI) | |||||||||||||||
To departure-ready | 5.73 (5.37–6.1) | 6.81 (5.74–8.08) | RR, 0.84 (0.69–1.02) | 0.08 | |||||||||||
Actual | 10.58 (9.91–11.3) | 10.71 (10.03–11.44) | RR, 0.99 (0.90–1.08) | 0.80 | |||||||||||
Mean length of stay admitted to a ward, days (95% CI) | 5.46 (4.86–6.14) | 5.57 (4.76–6.53) | RR, 0.98 (0.82–1.17) | 0.82 | |||||||||||
Mean length of ED stay at randomisation visit, hours (95% CI) | |||||||||||||||
All participants | 12.91 (11.59–14.39) | 13.55 (12.01–15.28) | RR, 0.95 (0.82–1.11) | 0.54 | |||||||||||
Participants not admitted to a ward | 7 (4.69–10.44) | 6.52 (5.28–8.07) | RR, 1.07 (0.65–1.76) | 0.78 | |||||||||||
Participants admitted to a ward | 13.61 (12.2–15.18) | 14.74 (13.01–16.7) | RR, 0.92 (0.79–1.08) | 0.32 | |||||||||||
Length of stay in a ward at randomisation visit | 7.01 (4.52–10.87) | 5.86 (4.7–7.31) | RR, 1.2 (0.82–1.76) | 0.36 | |||||||||||
ED = emergency department. HR = hazard ratio. IQR =interquartile range. MD = mean difference. RR = rate ratio. All analyses were adjusted for stratification at randomisation (age: ≥ 70 years; 16–69 years). — = Median survival cannot be obtained as cumulative survival did not fall below 50% during the study period.
Received 22 July 2014, accepted 26 February 2015
- Natalie A Plant1
- Patrick J Kelly2
- Stephen R Leeder3
- Mario D’Souza3
- Kylie-Ann Mallitt4
- Tim Usherwood2
- Stephen Jan5
- Steven C Boyages2
- Beverley M Essue3
- Justin McNab3
- James A Gillespie2,3
- 1 Royal North Shore Hospital, Sydney, NSW.
- 2 University of Sydney, Sydney, NSW.
- 3 Menzies Centre for Health Policy, Sydney, NSW.
- 4 University of New South Wales, Sydney, NSW.
- 5 The George Institute for International Health, Sydney, NSW.
Funding for the evaluation was provided by the National Health and Medical Research Council. Funding for CN was provided by NSW Health.
Stephen Leeder was Editor-in-Chief of the Medical Journal of Australia when this article was accepted for publication.
- 1. Australian Institute of Health and Welfare. Australia's health 2014. Canberra: AIHW, 2014. (AIHW Cat. no. AUS 178; Australia's Health Series No. 14.) http://www.aihw.gov.au/WorkArea/DownloadAsset.aspx?id=60129548150 (accessed May 2015).
- 2. National Health Priority Action Council. National Chronic Disease Strategy. Canberra: Australian Government Department of Health and Ageing, 2005. http://www.health.gov.au/internet/main/publishing.nsf/Content/66EC52273873D375CA257BF0001F3FED/$File/stratal3.pdf (accessed Apr 2015).
- 3. Australian Institute of Health and Welfare. Australia's health 2004. Canberra: AIHW, 2004. http://www.aihw.gov.au/WorkArea/DownloadAsset.aspx?id=6442453243 (accessed Apr 2015).
- 4. Mirzaei M, Aspin C, Essue B, et al. A patient-centred approach to health service delivery: improving health outcomes for people with chronic illness, BMC Health Serv Res 2013; 13: 251.
- 5. Yen L, Gillespie J, Jeon YH, et al. Health professionals, patients and chronic illness policy: a qualitative study. Health Expect 2011; 14: 10-20.
- 6. Jeon YH, Jowsey T, Yen L, et al. Achieving a balanced life in the face of chronic illness. Aust J Prim Health 2010; 16: 66-74.
- 7. Jowsey T, Jeon YH, Dugdale P, et al. Challenges for co-morbid chronic illness care and policy in Australia: a qualitative study. Aust New Zealand Health Policy 2009; 6: 22.
- 8. Harvey PW, McDonald PJ. The science of the COAG coordinated care trials, Aust J Prim Health 2003; 9: 109-113.
- 9. PricewaterhouseCoopers; Australian Department of Health and Ageing. The national evaluation of the second round of coordinated care trials. Canberra: DoHA, 2007.
- 10. Esterman AJ, Ben-Tovim DI. The Australian coordinated care trials: success or failure? Med J Aust 2002; 177: 469-470. <MJA full text>
- 11. Sydney West Area Health Service; PriceWaterhouseCoopers. Promoting integrated and timely care in the community and hospital (PITCCH): clinical redesign project. Sydney: SWAHS, 2007.
- 12. Plant N, Mallitt KA, Kelly PJ, et al. Implementation and effectiveness of “care navigation”, coordinated management for people with complex chronic illness: rationale and methods of a randomised controlled trial. BMC Health Serv Res 2013; 13: 164.
- 13. Brooks R. EuroQol: the current state of play. Health Policy 1996; 37: 53-72.
- 14. Royal Melbourne Hospital. Potentially preventable hospitalisations: a review of the literature and Australian policies. Final report. Melbourne: Clinical Epidemiology and Health Service Evaluation Unit, RMH, 2009. http://www.safetyandquality.gov.au/wp-content/uploads/2009/01/Potentially-preventable-hospitalisations-A-review-of-the-literature-and-Australian-policies-Final-Report.pdf (accessed Jan 2015).
- 15. Coleman K, Austin BT, Brach C, Wagner EH. Evidence on the chronic care model in the new millennium. Health Aff (Millwood) 2009; 28: 75-85.
- 16. Adams SG, Smith PK, Allan PF, et al. Systematic review of the chronic care model in chronic obstructive pulmonary disease prevention and management. Arch Intern Med 2007; 167: 551-561.
Paul Langton
Competing Interests: No relevant disclosures
Assoc Prof Paul Langton
Cardiovascular Services