




Volume 199 - Issue 9
Time trends in cancer incidence and mortality
Author: Bruce K Armstrong
Med J Aust 2013; 199 (9): 570-571. || doi: 10.5694/mja13.11247
Published online: 4 November 2013
Published online: 4 November 2013
Trends over the past three decades show that Australia has done vastly better in preventing cancer death than in primary prevention.
What do they tell us about cancer control in Australia?
There have been some spectacular trends, both good and bad, in cancer incidence and mortality in Australia over the past three decades. Using data from the Australian Institute of Health and Welfare (AIHW),1 the annual average percentage change in incidence and mortality of the most common cancers in Australia can be calculated for this period, as shown in the Box. Perhaps the most notable trends are annual 5%–6% rises in the incidence of hepatic and prostatic cancers and 4%–5% falls in mortality from Hodgkin lymphoma and cervical and testicular cancers. These examples reflect the annual trends in the rates of all cancers: increasing incidence of 0.7% (95% CI, 0.5%–0.9%) and falling mortality of 1.4% (95% CI, 1.2%–1.5%).
Broadly, there are three factors that drive trends in cancer incidence and mortality.
First, changes in population exposure to cancer risk factors can increase or decrease cancer incidence and, after a short delay, produce a more or less parallel change in cancer mortality. For example, with liver cancer, the increasing annual incidence (4.8%; 95% CI, 4.5%–5.1%) and mortality (3.0%; 95% CI, 2.7%–3.2%) are largely due to increasing population prevalence of chronic infection with hepatitis B and C viruses.2
Second, population screening that primarily detects precancerous lesions can cause falls in both incidence and mortality. Cervical cancer shows this pattern, with average annual downtrends of 3.5% (95% CI, 3.3%–3.7%) in incidence and 4.2% (95% CI, 3.9%–4.4%) in mortality over the period of analysis. These trends began in the early 1990s and coincided with introduction of the Australian National Cervical Screening Program.3 On the other hand, population screening that primarily detects invasive cancer causes incidence to increase and — if effective, and after some delay — mortality to fall. Australia’s de-facto national prostate cancer screening program with the prostate-specific antigen test began in the late 1980s4 and produced extraordinary and continuing rises in prostate cancer incidence (average annual increase in 2000–2007: 6.7%; 95% CI, 5.3%–8.0%; data not shown). This was probably due to both earlier diagnosis of cancers yet to appear clinically and diagnosis of cancers that would never manifest clinically (overdiagnosis). A moderate downtrend in prostate cancer mortality followed (average annual decrease in 2000–2007: 2.0%; 95% CI, 1.5%–2.6%), with some of it probably explained by advances in therapy.4
Third, in the absence of both incidence downtrend and any material effort at early diagnosis, treatment advances are the most likely contributor to mortality downtrend. This pattern is evident for acute lymphoblastic leukaemia, bowel cancer (which may also be affected by screening), Hodgkin and non-Hodgkin lymphoma, testicular cancer, thyroid cancer (incidence is increasing mainly because of incidental earlier diagnosis of good-prognosis papillary cancers5), cancer of the tongue and uterine corpus cancer. Examples of important treatment advances include rituximab therapy for non-Hodgkin lymphoma6 and mesorectal excision for rectal cancer.7
What do the cancer trends and this brief guide to their interpretation tell us about how well we have done and where we should go in cancer control?
Given that the data show 19 favourable and two adverse mortality trends of 0.3% or greater annually, and six favourable and 17 adverse incidence trends, it is inescapable that Australia has done vastly better in preventing cancer death than in primary prevention. This should come as no surprise: the AIHW estimated that in the 2004–05 financial year, Australia spent $3.19 billion on medical and hospital care and pharmaceuticals for cancer and $0.22 billion on community and public health programs — mostly for screening programs, not primary prevention.8 The imbalance is unlikely to be less now.
Tobacco control is the good-news prevention story, although, for lung cancer over the past three decades, the falling annual incidence and mortality in men (1.8% and 2.5%, respectively) and rising annual incidence and mortality in women (1.9% and 1.4%, respectively) have resulted in close to a zero-sum game. Trends in bladder cancer and laryngeal cancer, both smoking-related, are more encouraging. Oddly, rates of these cancers fell almost as rapidly in women as they did in men.1
Asbestos control may be another, albeit smaller, good-news story. Mesothelioma incidence rates have shown no net increase since about 2003, and mortality may have begun to fall.1 Melanoma, while rising steadily in incidence through the 1980s and 1990s, reached plateaus in incidence and mortality from about 2002.1 Our sun-protection efforts may be paying off at last! Anal cancer rates, while having increased through much of the three decades analysed, also plateaued in the 2000s and should eventually fall as a result of vaccination of Australian boys and girls against oncogenic human papillomaviruses.
Greater than any of these trends is the long-running fall in stomach cancer incidence and mortality, which appears to continue unabated at rates of 2%–4% a year, for reasons unknown. Refrigeration, less preserved food, more fruit and vegetables, better living standards and more antibiotics, which may have reduced Helicobacter pylori infection, are hypothesised benefactors.9
Liver cancer remains concerning, with both rising incidence and rising mortality and little indication that the trends have moderated in recent years. Universal vaccination against hepatitis B virus is already in place in Australia, and the risk of liver cancer in those with hepatitis C, mainly spread by injecting drug use, can be reduced by antiviral treatment. However, better uptake of therapy is needed,10 as is a vaccine against hepatitis C.
Examining cancer incidence and mortality trends provides a valuable picture of successes and remaining challenges in cancer control, including a much greater need for primary preventive strategies.
Estimated annual percentage changes in incidence and mortality for the most common cancers in Australia over 28 years*
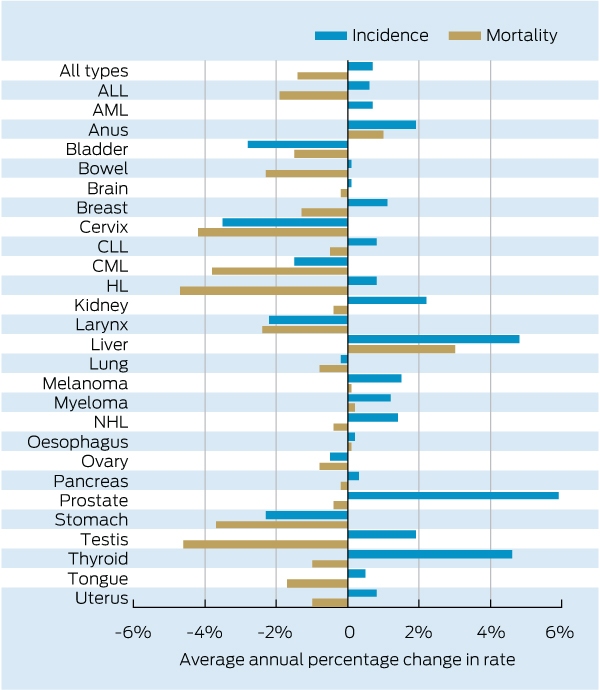
ALL = acute lymphoblastic leukaemia. AML = acute myeloblastic leukaemia. CLL = chronic lymphocytic leukaemia. CML = chronic myeloid leukaemia. HL = Hodgkin lymphoma. NHL = non-Hodgkin lymphoma. * Incidence data from 1982 to 2009, the longest period available, and mortality data from 1980 to 2007, the most recent 28 years available. Average annual percentage changes in incidence and mortality were estimated from negative binomial regression models adjusted for age and sex. Mesothelioma was excluded because mortality data were available only from 1997, and non-melanoma skin cancer was excluded because incident cases are not registered nationally.
Competing interests
No relevant disclosures.
Acknowledgements
Chris Goumas did the statistical analysis of annual percentage changes in cancer rates.
References
- Australian Institute of Health and Welfare. Australian cancer incidence and mortality (ACIM) books. Canberra: AIHW, 2012. http://www.aihw.gov.au/acim-books (accessed Oct 2013).
- Amin J, O’Connell D, Bartlett M, et al. Liver cancer and hepatitis B and C in New South Wales, 1990–2002: a linkage study. Aust N Z J Public Health 2007; 31: 475-482. 0_i1139909
- Aminisani N, Armstrong BK, Egger S, Canfell K. Impact of organised cervical screening on cervical cancer incidence and mortality in migrant women in Australia. BMC Cancer 2012; 12: 491. 0_i1139911
- Smith DP, Supramaniam R, Marshall VR, Armstrong BK. Prostate cancer and prostate-specific antigen testing in New South Wales. Med J Aust 2008; 189: 315-318. 0_i1139913
- Kahn C, Simonella L, Sywak M, et al. Pathways to the diagnosis of thyroid cancer in New South Wales: a population-based cross-sectional study. Cancer Causes Control 2012; 23: 35-44. 0_i1139915
- Marcus R, Hagenbeek A. The therapeutic use of rituximab in non-Hodgkin’s lymphoma. Eur J Haematol Suppl 2007; (67): 5-14. 0_i1139917
- Rutten H, den Dulk M, Lemmens V, et al. Survival of elderly rectal cancer patients not improved: analysis of population based data on the impact of TME surgery. Eur J Cancer 2007; 43: 2295-2300. 0_i1139919
- Australian Institute of Health and Welfare. Health system expenditure on disease and injury in Australia, 2004-05. Canberra: AIHW, 2010. (AIHW Cat. No. HSE 87; Health and Welfare Expenditure Series No. 36.) http://www.aihw.gov.au/publication-detail/?id=6442468349 (accessed Sep 2013).
- Roder DM. The epidemiology of gastric cancer. Gastric Cancer 2002; 5 Suppl 1: 5-11. 0_i1139923
- Thein HH, Walter SR, Gidding HF, et al. Trends in incidence of hepatocellular carcinoma after diagnosis of hepatitis B or C infection: a population-based cohort study, 1992-2007. J Viral Hepat 2011; 18: e232-e241. 0_i1139927
Provenance: Commissioned; externally peer reviewed.
Sovereignty and Survival: Understanding Lung Cancer Outcomes for Aboriginal and Torres Strait Islander People in Australia, a Case–Control Study
Alice R. T. Bergin, Luc te Marvelde, Roger L. Milne, Benjamin J. Solomon, Kris Ivanova, Peter Savas, Stephen J. Luen, Jay Hamann, Andrea Casey, Nicole Watt, Sue M. Evans, Gail Garvey, Sherene Loi
The Changing Indications for Adult Liver Transplantation in Australia: A Narrative Review
Fadak Mohammadi, Alan J. Wigg, Ken Liu, Simone I. Strasser
Uneven Ground: Survival Differences Among Victorian Lung Cancer Patients by Location of Residence (2011–2023): A Retrospective Cohort Study
Evangeline Samuel, Eldho Paul, Mike Lloyd, Sanuki Tissera, Craig Underhill, Sagun Parakh, Phillip Parente, Inger Olesen, Javier Torres, Katharine See, Gavin M. Wright, David Langton, Thomas John, Matthew Conron, James Bartlett, Nicola Atkin, Nikolajs Zeps, Susan V. Harden, Wasek Faisal, John R. Zalcberg, Rob G. Stirling
Early-Onset Colorectal Cancer With Liver-Only Metastases: A Retrospective Cohort Study Integrating Prospectively Collected Real-World Clinical and Molecular Data From an Australian National Database (2009–2024) to Guide Treatment Planning
Savio G. Barreto, Christos S. Karapetis, Shahid Ullah, Matthew Burge, Susan Caird, Angus Campbell, Azim Jalali, Ross Jennens, Muhammad A. Khattak, Belinda Lee, Stephanie H. Lim, Shehara Mendis, Louise Nott, Timothy J. Price, Jeremy D. Shapiro, Jeanne Tie, Javier Torres, Colin Williams, Rachel Wong, Vanessa Wong, Peter Gibbs
Australian Pathways for Specialist Pain Management and Early Palliative Care for People With Pancreatic Cancer: Developed Using a Community Consensus Approach
Jennifer Philip, Melanie R. Lovell, Kylee Bellingham, Gail Garvey, Gregory B. Crawford, Nicole M. Rankin, Kara Burns, Isabel Young, Vivienne Milch, Dorothy Keefe, Katrina Anderson, James Lawson, Meinir Krishnasamy
Program Guidelines for the National Lung Cancer Screening Program: Targeted Lung Cancer Screening in High-Risk Individuals in Australia
Nicole M. Rankin, Rebecca Zosel, Lisa J. Whop, Raglan Maddox, Annette McWilliams, Miranda Siemienowicz, Jon Emery, Maria A. R. Lantin, Georgia Bartlett, Mikayla Wolfe, Abbey Diaz, Katrina Anderson, Lillian Liu, Cindy Toms, Sarah McDermott, Peter Bligh, Jeremy Chalke, Stephen Melsom, Claire E. Nightingale, Alison Brown, Sam Pope, Julia Brotherton, Anne Fidler, Michel Itel, Mark Brooke, Diane M. Pascoe, Fraser Brims, Tracy L. Leong, Emily Stone, Dorothy Keefe, Vivienne Milch