


The impact of communicable diseases on life expectancy and level of morbidity decreased with the commencement of immunisation programs in 1924 and the discovery of antibiotics in the late 1930s. Yet no sooner had the discovery of antibiotic and chemotherapeutic agents brought benefits to both our general public health and hospital practices than the alarm was raised about emerging resistance of staphylococci to penicillin in the Australian health care setting in the 1940s.1 By the 1950s, the alarm was raised again, this time about environmental contamination with Staphylococcus aureus2 and, by the 1980s, hospitals around Australia were looking towards imprudent antibiotic treatments as being responsible for the notable rise in prevalence of methicillin-resistant S. aureus (MRSA).3-5 Around this time, a national survey of more than 28 000 patients from 459 public and private hospitals revealed that 46% of isolates from surgical site infections were S. aureus,6 reflecting a higher prevalence than seen in most international surveys of surgical site infections.7,8 Today, S. aureus is still responsible for the majority of surgical site infections9 and skin and soft tissue infections.10
By the end of the 1980s, a consortium of infectious diseases health care workers (HCWs) concerned about the ability of S. aureus to acquire new resistance and undergo rapid clonal expansion formed the Australian Group on Antimicrobial Resistance (AGAR). AGAR used a simple but effective laboratory-based surveillance system to examine the resistance patterns of the first 100 S. aureus clinical isolates from 21 teaching hospital laboratories in eight cities. Aggregated 1989–1999 data showed a high prevalence of MRSA (20%).11 By the late 1990s, all Australian hospitals were routinely testing S. aureus isolates for resistance. Eleven hospitals participating in a New South Wales pilot statewide surveillance system routinely reported the incidence of health care-associated MRSA (HA-MRSA) from all anatomical sites, at an aggregated rate of 0.59/1000 occupied bed-days, or 396 episodes per year.9
In 2005, AGAR reported the proportion of MRSA from S. aureus clinical isolates from inpatient settings to be as high as 31.9%!10 The same methodology was used by AGAR in 2000–2004 for isolates from community settings, with the proportions of MRSA from S. aureus isolates at 10.3% in 2000, 15.2% in 2002 and 14.9% in 2004.12 Antibiograms and strain typing of 100 S. aureus isolates showed that community-associated MRSA (CA-MRSA) was isolated in similar proportions to HA-MRSA for each year between 2000 and 2004, with both CA-MRSA and HA-MRSA increasing significantly over these periods. Three CA-MRSA strains are now more likely to be acquired in hospital than in the community and have the potential to cause severe infection in young, otherwise healthy people.13 Conversely, HA-MRSA infections are more commonly associated with older people.10 Although most outbreaks of MRSA in health care settings are still associated with HA-MRSA, the rise in CA strains in the community and hospital settings is an increasing phenomenon.12-14
The Clinical Excellence Commission and the NSW Department of Health (NSW Health) launched the Clean hands save lives15 campaign in February 2006. This made Australia one of the 45% of countries globally to pledge their commitment to the World Health Organization’s Clean care is safer care16 hand hygiene campaign.
The primary aim of our statewide campaign was to place alcohol-based hand rub (AHR) into all public hospitals in NSW as an initial step towards promoting hand hygiene compliance (described in detail elsewhere).17 The overall rate of compliance with hand hygiene practice in NSW public hospitals increased significantly, from a pre-campaign average of 47% to a post-campaign average of 61%.18
Similar campaigns introducing AHR have attributed significant reductions in acquisition of MRSA infections to increased hand hygiene compliance rates.19-26 AHR, posters and clinical leadership introduced into a Geneva hospital resulted in an 18% improvement in hand hygiene compliance after 2 years.19 The incidence of new MRSA infections dropped from 0.60/100 admissions in 1994, when hand hygiene compliance was low (47.6%), to approximately 0.25/100 admissions after the 18% improvement in hand hygiene compliance. This is equivalent to a 60% reduction in MRSA infections, from 2.16/10 000 patient-days in 1994 to 0.93/10 000 patient-days by 1998 (P < 0.001).19
The baseline hand hygiene compliance rate before the introduction of the Geneva program into five wards in one Australian teaching hospital was 21%. The compliance rate doubled to 42% over 36 months.20 This 21 percentage point (PP) improvement in hand hygiene was accompanied by a 40% reduction in the number of MRSA clinical isolates.7 Before the implementation of the Geneva program into a further five Victorian hospitals, the monthly rate of MRSA clinical isolates was 1.39/100 patient discharges (range, 0.16–2.39/100 patient discharges). After 24 months of the program, this rate fell by 48% to 0.73/100 patient discharges.21
Before the development of shorter admissions and multiple complex interventions, including antimicrobial stewardship programs, the link between hand hygiene compliance and infection was stronger than it is today.27 Nevertheless, multifocused interventions must include hand hygiene practices, as they are an effective method of breaking the link between the susceptible patient and the infectious reservoir. Mandatory clinical indicator data reporting was introduced for all NSW public hospitals during the pilot development of statewide standardised surveillance in the late 1990s,9 as a formal reporting requirement in early 2000,28,29 and for accreditation in 2003.30 These data indicated that MRSA was endemic in NSW public hospitals. With more than 2.6 million acute care admissions into NSW public hospitals per year, every effort must be made to reduce the likelihood that any newly admitted patient will acquire an infection from contact with contaminated HCW hands. The instigators of the NSW hand hygiene campaign were encouraged by the reported reduction in MRSA prevalence in similar campaigns.19-26 We report here on the impact of improved hand hygiene on the incidence of MRSA.
Details of the content of the campaign, timelines and hand hygiene compliance rates are provided elsewhere.17,18,31 The hand hygiene compliance rate was calculated as the number of hand hygiene events observed (ie, hand-washing with soap and water or with AHR) divided by the number of hand hygiene opportunities, expressed as a percentage.18
The Australian Council on Healthcare Standards (ACHS) has developed clinical indicators for patient safety, including rates of infection with multiresistant organisms (MROs).30 The clinical indicators for rates of new health care-associated MRSA infection are defined in Box 1. Data are stratified into two anatomical locations (sterile sites [blood cultures] and non-sterile sites [sites other than blood cultures]) and into two ward sites of acquisition (the intensive care unit [ICU] and sites other than the ICU). Each clinical indicator represents the number of new health care-associated infections during the time period under study divided by the number of overnight occupied bed-days during the same period, expressed as a figure per 10 000 acute bed-days.30
Clinical indicator data for MRSA, vancomycin-resistant enterococci (VRE) and multiresistant Acinetobacter baumannii (MRAB) have been mandatorily collected since January 2003 by all NSW public health organisations (except psychiatric, rehabilitation and mothercraft facilities). The same methods used for producing MRSA clinical indicators were used by NSW Health to develop VRE and MRAB clinical indicators.30 NSW Health contracted the ACHS to coordinate 6-monthly data collection of the mandatory MRO clinical indicator rates, analyse the data and provide NSW public hospitals with aggregated rates. Data on MRSA, VRE and MRAB reported to NSW Health were available for the second half of 2005 and the first half of 2007,28 which corresponded with our pre-campaign and post-campaign periods. MRSA clinical indicator rates during the pre- and post-campaign periods were used to establish an association with the hand hygiene campaign. VRE and MRAB rates may fluctuate with changes to patterns of antimicrobial prescribing and environmental contamination more readily than in response to changes in the rate of hand hygiene compliance. Therefore, changes in VRE and MRAB infection rates were examined to test whether there may have been an alternative cause for any changes in MRSA rates during the campaign period.
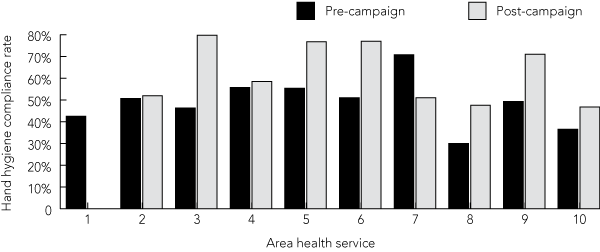
The aggregated hand hygiene compliance rates in the pre- and post-campaign periods were 47% and 61%, respectively (details reported elsewhere).18 Pre-campaign hand hygiene compliance rates in nine area health services (AHSs) that provided data ranged from 30% to 71%, and post-campaign rates ranged from 47% to 80% (Box 2).18 The rates improved significantly in six AHSs, were unchanged in two AHSs, and fell significantly in one AHS. Compared with pre-campaign rates, post-campaign changes ranged from a 20 PP decrease to a 34 PP increase, with an average improvement of 13 PP. In the post-campaign period, the distribution of hand hygiene compliance rates was overdispersed: 71%–80% in four AHSs, 51%–60% in three AHSs, and less than 50% in two AHSs.
Changes to MRSA clinical indicator rates between the pre- and post-campaign periods are shown in Box 3. Two MRSA clinical indicator rates fell significantly, while two remained stable. There was a 16% reduction in new MRSA infections identified from ICU non-sterile sites, from 36.36/10 000 bed-days to 30.43/10 000 bed-days (P = 0.037), and a 25% reduction in MRSA infections from non-ICU sterile sites, from 0.60/10 000 bed-days to 0.45/10 000 bed-days (P = 0.027). Clinical indicator rates for MRSA from ICU sterile sites and non-ICU non-sterile sites did not change significantly.
NSW and Australia-wide changes to MRSA clinical indicator rates reported to the ACHS between 2005 and 2006 are shown in Box 4. Infections from ICU non-sterile sites fell significantly Australia-wide, from 25.89/10 000 bed-days to 14.30/10 000 bed-days (P < 0.001), as did infections from non-ICU non-sterile sites, from 3.70/10 000 bed-days to 1.99/10 000 bed-days (P < 0.001). Australia-wide clinical indicator rates for ICU sterile sites and non-ICU sterile sites remained stable over the same period.
The MRSA infection rate for non-ICU non-sterile sites reported to the ACHS by NSW hospitals in 2005 (5.71/10 000 bed-days) differed significantly from the rate reported to the ACHS in 2006 (3.06/10 000 bed-days) (P = 0.001) (Box 4), but was not significantly different from the rate reported to NSW Health in 2007 (5.66/10 000 bed-days) (P = 0.8) (Box 3).
NSW and Queensland hospitals both experienced significant falls in MRSA infection rates from ICU non-sterile sites and non-ICU non-sterile sites between 2005 and 2006 (Box 4). However, infection rates from ICU sterile sites remained stable in both NSW and Queensland hospitals over this period.
The effect of introducing AHR into all wards of all NSW public hospitals as part of the Clean hands save lives campaign was followed up for 18 months, and by the end of this period, hand hygiene compliance had increased significantly to an average compliance of 61%.17,18,31 But in spite of improved hand hygiene practices, a reduction of only 6% was achieved in the aggregated rates of the four MRSA clinical indicators. Reductions in two of the MRSA clinical indicator rates were more pronounced (ICU non-sterile sites [–16%] and non-ICU sterile sites [–25%]), but no reductions were achieved in clinical indicator rates for the other two sites.
Between 2005 and 2007, NSW hospitals experienced cluster outbreaks of VRE infection that did not continue,28,29 suggesting that containment programs (which would have included environmental cleaning and isolation or cohorting of infected patients) were effective. No specific attempt to control MRAB infections was apparent from statewide MRAB rates.32
Decontaminating hands is accepted as an effective method of breaking the link between the susceptible patient and the infectious reservoir.33 Yet the proof of a causative link between improved hand hygiene and reduced MRSA infection rates is hard to establish, with some claiming there is no firm evidence34-38 and others claiming the opposite.19-25,34-36 Results of the Geneva hand hygiene campaign showed that the annual incidence of MRSA infections declined by 68%, from 0.74/10 000 patient-days in 1994 to 0.24/10 000 patient-days in 1998, when the rate of hand hygiene compliance reached 66%.19 When the Geneva program was introduced into 75 Victorian hospitals, there was a 67% decline in MRSA infection rates, from 0.03/100 patient-days before the intervention to 0.01/100 patient-days 12 months after the intervention.21 Over the same period, the average hand hygiene compliance rate increased from 20% to 53%.21 Our 14 PP improvement in hand hygiene compliance represents 15% of the final level achieved by Victoria.21 A significant decline in MRSA infection rates across Victoria had occurred over a 2-year period prior to the intervention.21 Between 2005 and 2006, MRSA rates reported to the ACHS for non-ICU non-sterile sites fell by 55% in Victoria. A similar decline in MRSA infection rates was observed in Queensland (where no systematised hand hygiene campaign was underway), both in relation to non-ICU non-sterile sites (a 60% fall) and all sites combined (a 48% fall).30
With the exception of two large multi-centre studies that we are aware of,21,22 reduced MRSA infection rates associated with hand hygiene improvements have generally occurred in response to interventions within single facilities.19,20,23-27,34-36 Conducting a program within a single facility may help control for several confounders,33,39 such as isolation policy in relation to MRSA-infected patients, patient-to-nurse ratio, the proportion of admissions and readmissions of elderly patients, average length of stay, and strength of clinical leadership.40
It was not possible in our study to control for the heterogeneity of confounders across 208 hospitals or to achieve a homogeneous level of improvement in hand hygiene compliance that would be required for a substantial decline in MRSA infection rates. Beggs and colleagues39 explored the effects of different levels of dedicated staffing for MRO-infected patients. They clearly identified the need to do away with shared nursing care between infected and uninfected patients.39 Unless nursing staff can achieve hand hygiene compliance of close to 100%, shared care between infected and uninfected patients should be abolished. Given the high number of patient contacts made by nursing staff, it is conceivable that hand hygiene compliance rates will not improve any further in the absence of behavioural change interventions. Rather than focusing primarily on isolation and dedicated cohort nursing of MRO-infected patients, it may be more productive to focus on long-term behavioural change to reduce the risk of transmission to susceptible patients and their environment.39
There has been a call for S. aureus bacteraemia (SAB) rates to be used as a measure of “compliance with appropriate clinical practices”.41,42 But using SAB rates as a proxy measure of hand hygiene compliance would not remove the problem of proof of causation. Two major sources of SAB are the use of intravascular devices and wound infections. Risk of SAB is more likely to be associated with unavoidable femoral venous access for larger non-cuffed temporary dialysis catheters,43 the use of inappropriate femoral (rather than subclavian) insertion for all other central line access requirements,43 the use of non-antimicrobial-coated central lines,44,45 and extended in-situ central line exposure.46 Rather than being independent of poor hand hygiene, these risk factors may act as epidemiological effect modifiers, multiplicatively increasing the risk of SAB or MRSA bacteraemia in the presence of other risk factors such as poor hand hygiene. Possible independent causal factors or effect modifiers for bacteraemia arising from an infected wound include omission of appropriate prophylaxis for surgical patients and breach of the sterile surgical site during the procedure. Other effect modifiers include endogenous acquisition of S. aureus infections (a third of all people in the community carry S. aureus), contact with a contaminated hospital environment by ambulatory patients, and broad-spectrum antibiotic therapy.
Importantly, using simplistic measures of MRO infection or bacteraemia will undervalue and undermine the enormous efforts made by HCWs to sustain improved levels of hand hygiene compliance. Infection control policy aimed at preventing occupational infections involves multiple protective layers. The multiple layers of patient protection from MROs start with sterile equipment, a clean environment, prophylaxis, prudent antimicrobial therapy, isolation of MRO-infected patients, and hand hygiene. The literature supporting a link between hand hygiene compliance and MRSA rates in multicentred interventions is limited.21,22 The conclusion we draw is that the sensitivity of MRSA indicators alone is too low to accurately measure hand hygiene compliance across a large number of hospitals at a state or national level.
If SAB or MRSA bacteraemia were to be linked to hand hygiene performance, multiple indicators would need to be provided concurrently to assist in interpretation of rates, including the use of femoral access, the patient-to-nurse ratio, the proportion of admissions of elderly people, the proportion of readmissions, the average length of stay, the ratio of single- to multibed wards, and an index of administrative support for infection control. A more direct measure of working towards the goal of 100% compliance might be to record the number of times an auditor needs to provide immediate feedback to HCWs who look as if they are about to breach hand hygiene protocol.47
2 Pre- and post-campaign hand hygiene compliance rates across 10 area health services*
 | |||||||||||||||
|
* Area health service 1 did not provide data for the post-campaign period. | |||||||||||||||
3 Rates of MRSA clinical indicators reported by New South Wales public hospitals to NSW Health*
MRSA infection rate/10 000 acute care bed-days [n/N] |
|||||||||||||||
- Mary-Louise McLaws1
- Annette C Pantle2
- Kimberley R Fitzpatrick2
- Clifford F Hughes2
- 1 Hospital Infection Epidemiology and Surveillance Unit, School of Public Health and Community Medicine, University of New South Wales, Sydney, NSW.
- 2 Clinical Excellence Commission, Sydney, NSW.
Our project was a joint initiative of the Clinical Excellence Commission and NSW Health.
Mary-Louise McLaws has joined the WHO First Global Patient Safety Challenge pilot country project to provide epidemiological advice. Clifford Hughes operates the Australia and New Zealand Heart Valve Registry, which tracks patients with a Björk-Shiley convexo/concave heart valve. He distributes guidelines to these patients through their doctors as developed by the medical supervisory panel of the Bowling–Pfizer Heart Valve Settlement. He is the Principal Investigator of the On-X Heart Valve Study in Australia, for which On-X Life Technologies pays the expenses. He has received funding from Roche Diagnostics for travel expenses to attend meetings.
- 1. Rountree PM, Thomas EF. Incidence of penicillin-resistant and streptomycin-resistant staphylococci in a hospital. Lancet 1949; 2: 501-504.
- 2. Rountree PM, Beard MA. Observations on the distribution of Staphylococcus aureus in the atmosphere of a surgical ward. J Hyg (Lond) 1962; 60: 387-400.
- 3. McDonald PJ. Methicillin-resistant staphylococci: a sign of the times? Med J Aust 1982; 1: 445-446.
- 4. King K, Brady L, Thomson M, Harkness JL. Antibiotic-resistant staphylococci in a teaching hospital. Med J Aust 1982; 2: 461-465.
- 5. Pavillard R, Harvey K, Douglas D, et al. Epidemic of hospital-acquired infection due to methicillin-resistant Staphylococcus aureus in major Victorian hospitals. Med J Aust 1982; 1: 451-454.
- 6. McLaws ML, Irwig LM, Mock P, et al. Predictors of surgical wound infection in Australia: a national study. Med J Aust 1988; 149: 591-595.
- 7. Meers PD, Ayliffe GAJ, Emmerson AM, et al. Report on national survey of infection in hospitals, 1980. J Hosp Infect 1981; 2 Suppl: 1-51.
- 8. Jarvis WR, White JW, Munn VP, et al. Nosocomial infections surveillance, 1983. MMWR CDC Surveill Summ 1984; 33 (2SS): 9ss-21ss.
- 9. McLaws ML, Taylor P. The Hospital Infection Standardised Surveillance (HISS) programme: analysis of a two-year pilot. J Hosp Infect 2003; 53: 259-267.
- 10. Nimmo GR, Pearson JC, Collignon PJ, et al. Prevalence of MRSA among Staphylococcus aureus isolated from hospital inpatients, 2005: report from the Australian Group for Antimicrobial Resistance. Commun Dis Intell 2007; 31: 288-296.
- 11. Nimmo GR, Bell JM, Mitchell D, et al; Australian Group for Antimicrobial Resistance. Antimicrobial resistance in Staphylococcus aureus in Australian teaching hospitals, 1989–1999. Microb Drug Resist 2003; 9: 155-160.
- 12. Nimmo GR, Coombs GW, Pearson JC, et al. Methicillin-resistant Staphylococcus aureus in the Australian community: an evolving epidemic. Med J Aust 2006; 184: 384-388. <MJA full text>
- 13. Munckhof WJ, Nimmo GR, Carney J, et al. Methicillin-susceptible, non-multiresistant methicillin-resistant and multiresistant methicillin-resistant Staphylococcus aureus infections: a clinical, epidemiological and microbiological comparative study. Eur J Clin Microbiol Infect Dis 2008; 27: 355-364.
- 14. Nimmo GR, Coombs GW. Community-associated methicillin-resistant Staphylococcus aureus (MRSA) in Australia. Int J Antimicrob Agents 2008; 31: 401-410.
- 15. Clinical Excellence Commission. Clean hands save lives. Final report of the NSW Hand Hygiene Campaign. Sydney: NSW Health, 2007. http://www.cec.health.nsw.gov.au/programs/clean-hands.html#publications2 (accessed Sep 2009).
- 16. Pittet D, Donaldson L. Clean care is safer care: the first global challenge of the WHO World Alliance for Patient Safety. Am J Infect Control 2005; 33: 476-479.
- 17. Pantle AC, Fitzpatrick KR, McLaws ML, Hughes CF. A statewide approach to systematising hand hygiene behaviour in hospitals: Clean hands save lives, Part I. Med J Aust 2009; 191 (8 Suppl): S8-S14. <MJA full text>
- 18. McLaws ML, Pantle AC, Fitzpatrick KR, Hughes CF. Improvements in hand hygiene across New South Wales public hospitals: Clean hands save lives, Part III. Med J Aust 2009; 191 (8 Suppl): S18-S25. <MJA full text>
- 19. Pittet D, Hugonnet S, Harbarth S, et al. Effectiveness of a hospital-wide programme to improve compliance with hand hygiene. Infection Control Programme. Lancet 2000; 356: 1307-1312.
- 20. Johnson PDR, Martin R, Burrell LJ, et al. Efficacy of an alcohol/chlorhexidine hand hygiene program in a hospital with high rates of nosocomial methicillin-resistant Staphylococcus aureus (MRSA) infection. Med J Aust 2005; 183: 509-514. <MJA full text>
- 21. Grayson ML, Jarvie LJ, Martin R, et al. Significant reductions in methicillin-resistant Staphylococcus aureus bacteraemia and clinical isolates associated with a multisite, hand hygiene culture-change program and subsequent successful statewide roll-out. Med J Aust 2008; 188: 633-640. <MJA full text>
- 22. Stone SP, Beric V, Quick A, et al. The effect of an enhanced infection-control policy on the incidence of Clostridium difficile infection and methicillin-resistant Staphylococcus aureus colonization in acute elderly medical patients. Age Ageing 1998; 27: 561-568.
- 23. Schelenz S, Tucker D, Georgeu C, et al. Significant reduction of endemic MRSA acquisition and infection in cardiothoracic patients by means of an enhanced targeted infection control programme. J Hosp Infect 2005; 60: 104-110.
- 24. Kac G, Buu-Hoï A, Hérisson E, et al. Methicillin-resistant Staphylococcus aureus. Nosocomial acquisition and carrier state in a wound care center. Arch Dermatol 2000; 136: 735-739.
- 25. Gordin FM, Schultz ME, Huber RA, Gill JA. Reduction in nosocomial transmission of drug-resistant bacteria after introduction of an alcohol-based handrub. Infect Control Hosp Epidemiol 2005; 26: 650-653.
- 26. MacDonald A, Dinah F, MacKenzie D, Wilson A. Performance feedback of hand hygiene, using alcohol gel as the skin decontaminant, reduces the number of inpatients newly affected by MRSA and antibiotic costs. J Hosp Infect 2004; 56: 56-63.
- 27. Albert RK, Condie F. Hand-washing patterns in medical intensive-care units. N Engl J Med 1981; 304: 1465-1466.
- 28. NSW Health. Infection control program quality monitoring. Circular 2002/104. Sydney: NSW Health, 2002.
- 29. NSW Health. Healthcare associated infection: clinical indicator manual. Version 2, November 2008. http://www.health.nsw.gov.au/hospitals/hai/index.asp (accessed Sep 2009).
- 30. Australian Council on Healthcare Standards. Australasian clinical indicator report 1998–2006. Determining the potential to improve quality of care. 8th ed. Sydney: ACHS, 2007.
- 31. Fitzpatrick KR, Pantle AC, McLaws ML, Hughes CF. Culture change for hand hygiene: Clean hands save lives, Part II. Med J Aust 2009; 191 (8 Suppl): S13-S18. <MJA full text>
- 32. Lam BC, Lee J, Lau YL. Hand hygiene practices in a neonatal intensive care unit: a multimodal intervention and impact on nosocomial infection. Pediatrics 2004; 114: e565-e571.
- 33. Clements A, Halton K, Graves N, et al. Overcrowding and understaffing in modern health-care systems: key determinants in methicillin-resistant Staphylococcus aureus transmission. Lancet Infect Dis 2008; 8: 427-434.
- 34. Ng PC, Wong HL, Lyon DJ, et al. Combined use of alcohol hand rub and gloves reduces the incidence of late onset infection in very low birthweight infants. Arch Dis Child Fetal Neonatal Ed 2004; 89: F336-F340.
- 35. Aragon D, Sole ML, Brown S. Outcomes of an infection prevention project focusing on hand hygiene and isolation practices. AACN Clin Issues 2005; 16: 121-132.
- 36. Brittain B. MRSA control: a simple approach using triclosan antiseptic wash. Aust Infect Control 2004; 9: 65-72.
- 37. Larson EL, Early E, Cloonan P, et al. An organizational climate intervention associated with increased handwashing and decreased nosocomial infections. Behav Med 2000; 26: 14-22.
- 38. Mody L, McNeil SA, Sun R, et al. Introduction of a waterless alcohol-based hand rub in a long-term-care facility. Infect Control Hosp Epidemiol 2003; 24: 165-171.
- 39. Beggs CB, Noakes CJ, Shepherd SJ, et al. The influence of nurse cohorting on hand hygiene effectiveness. Am J Infect Control 2006; 34: 621-626.
- 40. Whitby M, McLaws ML, Slater K, et al. Three successful interventions in healthcare workers that improve compliance with hand hygiene: is sustained replication possible? Am J Infect Control 2008; 36: 349-355.
- 41. Collingon PJ, Wilkinson IJ, Gilbert GL, et al. Health care-associated Staphylococcus aureus bloodstream infections: a clinical quality indicator for all hospitals. Med J Aust 2006; 184: 404-406. <MJA full text>
- 42. Cruickshank M, Ferguson J, editors. Reducing harm to patients from health care associated infection: the role of surveillance. Canberra: Australian Commission on Safety and Quality in Health Care, 2008. http://www.safetyandquality.gov.au/internet/safety/publishing.nsf/Content/202C676D8BA38757CA25748D007F C3DC/$File/FullFinal-ReducingHarm.PDF (accessed Feb 2009).
- 43. Nagashima G, Kikuchi T, Tsuyuzaki H, et al. To reduce catheter-related bloodstream infections: is the subclavian route better than the jugular route for central venous catheterization? J Infect Chemother 2006; 12: 363-365.
- 44. O’Grady NP, Alexander M, Dellinger EP, et al. Guidelines for the prevention of intravascular catheter-related infections. Centers for Disease Control and Prevention. MMWR Recomm Rep 2002; 51 (RR-10): 1-29.
- 45. Marin M, Lee J, Skurnick J. Prevention of nosocomial bloodstream infections: effectiveness of antimicrobial-impregnated and heparin-bonded central venous catheters. Crit Care Med 2000; 28: 3332-3338.
- 46. McLaws ML, Berry G. Nonuniform risk for bloodstream infection with increasing central venous catheter-days. Infect Control Hosp Epidemiol 2005; 26: 715-719.
- 47. Sax H, Allegranzi B, Uçkay I, et al. “My five moments for hand hygiene”: a user-centred design approach to understand, train, monitor and report hand hygiene. J Hosp Infect 2007; 67: 9-21.
Abstract
Objective: To examine whether improved hand hygiene compliance in health care workers after a statewide hand hygiene campaign in New South Wales hospitals was associated with a fall in rates of infection with multiresistant organisms.
Design and setting: Data on rates of new methicillin-resistant Staphylococcus aureus (MRSA) infections (expressed as four clinical indicators) are reported by some Australian hospitals to the Australian Council on Healthcare Standards (ACHS) for accreditation purposes and are mandatorily reported by all NSW hospitals to the NSW Department of Health. Infections are classified according to whether they are acquired in the intensive care unit (ICU) or other wards and whether they are from sterile sites (blood cultures) or non-sterile sites. The clinical indicators reflect four different site categories (ICU sterile site, ICU non-sterile site, non-ICU sterile site and non-ICU non-sterile site) and are expressed as the number of new health care-associated infections per 10 000 acute care bed-days. Clinical indicator rates were examined for any decline between the pre-campaign period (July–December 2005) and post-campaign period (January–July 2007), and were compared with trends over a similar period in states without a hand hygiene campaign.
Main outcome measures: Pre-campaign and post-campaign rates for four MRSA clinical indicators.
Results: Between the pre- and post-campaign periods, there was a 25% fall in MRSA non-ICU sterile site infections, from 0.60/10 000 bed-days to 0.45/10 000 bed-days (P = 0.027), and a 16% fall in ICU non-sterile site infections, from 36.36/10 000 bed-days to 30.43/10 000 bed-days (P = 0.037). The pre- and post-campaign rates of MRSA infection from ICU sterile sites (5.28/10 000 bed-days v 4.80/10 000 bed-days; P = 0.664) and non-ICU non-sterile sites (5.92/10 000 bed-days v 5.66/10 000 bed-days; P = 0.207) remained stable. Australia-wide MRSA data reported to the ACHS showed a 45% decline in infections from ICU non-sterile sites, from 25.89/10 000 bed-days to 14.30/10 000 bed-days (P < 0.001), and a 46% decline in infections from non-ICU non-sterile sites, from 3.70/10 000 bed-days to 1.99/10 000 bed-days (P < 0.001) over the period 2005–2006.
Conclusion: Two out of four clinical indicators of MRSA infection remained unchanged despite significant improvements in hand hygiene compliance in NSW hospitals. The reduction in MRSA infections from ICU non-sterile sites in NSW hospitals was mirrored in ACHS data for other Australian states and cannot be assumed to be the result of improved hand hygiene compliance. Concurrent clinical and infection control practices possibly influence MRSA infection rates and may modify the effects of hand hygiene compliance. More sensitive measurements of hand hygiene compliance are needed.