


The life expectancy of Indigenous Australians is about 17 years lower than the life expectancy in the general Australian population.1 Consistent reports on the Indigenous–non-Indigenous health disparity have contributed to pessimism about the potential to reduce mortality among Indigenous people. Yet changes in Indigenous mortality might be expected because of changes in background risk factors, such as falling infection rates, increasing birthweights2,3 and improvements in disease management, since the mid 1990s.4,5 Chronic disease care, for example, has changed markedly, with the introduction of disease screening programs and more systematic management of those affected.6,7
While studies examining relatively short time periods have reported little or no improvement in Indigenous health,8-10 a decline in Indigenous mortality in all age groups and both sexes in the Northern Territory was reported over the longer interval of 1967–2000.11 However, the relative gap in mortality between Indigenous and non-Indigenous Australians increased during the study period. Another NT study12 found that the increase in death rates from ischaemic heart disease and diabetes mellitus among Indigenous people slowed significantly after 1990, the mortality rate from renal failure fell for those aged under 50 years, and there were also non-significant declines in death rates from cardiovascular disease and rheumatic heart disease. Substantial improvements in Indigenous life expectancy in the NT from the late 1960s to the present have also been reported.13
A more complete understanding of chronic disease mortality patterns would be valuable for planning future health strategies. Because reliance solely on the underlying cause of death greatly underestimates the associations of diabetes (and particularly renal disease) with deaths,14 and because remote communities are said to be at the greatest health disadvantage,15 mortality analyses should take into account multiple causes of death and the remoteness of residence.
The NT provides a unique place for studies on Indigenous health because it has the largest proportion of Indigenous people as a percentage of the total population, particularly in remote areas,16 and because the health of the Indigenous population is believed to be worse than in other states and territories.17 In addition, Indigenous identification is almost complete,1 which reduces the impact of misclassification on the results.
From the Australian Bureau of Statistics (ABS) we obtained mortality data in the form of de-identified unit record files for all deaths of NT residents (by place of primary residence) that were registered in Australia from 1998 to 2003. The ABS also provided estimates of the total resident16 and Aboriginal and Torres Strait Islander18 populations during the study period by the place of usual residence (ie, the “address at which the person has lived or intends to live for a total of 6 months or more” in the year the question is asked).19 Indigenous status has been included on NT death notification forms since 1988,1 and multiple causes-of-death data have been compiled in Australia since 1997.20 Coverage of Indigenous deaths in the NT is the best in the country, ranging from 88% to 94% during the study period.1
In multiple causes-of-death analyses, the “underlying cause” is defined as the disease or condition that led directly to death.20 The term “multiple causes” refers to causes of death mentioned anywhere on the death certificate, including the underlying cause.20 Causes of death for our study were defined in accordance with the International classification of diseases (10th revision) as follows:
Cardiovascular disease: codes I10, I11, I15, I20–I25, I42, I44–I52, I60–I74;
Diabetes: codes E10, E11, E13, E14; and
Renal disease: codes E10.2, E11.2, E12.2, E13.2, E14.2, I12, I13, I15.0, I15.1, I70.1, N00–N29, N39, R80–R82.
We also analysed deaths from external causes, which are strongly linked to risky behaviour.
The categories of remoteness used were based on the Accessibility/Remoteness Index of Australia (ARIA)21 obtained from the Australian Institute of Health and Welfare. The ARIA defines remoteness based on the distance that people must travel along a road network to get to a service centre, which is defined as a centre with a population > 5000. The NT has the three following classes of remoteness (average ARIA index values are given in brackets): outer regional areas (ORAs) (2.4 to < 5.95), remote areas (RAs) (5.95 to < 10.5), and very remote areas (VRAs) (≥ 10.5).
For example, the suburbs of Darwin are classified as ORAs; Alice Springs, Jabiru and Katherine are classified as RAs; and Bathurst and Melville islands, Tennant Creek, East and West Arnhem, and communities around the Gulf of Carpentaria are classified as VRAs. The ARIA concept of remoteness is subject to criticism because the index relies on road distance as a surrogate for remoteness and on population size as a surrogate for the availability of services. The index does not look at which services are available in a given town.21 But, despite this criticism, and in the absence of any more definitive nomenclature, the ABS believes that this classification of remoteness is simple and sound for statistical purposes.21 The ARIA index is discussed in more detail elsewhere.21
Our analyses were restricted to people aged 25 years or over, as deaths from cardiovascular disease, diabetes and renal disease were uncommon in younger people. Changes in mortality were investigated by dividing the study interval into two 3-year periods: 1998–2000 and 2001–2003. Average annual death rates were calculated as the average number of deaths per year during the 3-year study period, divided by the population in the middle of the period and age-adjusted to the 2001 total Australian population. Ninety-five per cent confidence intervals for age-standardised rates were calculated using normal approximation, and standard errors were obtained using the method described by Breslow and Day.22 Because of overdispersion of death data, the average annual change in death rates over the entire 6-year period was estimated by negative binomial regression rather than Poisson regression. Differences in age structures between the Indigenous population and the general Australian population were accounted for by calculating standardised mortality ratios (SMRs: ratios of observed to expected deaths) through indirectly standardising Indigenous death rates to the 2001 general Australian population. An SMR of over 100% means that compared with the general Australian population there were more deaths than expected. All analyses were conducted using Stata software, version 9 (Stata Corporation, College Station, Tex, USA).
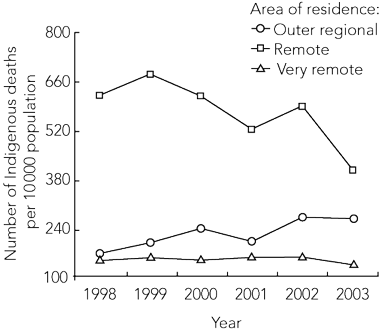
Age-adjusted rates of Indigenous mortality due to all causes, cardiovascular disease, diabetes and renal disease are shown in Box 1. For all the analysed causes of death, Indigenous people in RAs experienced much higher mortality rates during both 3-year periods than those in ORAs and VRAs, with those in VRAs having the lowest rates. For example, in 1998–2000, the age-standardised number of deaths per 10 000 population per year for all-cause mortality was 195.6 (95% CI, 127.1, 264.0) in ORAs, 633.3 (95% CI, 529.7, 736.9) in RAs and 151.1 (95% CI, 122.1, 180.2) in VRAs. In 2001–2003, the corresponding numbers were 243.8 (95% CI, 169.5, 318.1), 503.7 (95% CI, 415.5, 591.8) and 149.1 (95% CI, 121.5, 176.7). The distribution of mortality from accidents, suicide and homicide by remoteness of residence was similar to the pattern of mortality from the analysed chronic diseases, with death rates strikingly higher in RAs and lowest in VRAs (Box 1). Over the period of our study, death rates increased in ORAs but declined in RAs. In VRAs, the rates were largely stable (Box 1).
The greatest disparity in mortality between Indigenous Australians and the general population was in RAs, which had by far the highest mortality rates (Box 2). In RAs, SMRs for all-cause mortality were 875% in 1998–2000 and 731% in 2001–2003. The corresponding SMRs were 285% and 325% in ORAs and 214% and 208% in VRAs. In ORAs, the disparity in mortality between Indigenous Australians and the general population increased for deaths from diabetes (from 833% to 925%) and renal disease (from 600% to 1060%). The disparity in mortality from external causes was also highest in RAs (Box 2). Overall during the study period, SMRs increased in ORAs but decreased in RAs. In VRAs, SMRs were mostly fairly stable.
Average annual percentage changes in all-cause death rates over the full 6-year period (Box 3) were significant in RAs (–5.3%) but not in ORAs (4.4%) or VRAs (1.1%). A similar pattern was observed for cardiovascular mortality. Average annual percentage changes in deaths from diabetes, renal disease and external causes were not significant in any remoteness area. The fall in death rates in RAs was due to both an increase in the number of Indigenous people and a decrease in the number of actual deaths (Box 4, Box 5).
In both the first and second 3-year periods, death rates in the NT from all causes, cardiovascular disease, diabetes and renal disease were higher in the Indigenous population than in the general Australian population. However, mortality among Indigenous people was much higher in RAs than in ORAs or VRAs. Age-standardised Indigenous death rates were about three times higher in ORAs, and seven to nine times higher in RAs, than those of Australians nationwide. VRAs had the lowest mortality rates, which, with age adjustment, were about twice the Australian average.
Compared with analyses by the underlying cause, analyses of deaths by multiple causes allowed a much more complete description of mortality, particularly mortality from diabetes and renal disease, which are less likely to be reported as the underlying cause of death.14 Near-complete Indigenous identification in the NT,1 particularly in RAs,15 also minimised the impact of misclassification on our findings. The artefact of late registration of deaths was unlikely to significantly affect the patterns of mortality or the validity of the study overall, as we included in the analyses deaths that occurred in 2003 but were not registered until 2004.
Thus, the issue of migration of Indigenous people is crucial to accurate interpretation of the findings. Some limited research suggests that Indigenous migration is characterised by marked inter- and intra-community mobility, with circular movements within an area or region.23 However, it suggests low rates of net migration of groups in remote and northern Australia, as indicated by changes in residential address in the previous 5 years (permanent migration).23
A recent study showing lower than expected cardiovascular disease morbidity and mortality for a decentralised Aboriginal community in the NT24 supports the possibility of better health in VRAs. This might be attributed to various factors, including a more favourable social environment,25 better family support, increased physical activity,26,27 a healthier diet,28 and lowered rates of substance misuse29 and alcohol misuse.25 It is noteworthy that Indigenous death rates from external causes were also lowest in VRAs in our study.
Causes of downward trends in mortality in RAs are also largely speculative. Chronic diseases such as cardiovascular disease, diabetes and renal disease are linked to a sedentary lifestyle, poor nutrition,30 excessive alcohol consumption,31 low birthweight, infections, cigarette smoking, poverty and educational disadvantage. These factors continue to evolve and might partly explain changes in deaths from chronic disease. An increase in birthweights between the 1960s and 1980s2,3 and a reduced incidence of infections32,33 are among the possible ameliorating factors. The relatively recent expansion of chronic disease prevention and treatment programs should be having a positive effect, which is potentially most evident among people and communities with the highest rates of disease. Health promotion programs targeting nutrition, exercise, smoking and alcohol might be other contributing factors.34,35
1 Average annual age-standardised rates (95% CI) of all-cause and cause-specific Indigenous mortality (per 10 000 population), by remoteness category, Northern Territory, 1998–2003*
* Rates are standardised to the 2001 total Australian population. |
|||||||||||||||
2 Standardised mortality ratios* (95% CI) for all-cause and cause-specific Indigenous mortality, by remoteness category, Northern Territory, 1998–2003†
3 Average annual percentage change* (95% CI) in Indigenous mortality, by remoteness category, Northern Territory, 1998–2003
* Percentages were calculated by negative binomial regression. |
|||||||||||||||
Received 6 March 2008, accepted 26 August 2008
- Karen Andreasyan1
- Wendy E Hoy2
- Centre for Chronic Disease, University of Queensland, Royal Brisbane and Women’s Hospital, Brisbane, QLD.
Our work was supported by a National Health and Medical Research Council (NHMRC) program grant and the Colonial Foundation of Australia.
None identified.
- 1. Australian Bureau of Statistics. Deaths, Australia, 2005. Canberra: ABS, 2005. (ABS Cat. No. 3302.0.)
- 2. Hoy WE, Rees M, Kile E, et al. Low birthweight and renal disease in Australian aborigines. Lancet 1988; 352: 1826-1827.
- 3. Northern Territory Department of Health. Maternal and infant mortality in the Northern Territory 1974–1979. Darwin: NT DoH, 1980. (Supplement to Bulletin No. 26.)
- 4. Clearing House for Indigenous Rural and Remote Programs, Queensland Health. Business plan year 3: implementation of the enhanced model of primary health care. Cairns: CHIRRP, 2004.
- 5. Hoy WE, Kondalsamy-Chennakesavan S, Scheppingen J, et al. A chronic disease outreach program for Aboriginal communities. Kidney Int Suppl 2005; (98): S76-S82.
- 6. Central Australian Rural Practitioners Association. CARPA standard treatment manual. 4th ed. Alice Springs: CARPA, 2003.
- 7. Hoy WE, Kondalsamy-Chennakesavan S, Smith J, et al. Setting up chronic disease programs: perspectives from Aboriginal Australia. Ethn Dis 2006; 16 (2 Suppl 2): S73-S78.
- 8. Australian Medical Association. Public report card 2002. Aboriginal and Torres Strait Islander Health: no more excuses. Canberra: AMA, 2002. http://www.ama.com.au/node/3188#end_of_page (accessed Feb 2009).
- 9. Hayman N. The poor health status of Aboriginal and Torres Strait Islander peoples. Can Indigenous doctors make a difference? New Doctor 1999; 70: 19-21.
- 10. Ring IT, Brown N. Indigenous health: chronically inadequate responses to damning statistics. Med J Aust 2002; 177: 629-631. <MJA full text>
- 11. Condon JR, Barnes T, Cunningham J, Smith L. Improvements in Indigenous mortality in the Northern Territory over four decades. Aust N Z J Public Health 2004; 28: 445-451.
- 12. Thomas DP, Condon JR, Anderson IP, et al. Long-term trends in Indigenous deaths from chronic diseases in the Northern Territory: a foot on the brake, a foot on the accelerator. Med J Aust 2006; 185: 145-149.
- 13. Wilson T, Condon JR, Barnes T. Northern Territory indigenous life expectancy improvements, 1967–2004. Aust N Z J Public Health 2007; 31: 184-188.
- 14. Andreasyan K, Hoy WE. Renal-related deaths in Indigenous people in Queensland, Australia. Nephrology (Carlton) 2007; 12: 514-519.
- 15. Australian Institute of Health and Welfare. Rural, regional and remote health: a study on mortality. Canberra: AIHW, 2003. (AIHW Cat. No. PHE 45; Rural Health Series No. 2.)
- 16. Australian Bureau of Statistics. Population by age and sex, Australian states and territories. Canberra: ABS, 2001. (ABS Cat. No. 3201.0.)
- 17. Australian Bureau of Statistics. The health and welfare of Australia’s Aboriginal and Torres Strait Islander people. Canberra: ABS, 2005. (ABS Cat. No. 4704.0.)
- 18. Australian Bureau of Statistics. Experimental projections of the Aboriginal and Torres Strait Islander populations, 1996–2006. Canberra: ABS, 1998. (ABS Cat. No. 3231.0.)
- 19. Australian Bureau of Statistics. Demographic estimates and projections: concepts, sources and methods, 1999. Canberra: ABS, 1999. (ABS Cat. No. 3228.0.)
- 20. Australian Bureau of Statistics. Multiple cause of death analysis, 1997–2001. Canberra: ABS, 2003. (ABS Cat. No. 3319.0.55.001.)
- 21. Australian Bureau of Statistics. Information paper: ABS views on remoteness. Canberra: ABS, 2001. (ABS Cat. No. 1244.0.)
- 22. Breslow NE, Day NE. Statistical methods in cancer research. Vol II. The design and analysis of cohort studies. Lyon: International Agency for Research on Cancer, 1987.
- 23. Memmott P, Long S, Thomson L. Indigenous mobility in rural and remote Australia. Brisbane: Australian Housing and Urban Research Institute, Queensland Research Centre, 2006. (AHURI Final Report No. 90.)
- 24. Rowley KG, O’Dea K, Anderson I, et al. Lower than expected morbidity and mortality for an Australian Aboriginal population: 10-year follow-up in a decentralised community. Med J Aust 2008; 188: 283-287. <MJA full text>
- 25. McDermott R, O’Dea K, Rowley K, et al. Beneficial impact of the homelands movement on health outcomes in central Australian aborigines. Aust N Z J Public Health 1998; 22: 653-658.
- 26. O’Dea K. Marked improvement in carbohydrate and lipid metabolism in diabetic Australian Aborigines after temporary reversion to traditional lifestyle. Diabetes 1984; 33: 596-603.
- 27. O’Dea K, White NG, Sinclair AJ. An investigation of nutrition-related risk factors in an isolated Aboriginal community in northern Australia: advantages of a traditionally-orientated life-style. Med J Aust 1988; 148: 177-180.
- 28. Naughton JM, O’Dea K, Sinclair AJ. Animal foods in traditional Australian aboriginal diets: polyunsaturated and low in fat. Lipids 1986; 21: 684-690.
- 29. Burgess CP, Johnston FH, Bowman DM, Whitehead PJ. Healthy country: healthy people? Exploring the health benefits of indigenous natural resource management. Aust N Z J Public Health 2005; 29: 117-122.
- 30. Rowley KG, Daniel M, Skinner K, et al. Effectiveness of a community-directed “healthy lifestyle” program in a remote Australian aboriginal community. Aust N Z J Public Health 2000; 24: 136-144.
- 31. Smith RM, Spargo RM, Hunter EM, et al. Prevalence of hypertension in Kimberley Aborigines and its relationship to ischaemic heart disease. An age-stratified random survey. Med J Aust 1992; 156: 557-562.
- 32. Coory M, Johnston T. Trends in the annual prevalence of hospitalisation for remote Indigenous communities in Queensland, 1997/98 to 2004/05. Aust N Z J Public Health 2006; 30: 440-443.
- 33. Gracey M, Cullinane J. Gastroenteritis and environmental health among Aboriginal infants and children in Western Australia. J Paediatr Child Health 2003; 39: 427-431.
- 34. Australian Government Department of Health and Ageing. National Diabetes Strategy. http://www.health.gov.au/internet/main/publishing.nsf/Content/pq-diabetes-strat (accessed Feb 2009).
- 35. Strategic Inter-Governmental Nutrition Alliance (SIGNAL). National Aboriginal and Torres Strait Islander nutrition strategy and action plan: a summary 2000–2010. Canberra: National Public Health Partnership, 2001.
Abstract
Objective: To quantify Indigenous mortality in the Northern Territory by remoteness of residence.
Design, setting and participants: Australian Bureau of Statistics mortality data were used to compare rates of death from chronic disease in the NT Indigenous population with rates in the general Australian population over the period 1998–2003. Rates were evaluated by categories of remoteness based on the Accessibility/Remoteness Index of Australia: outer regional areas (ORAs), remote areas (RAs) and very remote areas (VRAs).
Main outcome measures: Mortality from cardiovascular disease, diabetes and renal disease; standardised mortality ratios (SMRs); percentage change in annual death rates; changes in mortality between 1998–2000 and 2001–2003.
Results: In 1998–2000, SMRs for all-cause mortality were 285% in ORAs, 875% in RAs and 214% in VRAs. In 2001–2003, corresponding SMRs were 325%, 731% and 208%. For the period 1998–2003, percentage changes in annual all-cause mortality were 4.4% (95% CI, –2.2%, 11.5%) in ORAs, –5.3% (95% CI, –9.6%, –0.8%) in RAs, and 1.1% (95% CI, –7.2%, 11.3%) in VRAs. In 2001–2003, compared with 1998–2000, changes in the number of Indigenous deaths were +35 in ORAs, –37 in RAs and +32 in VRAs. Similar patterns were observed for cardiovascular mortality.
Conclusions: Compared with mortality in the general Australian population, Indigenous mortality was up to nine times higher in RAs, three times higher in ORAs and two times higher in VRAs. The fact that rates were lowest in VRAs runs contrary to claims that increasing remoteness is associated with poorer health status. Despite the high death rate in RAs, there was a downward trend in mortality in RAs over the study period. This was partly attributable to a fall in the absolute number of deaths.