


Cardiovascular disease (CVD) accounts for 18% of the total burden of disease in Australia,1 and the burden of CVD is higher in rural areas.2 Large clinical trials have demonstrated that treatment of hypercholesterolaemia is effective in both primary and secondary prevention of CVD,3,4 and target lipid goals have been progressively lowered, reflecting recent trial evidence. Treatment of hyperlipidaemia should be based on assessment of global CVD risk rather than plasma cholesterol levels alone, as high-risk groups benefit most.5
Little is known about the prevalence of risk factors or treatment patterns for CVD in rural areas.2 This is the first report of rural Australian population lipid levels, hyperlipidaemia awareness and assessment of adherence to more recent 20015 and 20056 Australian guidelines.
Three cross-sectional population surveys of chronic disease risk factors and related health behaviour were undertaken in the Greater Green Triangle region in South Australia and Victoria, in 2004–2006; these have been described previously.7,8 Each survey took a random sample from the electoral roll of people aged 25 to 74 years, stratified by 10-year age group and sex, with the exception of those aged 25–44 years, who were considered as one stratum. Strata sample sizes were 140 from the Limestone Coast (2004), 125 from Corangamite (2005) and 150 in Wimmera (2006). Analysis for this article was performed on data from participants who had all information required for 5-year CVD risk calculation. Aboriginal and Torres Strait Islander participants (n = 11) were not included in this analysis due to under-representation in the surveys and as the available risk calculators, based on Framingham data, have not been validated for use in this population.6
The survey methodology closely followed the World Health Organization MONICA (multinational MONItoring of trends and determinants in CArdiovascular disease) Project protocol and European Health Risk Monitoring recommendations.9,10 A postal questionnaire examined history of chronic disease, medication use and lifestyle habits. Health checks, including anthropometric measurements and venous blood sampling (after fasting for ≥ 10 hours), were carried out at survey sites by specially trained nurses. Blood samples were analysed at Flinders Medical Centre Clinical Trials Laboratory.7
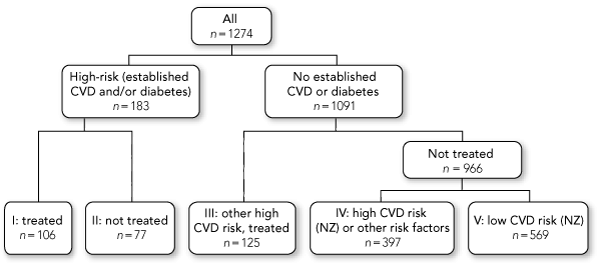
Participants were divided into five mutually exclusive groups based on presence of established CVD or diabetes, lipid-lowering treatment, and CVD risk (Box 1). The 2001 guideline therapeutic target levels used were < 4 mmol/L for total cholesterol (TC), < 2.5 mmol/L for low-density lipoprotein cholesterol (LDL-C), > 1.0 mmol/L for high-density lipoprotein cholesterol (HDL-C) and < 2.0 mmol/L for triglycerides (TG) updated to < 1.5 mmol/L for TG in the 2005 guidelines.5,6 The extent to which a lower 2007 guideline LDL-C target (< 2.0 mmol/L) was achieved among patients with established CVD or diabetes, was also examined.11 These cut-off levels differ from those used to define metabolic syndrome.7
Ethics approval was received from the Flinders Clinical Research Ethics Committee.
Overall, 3320 individuals were selected. After excluding 108 who had died or had left the area, there were 1563 participants (48.7%). Information on blood lipids, lipid-lowering medication, CVD risk, and history of CVD and diabetes was available for 1274 participants (40% of sample). Categorisation of participants is shown in Box 2. Overall population-weighted mean TC concentration was 5.38 mmol/L (95% CI, 5.30–5.45). Box 3 shows detailed results by age and sex. TC concentration exceeded 5.5 mmol/L for 39% of participants and 6.5 mmol/L for 13%. A wider definition of hypercholesterolaemia, constituting those with a TC concentration > 5.5 mmol/L or on cholesterol-lowering medication, gave a prevalence of 48%.
In total, 231 participants (12% population weighted) reported using lipid-lowering medication (Box 2). Of the 208 for whom lipid-lowering medication details were known, 199 (96%) were using statin mono-therapy. Of the 1043 participants who were not treated, 77 (7%) had established vascular disease or diabetes, 397 (38%) had high 5-year risk of CVD and 569 (55%) had low 5-year risk.
Untreated high-risk participants without CVD or diabetes (Group IV) had a mean TC level of 6.37 mmol/L and a mean LDL-C level of 4.14 mmol/L (Box 4). Between 19% and 30% of untreated high-risk individuals (groups II and IV, respectively) reported doctor-diagnosed high cholesterol. Almost all individuals being treated had their cholesterol measured in the previous year, compared with about half for untreated high-risk participants. Overall, three-quarters of participants aged 45 years or older had their cholesterol measured in the previous 5 years.
Three per cent of the high-risk study population had all lipids at target (Box 5). HDL-C and 2001 TG target levels were reached by most high-risk participants. TC and LDL-C levels were largely inadequate; treated patients with established CVD or diabetes (Group I) were most likely to be controlled.
Box 6 compares lipid levels from our study with those found in previous Australian studies.
The National Health and Hospitals Reform Commission (NHHRC) has proposed tracking national progress towards tackling health inequities.16 Ample evidence exists to show that access to services is poorer in rural and remote areas than in metropolitan areas. Differences exist in statin prescribing in Australia after adjusting for age, sex and socioeconomic circumstance, with the highest prescribing rates seen in metropolitan areas.17 The NHHRC has proposed the establishment of a National Prevention Agency to build an evidence base, with the capacity and infrastructure to report on progress towards achieving better health outcomes.
The participation rate in our study was low, so some caution is needed when interpreting the results. A comparison of the socioeconomic background — including primary occupation, rate of unemployment and total gross income of the survey participants — with population statistics available indicated that the participants closely represented the true populations of the areas surveyed.7 The participation rate was also comparable to those of other studies of this type.15,18,19 We cannot be sure of the effect that non-respondents would have on the results of this study. We suggest that as non-respondents typically have higher morbidity and mortality rates than respondents,20 their absence from our study would, if anything, result in a more conservative conclusion.
Analysing trends in blood lipid concentrations and prevalence of hyperlipidaemia in Australia over the past three decades is complex because of opposing changes in factors influencing blood lipid levels and methodological issues between the studies. The prevalence of overweight and obesity, dietary factors, exercise patterns, alcohol consumption and use of lipid-lowering medication all influence plasma lipid concentrations. Of particular note is the dramatic increase in prevalence of overweight and obesity, especially central obesity, over the past two decades.7 Increased body mass index is a causative factor of higher TG and lower HDL-C levels. The predominant non-genetic determinants of increased TC and LDL-C levels are dietary saturated fats, whereas TC and LDL-C levels are reduced by increasing dietary polyunsaturated fat and water-soluble fibre content.21
It is currently unknown whether there are differences in risk factor prevalence between metropolitan and rural populations. Although differences in HDL-C analysis methods exist between studies, results are still comparable. Similar methods were used for all studies for TC and TG analyses. Early studies by the National Heart Foundation of Australia (NHFA) did not estimate LDL-C (now the key target for modification), and were confined to metropolitan populations.12-14 AusDiab (the Australian Diabetes, Obesity and Lifestyle Study) did not report rural prevalence.15
A major concern is that in four large, primarily urban population studies there have been no improvements in mean TC levels since the early 1980s, and our study showed only a 0.2 mmol/L decline (Box 6). Although even a small improvement in the population mean favourably affects overall population CVD risk, the decline in the mean TC levels achieved is disappointing compared with what can be achieved.22 Mean HDL-C levels have shown minimal change (about 0.1 mmol/L). Mean TG levels appear to have deteriorated, especially among women (about 0.35 mmol/L), among whom increasing overweight and obesity is a major issue.7
The prevalence of hypercholesterolaemia (TC > 5.5 mmol/L) that we observed (39%) is lower than in previous studies (range, 47% to 51%),12-15 but the wider definition that includes both those with TC > 5.5 mmol/L or on cholesterol lowering medication reveals a prevalence of 48% in our study, unchanged from the 1980s.
Our study, completed just after the release of the 2005 Australian lipid guidelines in November 2005, provides unique opportunities to quantify adherence to guidelines in Australia. Previous Australian NHFA/CSANZ (Cardiac Society of Australia and New Zealand) lipid management guidelines (2001),5 which focus on absolute risk rather than lipid cut-offs, along with those from New Zealand, are considered among the most potentially effective in the world in reducing CVD-related deaths.23 This emphasis on absolute risk further enhances the effectiveness of treatment.6,11 A recent study of the AusDiab 1999–2000 population, primarily focusing on primary prevention, strongly argued this point and noted limitations in the corresponding Pharmaceutical Benefits Scheme criteria for treatment.24 Optimal implementation of current NHFA/CSANZ guidelines would further enhance the cost-effectiveness of lipid-lowering medication in Australia.
There has been a dramatic increase in lipid lowering medication use, from minimal in the 1980s, to 7.1% (women) and 8.2% (men) in 1999–2000,24 and 12% in our study. Lipid-lowering medication is almost solely comprised of statins, which have potent effects on TC and LDL-C levels, but little effect on HDL-C or TG levels. Dispensed prescriptions for lipid-lowering medications have trebled, from 6.1 to 18.0 million between 1997 and 2005 (Ms Debra Rowett, Director, Drug and Therapeutics Information Service, Repatriation General Hospital, Adelaide, personal communication, 2008). The total cost of lipid-lowering medications (including patient co-payments) in 2005 in Australia was $1.16 billion.
Our results demonstrate the need for a national lipid guideline implementation program focused on primary care coupled with universal adoption of primary care chronic disease management systems such as the Australian National Primary Care Collaboratives.25 Strategies aimed at reducing mean TC levels in the whole population have a greater impact on overall burden of CVD than targeted treatment of high-risk individuals alone.5,26 The findings that mean Australian population TC has improved only a little over the past two decades reflect a lack of effective health promotion strategies, and an absence of population health monitoring and surveillance as recommended by the NHHRC. If better information becomes available about the impact of the strategies implemented, these initiatives can be modified or new ones implemented and the impact can be measured. It may be that some specific strategies will be required in rural areas and that not all rural areas will prove to be the same.
1 Definitions used to categorise risk groups
the New Zealand cardiovascular risk calculator, which takes into account a participant’s sex, age, blood pressure, smoking habits, TC : HDL-C ratio, and history of diabetes.
judged by LDL-C > 4.0 mmol/L or TC > 6.0 mmol/L plus any two (or more) other risk factors (HDL-C < 1.0 mmol/L, significant family history, hypertension, overweight or obesity, smoking, impaired fasting glucose, age ≥ 45 years. Data for glucose intolerance, microalbuminuria and/or renal impairment not available).
chronic renal failure, familial hypercholesterolaemia or familial combined hyperlipidaemia (data not available).
Group V: low CVD risk. Low absolute risk of CVD (< 10% over 5 years).
3 Mean blood lipid levels and prevalence of abnormal levels, by sex and age group
LDL = low-density lipoprotein. HDL = high-density lipoprotein. |
|||||||||||||||
4 Population characteristics by lipid-lowering medication use and CVD risk status*
5 Control of blood lipids by lipid-lowering medication usage and CVD risk status
Received 2 November 2008, accepted 22 September 2009
- Edward D Janus1,2
- Philip A Tideman3,4
- James A Dunbar1
- Annamari Kilkkinen5
- Stephen J Bunker1
- Benjamin Philpot1
- Rosy Tirimacco4
- Kevin Mc Namara1,6
- Sami Heistaro5
- Tiina Laatikainen5
- 1 Greater Green Triangle University Department of Rural Health, Flinders University and Deakin University, Warrnambool, VIC.
- 2 Department of Medicine, University of Melbourne, Western Hospital, Melbourne, VIC.
- 3 Cardiovascular Medicine, Flinders Medical Centre, Adelaide, SA.
- 4 Integrated Cardiovascular Clinical Network SA, Country Health SA Hospital Inc, Adelaide, SA.
- 5 National Institute for Health and Welfare, Helsinki, Finland.
- 6 Faculty of Pharmacy and Pharmaceutical Sciences, Monash University, Melbourne, VIC.
We thank Ms Anna Chapman, Dr Andrew Baird, the nurses who carried out the survey and the regional hospitals that provided facilities for the study. This study was supported by the Australian Government Department of Health and Ageing, the Australian Health Ministers’ Advisory Council (Priority Driven Research in Population Health grant no. 01/14), the Royal Australian College of General Practitioners, Sanofi-Aventis, Pfizer, Roche Diagnostics and Servier Laboratories Australia.
None identified.
- 1. Begg S, Vos T, Barker B, et al. The burden of disease and injury in Australia 2003. Canberra: Australian Institute of Health and Welfare, 2007. (AIHW Cat. No. PHE 82.) http://www.aihw.gov.au/publications/hwe/bodaiia03/bodaiia03.pdf (accessed Jul 2007).
- 2. Sexton PT, Sexton TL. Excess coronary mortality among Australian men and women living outside the capital city statistical divisions. Med J Aust 2000; 172: 370-374. <MJA full text>
- 3. The Long-Term Intervention with Pravastatin in Ischaemic Disease (LIPID) Study Group. Prevention of cardiovascular events and death with pravastatin in patients with coronary heart disease and a broad range of initial cholesterol levels. N Engl J Med 1998; 339: 1349-1357.
- 4. Shepherd J, Cobbe SM, Ford I, et al. Prevention of coronary heart disease with pravastatin in men with hypercholesterolemia. West of Scotland Coronary Prevention Study Group. N Engl J Med 1995; 333: 1301-1308.
- 5. National Heart Foundation of Australia; Cardiac Society of Australia and New Zealand. Lipid management guidelines — 2001. Med J Aust 2001; 175 (9 Suppl): S57-S88.
- 6. National Heart Foundation of Australia and the Cardiac Society of Australia and New Zealand. Position Statement on Lipid Management — 2005. http://www.heartfoundation.org.au/Site Collection Documents/Lipids%20HLC%20Pos%20Statement.pdf (accessed Aug 2007).
- 7. Janus ED, Laatikainen T, Dunbar JA, et al. Overweight, obesity and metabolic syndrome in rural southeastern Australia. Med J Aust 2007; 187: 147-152. <MJA full text>
- 8. Janus ED, Bunker SJ, Kilkkinen A, et al. Prevalence, detection and drug treatment of hypertension in an Australian rural population: the Greater Green Triangle risk factor study 2004–2006. Intern Med J 2008; 38: 879-886.
- 9. The World Health Organization MONICA Project (monitoring trends and determinants in cardiovascular disease): a major international collaboration. WHO MONICA Project Principal Investigators. J Clin Epidemiol 1988; 41: 105-114.
- 10. Tolonen H, Kuulasmaa K, Laatikainen T, et al; the European Health Risk Monitoring Project. Recommendation for indicators, international collaboration, protocol and manual of operations for chronic disease risk factor surveys. Helsinki: Finnish National Public Health Institute, 2002. http://www.ktl.fi/publications/ehrm/product2/title.htm (accessed Aug 2008).
- 11. National Heart Foundation of Australia and the Cardiac Society of Australia and New Zealand. Reducing risk in heart disease 2007. Guidelines for preventing cardiovascular events in people with coronary heart disease. http://www.heartfoundation.org.au/SiteCollectionDocuments/A%20RR%20RRIHD%202008Update%20Guideline%20pdf.pdf (accessed Dec 2009).
- 12. National Heart Foundation of Australia. Risk Factor Prevalence Study no. 1 — 1980. Canberra: NHFA, 1980.
- 13. National Heart Foundation of Australia. Risk Factor Prevalence Study no. 2 — 1983. Canberra: NHFA, 1983.
- 14. Risk Factor Prevalence Study Management Committee. Risk Factor Prevalence Study survey no. 3, 1989. Canberra: National Heart Foundation of Australia, Australian Institute of Health, 1990.
- 15. Dunstan D, Zimmet P, Welborn T, et al; on behalf of the AusDiab Steering Committee. Diabesity and associated disorders in Australia — 2000. The accelerating epidemic. The Australian Diabetes, Obesity and Lifestyle Study (AusDiab). Melbourne: International Diabetes Institute, 2001. http://www.diabetes.com.au/pdf/AusDiab_Report.pdf (accessed Sep 2007).
- 16. National Health and Hospitals Reform Commission. A healthier future for all Australians. Interim Report. Canberra: NHHRC, 2008. http://www.nhhrc.org.au/internet/nhhrc/publishing.nsf/Content/nhhrc-report (accessed Dec 2009).
- 17. Stocks N, Ryan P, Allan J, et al. Gender, socioeconomic status, need or access? Differences in statin prescribing across urban, rural and remote Australia. Aust J Rural Health 2009; 17: 92-96.
- 18. Janus ED, for the Hong Kong Cardiovascular Risk Factor Prevalence Study Steering Committee, editors. The Hong Kong Cardiovascular Risk Factor Prevalence Study 1995–1996. Hong Kong: University of Hong Kong, 1997.
- 19. Lam TH, Liu LJ, Janus ED, et al. The relationship between fibrinogen and other coronary heart disease risk factors in a Chinese population. Atherosclerosis 1999; 143: 405-413.
- 20. Batty GD, Gale CR. Impact of resurvey non-response on the associations between baseline risk factors and cardiovascular disease mortality: prospective cohort study. J Epidemiol Community Health 2009; 63: 952-955.
- 21. Caggiula AW, Mustad VA. Effects of dietary fat and fatty acids on coronary artery disease risk and total and lipoprotein cholesterol concentrations: epidemiologic studies. Am J Clin Nutr 1997; 65 (5 Suppl): 1597S-1610S.
- 22. Laatikainen T, Critchley J, Vartiainen E, et al. Explaining the decline in coronary heart disease mortality in Finland between 1982 and 1997. Am J Epidemiol 2005; 162: 764-773.
- 23. Manuel DG, Kwong K, Tanuseputro P, et al. Effectiveness and efficiency of different guidelines on statin treatment for preventing deaths from coronary heart disease: modelling study. BMJ 2006; 332: 1419-1422.
- 24. Chen L, Rogers SL, Colagiuri S, et al. How do the Australian guidelines for lipid lowering drugs perform in practice? Cardiovascular disease risk in the AusDiab Study, 1999–2000. Med J Aust 2008; 189: 319-322. <MJA full text>
- 25. Harris MF, Zwar NA. Care of patients with chronic disease: the challenge for general practice. Med J Aust 2007; 187: 104-107. <MJA full text>
- 26. Jousilahti P, Vartiainen E, Pekkanen J, et al. Serum cholesterol distribution and coronary heart disease risk: observations and predictions among middle-aged population in eastern Finland. Circulation 1998; 97: 1087-1094.
Abstract
Objectives: To determine population lipid profiles, awareness of hyperlipidaemia and adherence to Australian lipid management guidelines.
Design and setting: Population survey in rural south-eastern Australia, 2004–2006.
Participants: Stratified random sample from the electoral roll. Data from 1274 participants (40%) aged 25–74 years were analysed.
Main outcome measures: Population mean total, low-density lipoprotein and high-density lipoprotein cholesterol (TC, LDL-C and HDL-C) and triglyceride (TG) concentrations, prevalence of dyslipidaemia, and treatment according to 2001 and 2005 Australian guideline target levels.
Results: Population-adjusted mean TC, TG, LDL-C and HDL-C concentrations were 5.38 mmol/L (95% CI, 5.30–5.45), 1.50 mmol/L (95% CI, 1.43–1.56), 3.23 mmol/L (95% CI, 3.16–3.30) and 1.46 mmol/L (95% CI, 1.44–1.49), respectively. Prevalence of hypercholesterolaemia (TC > 5.5 mmol/L or on treatment) was 48%. Lipid-lowering medication use was reported by 12%. Seventy-seven of 183 participants with established cardiovascular disease (CVD) or diabetes were untreated, and of the 106 treated, 59% reached the target LDL-C. Of those without CVD or diabetes already treated, 38% reached target LDL-C, and 397 participants at high absolute risk did not receive primary prevention. Ninety-five per cent of treated individuals with CVD or diabetes and 86% of others treated had cholesterol measured in the previous year. Sixty-nine per cent of individuals at low risk aged over 45 years had their cholesterol measured within the previous 5 years.
Conclusions: A comprehensive national strategy for lowering mean population cholesterol is required, as is better implementation of absolute risk management guidelines — particularly in rural populations.