


The known: Despite improvements, cancer survival varies across Australia.
The new: More than one in ten cancer‐related deaths could be attributed to spatial disparities in survival in Australia. This was estimated using Bayesian spatial modelling, applied to cancer registry data from across Australia. Patterns in attributable cancer deaths were analysed spatially and by geographical factors. While disparities differed by cancer type, the highest percentages of cancer‐related deaths that were attributable to survival disparities were in remote and socio‐economically disadvantaged areas.
The implications: By quantifying the impact of these survival disparities, these findings highlight the need for evidence‐based interventions to reduce spatial disparities in cancer survival across Australia.
In recent decades, advancements in screening, diagnostics and treatment have contributed to improvements in survival for all invasive cancers, with 5‐year survival rates increasing from 55% in the early 1990s to 71% during the late 2010s.1 However, there is substantial evidence that cancer survival varies by geographical area across Australia.2
Some previous studies investigating the extent of geographical inequalities have reported differences in cancer‐specific mortality rates.3,4,5 However, this can underestimate the number of cancer deaths since cause‐specific mortality rates do not consider deaths that were indirectly related to the cancer or its treatment and are liable to inaccuracies due to difficulties of assigning cause of death when multiple factors are involved.6 Using relative survival addresses these limitations, as it measures the excess mortality in the cancer cohort, compared with a population of the same age and sex but without a cancer diagnosis.7 A previous study used the relative survival framework to estimate that about 8% of cancer‐related deaths in Queensland, Australia, could be attributed to spatial disparities in survival.8 However, since the study used models adjusted for stage, a known prognostic factor for survival, the true number of cancer deaths attributable to spatial disparities in survival was likely to be underestimated.
Exploring disparities in survival using absolute measures (such as numbers of cancer‐related deaths) rather than relative measures (such as survival rate ratios) can provide a greater appreciation of the impact of these disparities.2 The purpose of this study was to estimate one such measure, “attributable cancer deaths”, which quantifies the number of cancer‐related deaths attributable to variation in cancer survival and is analogous to “population‐attributable fractions” (see Supporting Information).
It used population‐based cancer registry data covering Australia to estimate the numbers and percentages of cancer‐related deaths that could be attributable to geographical disparities in survival. This was done by estimating the numbers of deaths expected if all areas in Australia achieved a 5‐year survival rate equal to a defined benchmark. This information provides a tangible estimate of the impact that spatial disparities have on Australians’ lives and can be used in targeting policy and practical interventions to reduce these survival disparities.
Methods
This cohort study used cancer registry data for all individuals diagnosed with an invasive cancer in Australia from 1 January 2006 to 31 December 2019, aged 15 years and older, obtained from the Australian Cancer Database.9 Mortality status was determined through routine annual linkage of cancer records with the National Death Index,10 censored on 31 December 2019. Individuals with unknown geographical area at diagnosis, or who lived in areas with very small populations (≤ 5 people aged 15 years or older) or on remote islands were excluded, along with people diagnosed with cancer at death or autopsy and those with zero or negative survival times (Supporting Information, table 1). For people with multiple primary cancers, only the first cancer diagnosed during the study period was included.
Types of cancer included
Analyses were conducted on all invasive cancers combined, rare cancers, and five types of cancer with statistical evidence of spatial variation in survival and the highest age‐standardised mortality rates:1 bowel, female breast, lung, pancreatic and prostate cancers, identified by International Statistical Classification of Diseases and Related Health Problems (10th revision) codes. Estimates for other cancer types with evidence of spatial variation and further details on cancer types are shown in the Supporting Information.
Geographical areas
In this study, “area” refers to residential location at the time of cancer diagnosis, which was based on Statistical Area Level 2, as defined by the 2016 edition of the Australian Statistical Geography Standard.1 The spatial modelling included 2238 areas, after excluding those with low populations (50), area codes that were not spatial (18) and remote islands (4). Remoteness was defined based on the Remoteness Areas classification,11 with remote and very remote areas combined. Area disadvantage was measured using the Index of Relative Socio‐economic Disadvantage.12
Statistical analysis
The schematic in Box 1 describes how the attributable cancer deaths were calculated using a simulated example, and further details are provided in the Supporting Information. The method involved four measures of mortality in the cancer cohort: the total number of deaths, the expected number of deaths, the number of cancer‐related deaths and the number of attributable cancer‐related deaths. In the relative survival framework, the term “excess deaths” refers to the number of deaths among the cancer cohort that exceeds the expected number of deaths, which is based on the age‐ and sex‐matched population mortality by year and area (see Supporting Information). Sex refers to biological sex, based on the definition of male and female used by the Australian Bureau of Statistics.13 Excess deaths are therefore considered to be related to the cancer diagnosis or its treatment and are henceforth referred to as cancer‐related deaths.
The total number of deaths, expected number of deaths and person‐years at risk were calculated for each cancer type by area, broad age group, sex and year since diagnosis using the period approach7 and the Stata macro strs (StataCorp). People were included in the study for each year they survived between 2010 and 2019, within 5 years after diagnosis or until age 90 years.
Spatial modelling
The modelled number of cancer‐related deaths and smoothed area‐level excess hazard ratios (EHRs) were estimated using Bayesian spatial survival models.14 The excess hazard is the modelled number of cancer‐related deaths per person‐years in the cancer cohort. The EHRs are the ratios of the excess hazard in each area compared with the national excess hazard and were adjusted for age group, sex, number of years since diagnosis and cancer type (where applicable). The survival ratio (SRi, for area i) was the inverse of the EHR; ie, SRi = 1 ÷ (EHRi).
Estimation of attributable cancer deaths
The number of cancer deaths attributable to geographical differences in survival in each area was estimated by comparing the modelled number of cancer‐related deaths with the number of cancer‐related deaths expected to occur if the area’s survival ratio met a benchmark. Two benchmarks were used: the average and the optimal. The average benchmark (SRAB = 1) was applied to areas with survival below the model baseline (SRi < 1) and used to estimate the number of cancer‐related deaths that would occur if those areas had survival equal to the model baseline (SRi = 1), which can be considered equivalent to the national average. The optimal benchmark was the 80th centile survival ratio, consistent with that used in previous studies.15,16 The optimal benchmark was applied to the 80% of areas with survival below this benchmark.
The benchmark number of cancer‐related deaths was estimated for each area that did not meet the benchmark, using the benchmark survival ratio, along with other model results and the observed characteristics of the cancer cohort for each area. The number of attributable cancer deaths was then the difference between the modelled and the benchmark numbers of cancer‐related deaths. The attributable percentage was the number of attributable cancer deaths, expressed as a percentage of the total cancer‐related deaths in the corresponding area.
Software
Analyses were carried out in R 4.3.017 (R Foundation) and Bayesian spatial survival models were fitted with WinBUGS 1.4.3 (Medical Research Council Biostatistics Research Unit, University of Cambridge) via the R2WinBUGS package version 2.1‐2118 or NIMBLE version 1.0.019 for rare cancers only.20
Ethics approval
Ethics approval was obtained from the human research ethics committees of Griffith University (EC00162, reference 2018/280), the Northern Territory Department of Health and Menzies School of Health Research (EC00153, reference 2016‐2720), ACT Health (EC00100, reference ETHLR.16.235), NSW Population and Health Services (EC00410, reference 2019/ETH01656) and Queensland University of Technology (EC00171, reference 1600000880). The data custodians for each of the eight Australian state and territory cancer registries, to which notification of all invasive cancers is a statutory requirement, provided approval for data access.
Results
Overall, 1 476 193 people with an invasive cancer were included in the study population, with 370 437 deaths within 5 years of diagnosis. The modelled number of cancer‐related deaths within 5 years of diagnosis was 289 075 for all invasive cancers combined, and the sex‐specific models found 162 113 and 126 420 such deaths among males and females, respectively (Box 2).
Attributable cancer‐related deaths
If the survival rate in all areas of Australia at least met the optimal benchmark, 33 892 (11.7%) cancer‐related deaths could have been avoided within 5 years of diagnosis in the period 2010–2019. The estimated number of attributable cancer‐related deaths varied by sex (Box 2), with 18 983 (11.7%) and 12 876 (10.2%) attributable cancer‐related deaths for males and females, respectively, based on the sex‐specific optimal benchmarks.
Spatial distribution
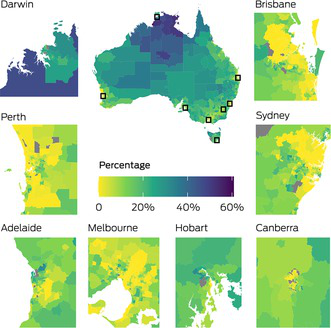
For all invasive cancers, the percentages of cancer‐related deaths that were attributable to geographical disparities in survival in most areas of the state and territory capital cities were low compared with percentages for areas outside of the capital cities (Box 3). Percentages were higher in the northern and central regions of Australia, particularly in the Northern Territory, the Kimberley and Cape York.
Remoteness
The percentage of areas with suboptimal survival for all invasive cancers increased with increasing remoteness (Supporting Information, table 2). All 95 remote areas, 99.1% of outer regional areas (318/321) and 95.7% of inner regional areas (473/494) had suboptimal survival, compared with 65.4% of major city areas (869/1328).
Although the numbers were greatest in major cities, the percentages of cancer‐related deaths attributable to spatial disparities in survival (the attributable percentages) increased with increasing remoteness (Box 4). For example, for all invasive cancers, we estimated that in remote areas 30.1% (1569) of cancer‐related deaths were attributable to geographical disparities in survival compared with 8.0% (15 087) in major city areas (Box 5) and the proportion of cancer‐related deaths attributable to spatial disparities in survival was 2.0–3.7 times higher in regional and remote areas than in major city areas. The patterns by remoteness were similar for other cancer types, although differences were very small for brain cancer, melanoma and non‐Hodgkin lymphoma (Box 5 and Supporting Information, table 3).
In remote areas, rare cancers accounted for the highest number of attributable cancer‐related deaths (529, 29.3%). Rare and liver cancers had the greatest disparities in percentages compared with major cities, with the attributable percentages in remote areas being 4.2 and 4.3 times those of major city areas, respectively (Box 5 and Supporting Information, table 3). Head and neck cancers (43.8%) and oral cancers (41.2%) had the highest attributable percentages in remote areas (Supporting Information, table 3).
While males had higher numbers of attributable cancer‐related deaths than females for all types of cancer across all remoteness categories, females had higher attributable percentages than males for leukaemia, lung and stomach cancers (Supporting Information, table 4).
Area disadvantage
The percentage of areas with suboptimal survival for all invasive cancers increased with increasing area disadvantage (Supporting Information, table 2), from 34.8% (152/437) of the least disadvantaged areas to 98.9% (430/435) of the most disadvantaged areas.
Generally, the percentage of cancer‐related deaths that was attributable to spatial disparities in survival (the attributable percentage) increased by area disadvantage for all cancer types combined and individual cancer types, with the attributable percentage for all cancers in the most disadvantaged areas being 9.6 times that in the least disadvantaged areas (Box 4, Box 6 and Supporting Information, table 5). For the sex‐specific models, the attributable percentages for all invasive cancers for males and females were, respectively, 7.5 and 4.1 times higher in the most disadvantaged areas than the least disadvantaged areas (Supporting Information, table 6). The highest numbers of attributable cancer deaths in the most disadvantaged areas were for rare cancers (3070) and lung cancer (2640) (Box 6). These cancers and pancreatic cancer (574) had the greatest differences in attributable percentages for the most and least disadvantaged areas. Other cancer types with large differences in the attributable percentages for the most and least disadvantaged areas were bowel cancer (4.8 times higher), breast cancer (4.4 times higher) and neuroendocrine tumours (4.1 times higher) (Box 6, Supporting Information, table 5).
Within each remoteness category, the percentage of cancer deaths attributable to spatial disparities in survival was largest in the most disadvantaged areas (Supporting Information, table 7). Furthermore, for each remoteness category, the majority of the attributable deaths were in the most and more disadvantaged areas (Supporting Information, table 8).
Average benchmark
Using the more conservative average benchmark, both the numbers and percentages of attributable cancer deaths were lower than for the optimal benchmark. For example, if the survival rate in all areas at least met the average benchmark, 14 938 cancer‐related deaths (5.2%) could be attributed to spatial disparities in survival — 8351 in males (5.2%) and 5325 in females (4.2%). For all invasive cancers, the patterns by remoteness were similar to those observed for the optimal benchmark with 1143 (22.0%) attributable cancer‐related deaths in remote areas and 5049 (2.7%) in major cities (Box 5). Similarly, both the numbers and percentages of cancer‐related deaths that were attributable to spatial disparities in survival were lower when analysed by area disadvantage but differences between the categories were similar to those observed for the optimal benchmark for all cancer types and by sex (Supporting Information, table 5 and table 6).
Discussion
In this study, we quantified the consequences of spatial disparities in cancer survival in terms of the numbers and percentages of cancer‐related deaths. We found that nearly 12% of cancer‐related deaths within 5 years of diagnosis could be attributed to these disparities based on the benchmark of improving survival to the top 20th centile. This equates to about 3400 deaths per year over the study period. With a more conservative benchmark (the national average survival), about 5% or 14 938 cancer‐related deaths could be avoided.
The percentages of cancer‐related deaths attributable to survival disparities increased with increasing remoteness and area‐level socio‐economic disadvantage. However, major cities are not immune to attributable cancer deaths; the major city category had the highest numbers of cancer‐related deaths attributable to spatial disparities in survival. This is primarily driven by population distribution, since the majority of Australians (73%) live in major city areas.21 However, most of the attributable cancer deaths in major city areas occurred in disadvantaged areas, possibly reflecting inequalities in factors such as socio‐economic barriers to health care and health literacy.
Reducing disparities in health outcomes based on geographical location has been a priority in Australia for more than 20 years. Yet, previous work has shown that the characteristics of these spatial disparities have not changed over this period, nor has the magnitude reduced.22,23 The reasons for these disparities are complex and likely influenced, at least in part, by socio‐cultural factors and health care accessibility. Studies have suggested that the disparities in cancer‐related deaths may be related to inequitable health access and provision, and poorer cancer screening.8,22,23,24,25,26 In addition, increased participation in behaviours associated with increased risk of cancer death, such as post‐diagnosis smoking, has been observed in areas of higher remoteness and disadvantage.27,28,29,30 Nonetheless, the precise drivers of the spatial inequalities and the magnitude of their impact remain inadequately understood.
Our findings highlight the need to consider both the percentage and the number of attributable cancer‐related deaths when exploring strategies to reduce disparities. For example, better cancer outcomes have been reported with centralisation of services and higher caseloads.31 However, centralisation of services means that people in rural and remote areas face an increased socio‐economic burden to access treatment and support services. Investment in finding solutions to this issue is worthy.
Historical evidence demonstrates that addressing complex issues requires dedicated investment. This is particularly relevant for spatial disparities in cancer survival. Recognising the need for targeted funding for other health‐related issues, the Australian Government recently allocated about $3 billion to the Mental Health and Suicide Prevention Plan;32 the annual numbers of suicide deaths are similar to the annual numbers of cancer‐related deaths linked to geographical disparities. Similarly, a 6‐year investment in Australia’s Road Safety Program33 was made to address motor vehicle accidents, despite total numbers of motor vehicle‐related deaths amounting to only one‐third of the number of attributable cancer‐related deaths.34,35 These precedents highlight the urgent need for investment in solutions that reduce geographical disparities in cancer survival. Identifying effective interventions will require a multifaceted approach, including quantitative data linkage studies, surveys, qualitative interviews, and focus groups. In addition, emerging technologies such as social media mining and artificial intelligence‐driven analytics could play a crucial role in uncovering insights and informing targeted strategies.
Strengths of this study include the application of robust Bayesian spatial modelling to national population‐based cancer registry data and the estimation of attributable cancer deaths. Spatial modelling facilitated insight into the heterogeneity within the broader geographical classifications while maintaining confidentiality. Causality cannot be inferred from the results of this study. Results would vary if other benchmarks were used, although the patterns were consistent between the two different benchmarks used in this study. As with all spatial studies, the results may depend on how the areal units are defined.36 However, there is evidence that the fine spatial resolution used in this study will avoid this issue.37 The relative survival framework used for these analyses is robust to the inaccuracies and complexities associated with cause‐of‐death coding.38 There is potential for overdiagnosis to influence the results for a small number of cancer types if the extent of overdiagnosis was higher in the areas that contributed to the benchmark. This may occur if, for example, the participation rates in these areas for formal or ad hoc screening for specific types of cancer were also higher than the mean. While it is not possible to rule this out, the fact that the general patterns in attributable cancer deaths were consistent whether the optimal or average benchmark was used suggests that our observed patterns were real.
While a previous study calculated attributable cancer deaths using stage‐adjusted spatial models,8 we have purposefully restricted the statistical models to include adjustment by age and sex only. This means that area‐level differences in stage at diagnosis, along with differences in management and support services, could explain at least part of the observed results. In addition, by using 5‐year survival to define attributable cancer deaths, we focused on short term disparities in cancer survival. While the statistical models used individual‐level data, the interpretation was ecological. In addition, the gradual implementation of subsidies for effective immunotherapies from 201539 may have influenced the spatial disparities in survival for some cancer types in recent years; however, our study had insufficient incidence and survival data after this period to assess its impact on attributable cancer deaths.
This study provides an important additional perspective to the current knowledge on disparities in cancer survival and their impact in terms of the reduction in the number of cancer‐related deaths that would be possible if the spatial disparities in survival were reduced. The large number of cancer‐related deaths in Australia linked to spatial disparities rivals other major causes of death with billion‐dollar prevention strategies. This highlights the urgent need to prioritise resources to uncover the causes of these disparities and develop evidence‐based interventions to save lives. Policies promoting health equity through improving access to specialist centres, subsided travel and increasing the health workforce may improve quality of care in remote and rural areas.
Box 1 – Schematic demonstrating how the numbers of attributable cancer deaths were calculated*
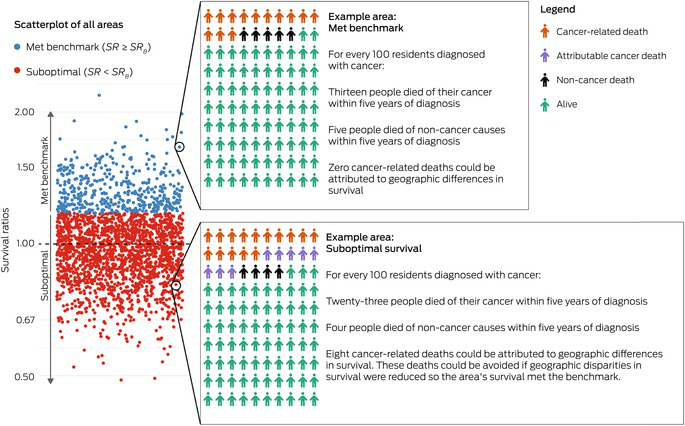
SR = area’s survival ratio. SRB = benchmark survival ratio. * The scatterplot shows simulated survival ratios for 2238 areas, with each circle representing an area. The areas are classified as met benchmark (blue) or suboptimal (red) based on their survival ratios. For two example areas, a hypothetical cohort of 100 people diagnosed with cancer is shown, with colour reflecting vital status at 5 years after diagnosis. In each area, deaths in the cancer cohort were classified as either cancer‐related deaths or non‐cancer deaths, based on population mortality in the area. In the suboptimal areas, the attributable cancer deaths are the deaths that would not have occurred if the area’s survival ratio met the optimal benchmark.
Box 2 – Numbers and percentages of cancer‐related deaths attributable to spatial disparities in survival within 5 years of cancer diagnosis in Australia, 2010–2019, using the sex‐specific models and the model for all persons aged 15–89 years, combined*
|
|
Modelled number of cancer‐related deaths within 5 years of diagnosis (95% CrI) |
Optimal benchmark† |
Average benchmark‡ |
||||||||||||
|
|
Number of attributable cancer deaths (95% CrI)§ |
Attributable percentage |
Number of attributable cancer deaths (95% CrI)¶ |
Attributable percentage |
|||||||||||
|
|
|||||||||||||||
|
All persons |
289 075 (287 923–290 310) |
33 892 (29 607–38 348) |
11.7% |
14 938 (11 829–18 051) |
5.2% |
||||||||||
|
Females |
126 420 (125 660–127 193) |
12 876 (10 796–14 777) |
10.2% |
5325 (3951–6630) |
4.2% |
||||||||||
|
Males |
162 113 (161 248–162 998) |
18 983 (16 193–21 641) |
11.7% |
8351 (6302–10175) |
5.2% |
||||||||||
|
|
|||||||||||||||
|
CrI: credible interval. * As these are modelled counts, total numbers will vary slightly from the sums of the sex‐specific estimates. † Optimal benchmark was the 5‐year relative survival for the area where survival was better than 80% of all areas. ‡ Average benchmark was the model baseline, which can be considered equivalent to the national average 5‐year relative survival. § Number of attributable cancer deaths was the number of modelled cancer‐related deaths within 5 years of diagnosis that exceeded the number that would have occurred if all areas at least met the benchmark. ¶ Attributable percentage was the number of attributable cancer deaths expressed as a percentage of the cancer‐related deaths in the corresponding area. |
|||||||||||||||
Box 3 – Spatial variation in the percentages of cancer‐related deaths that were attributable to disparities in survival by small area in Australia, 2010–2019, using the optimal benchmark (state and territory capitals shown as insets)
Box 4 – Numbers and percentages of cancer‐related deaths that were attributable to spatial disparities in survival for all invasive cancers by remoteness category and area‐level socio‐economic disadvantage for all persons aged 15–89 years in Australia, 2010–2019*
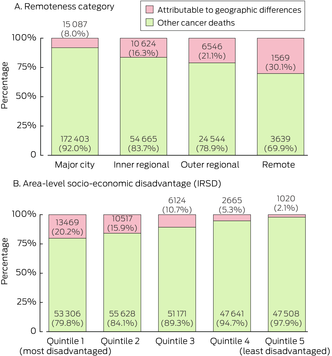
IRSD = Index of Relative Socio‐economic Disadvantage. * The labels on the columns show the numbers of attributable cancer deaths and the attributable percentages.
Box 5 – Modelled numbers of cancer‐related deaths and cancer‐related deaths attributable to spatial disparities in survival by remoteness category for persons aged 15–89 years in Australia, 2010–2019*
|
Remoteness§ |
Modelled number of cancer‐related deaths within 5 years of diagnosis (95% CrI) |
Optimal benchmark† |
Average benchmark‡ |
||||||||||||
|
Number of attributable cancer deaths (95% CrI)¶ |
Attributable percentage** |
Number of attributable cancer deaths (95% CrI)¶ |
Attributable percentage** |
||||||||||||
|
|
|||||||||||||||
|
All cancers |
|
|
|
|
|
||||||||||
|
Major city |
187 490 (186 599–188 460) |
15 087 (12 516–17 797) |
8.0% |
5049 (3551–6512) |
2.7% |
||||||||||
|
Inner regional |
65 289 (64 787–65 809) |
10 624 (9445–11 964) |
16.3% |
4994 (3865–6090) |
7.6% |
||||||||||
|
Outer regional |
31 090 (30 729–31 450) |
6546 (5914–7321) |
21.1% |
3781 (3142–4546) |
12.2% |
||||||||||
|
Remote |
5208 (5100–5342) |
1569 (1430–1748) |
30.1% |
1143 (999–1327) |
22.0% |
||||||||||
|
Bowel cancer |
|
|
|
|
|
||||||||||
|
Major city |
22 345 (22 020–22 671) |
1129 (770–1461) |
5.1% |
448 (218–675) |
2.0% |
||||||||||
|
Inner regional |
8074 (7914–8241) |
701 (534–895) |
8.7% |
373 (230–536) |
4.6% |
||||||||||
|
Outer regional |
3793 (3685–3906) |
413 (309–539) |
10.9% |
237 (141–352) |
6.1% |
||||||||||
|
Remote |
502 (475–531) |
49 (24–77) |
9.7% |
26 (3–52) |
5.1% |
||||||||||
|
Breast cancer |
|
|
|
|
|
||||||||||
|
Major city |
7650 (7440–7857) |
696 (483–905) |
9.1% |
329 (152–498) |
4.3% |
||||||||||
|
Inner regional |
2313 (2223–2405) |
300 (214–393) |
13.0% |
154 (74–239) |
6.7% |
||||||||||
|
Outer regional |
1011 (962–1065) |
140 (94–194) |
13.9% |
73 (32–121) |
7.3% |
||||||||||
|
Remote |
151 (138–168) |
25 (13–42) |
16.8% |
16 (4–30) |
10.3% |
||||||||||
|
Lung cancer |
|
|
|
|
|
||||||||||
|
Major city |
45 684 (45 245–46 108) |
2766 (2140–3415) |
6.1% |
781 (492–1081) |
1.7% |
||||||||||
|
Inner regional |
16 185 (15 958–16 414) |
2370 (2042–2735) |
14.6% |
1084 (799–1397) |
6.7% |
||||||||||
|
Outer regional |
8013 (7856–8168) |
1486 (1301–1686) |
18.6% |
838 (644–1045) |
10.5% |
||||||||||
|
Remote |
1298 (1245–1354) |
300 (245–358) |
23.1% |
200 (147–258) |
15.4% |
||||||||||
|
Pancreatic cancer |
|
|
|
|
|
||||||||||
|
Major city |
14 696 (14 447–14 943) |
859 (595–1105) |
5.8% |
293 (145–436) |
2.0% |
||||||||||
|
Inner regional |
4566 (4449–4684) |
559 (426–697) |
12.3% |
277 (167–393) |
6.1% |
||||||||||
|
Outer regional |
2023 (1950–2099) |
310 (236–392) |
15.3% |
177 (108–253) |
8.7% |
||||||||||
|
Remote |
258 (239–279) |
46 (28–66) |
17.7% |
29 (11–49) |
11.2% |
||||||||||
|
Prostate cancer |
|
|
|
|
|
||||||||||
|
Major city |
3713 (3489–3941) |
975 (745–1193) |
26.3% |
507 (304–692) |
13.7% |
||||||||||
|
Inner regional |
1569 (1451–1688) |
569 (439–700) |
36.3% |
316 (188–435) |
20.1% |
||||||||||
|
Outer regional |
743 (673–820) |
274 (199–355) |
36.9% |
144 (73–215) |
19.3% |
||||||||||
|
Remote |
88 (72–106) |
31 (16–50) |
35.4% |
17 (4–33) |
18.9% |
||||||||||
|
Rare cancers |
|
|
|
|
|
||||||||||
|
Major city |
61 881 (61 336–62 413) |
4241 (3873–4612) |
6.9% |
1262 (990–1532) |
2.0% |
||||||||||
|
Inner regional |
20 402 (20 135–20 664) |
2521 (2293–2754) |
12.4% |
1036 (843–1238) |
5.1% |
||||||||||
|
Outer regional |
9800 (9629–9978) |
1637 (1478–1791) |
16.7% |
877 (735–1017) |
9.0% |
||||||||||
|
Remote |
1809 (1737–1881) |
529 (460–600) |
29.3% |
403 (334–474) |
22.3% |
||||||||||
|
|
|||||||||||||||
|
CrI: credible interval * Cancer types were defined by International Statistical Classification of Diseases and Related Health Problems (10th revision) codes: bowel (C18–C20), pancreatic (C25), lung (C33, C34), female breast (C50), prostate (C61) and all invasive cancers (C00–C96, D45, D46, D47.1, D47.3–D47.5). See Supporting Information for information on definition of rare cancers. † Optimal benchmark was the 5‐year relative survival for the area where survival was better than 80% of all areas. ‡ Average benchmark was the model baseline, which can be considered equivalent to the national average 5‐year relative survival. § Remoteness was measured using the 2016 Remoteness Areas classification, with remote and very remote areas combined. ¶ Number of attributable cancer deaths was the number of modelled cancer‐related deaths within 5 years of diagnosis that exceeded the number that would have occurred if all areas at least met the benchmark. ** Attributable percentage was the number of attributable cancer deaths expressed as a percentage of the cancer‐related deaths in the corresponding area. |
|||||||||||||||
Box 6 – Modelled numbers of cancer‐related deaths and cancer‐related deaths attributable to spatial disparities in survival by area disadvantage for persons aged 15–89 years in Australia, 2010–2019*
|
|
|
Optimal benchmark† |
Average benchmark‡ |
||||||||||||
|
Area disadvantage§ |
Modelled number of cancer‐related deaths within 5 years of diagnosis (95% CrI) |
Number of attributable cancer deaths (95% CrI)¶ |
Attributable percentage** |
Number of attributable cancer deaths (95% CrI)¶ |
Attributable percentage** |
||||||||||
|
|
|||||||||||||||
|
All cancers |
|
|
|
|
|
||||||||||
|
Q1 (least disadvantaged) |
48 528 (48 130–48 939) |
1020 (691–1441) |
2.1% |
164 (42–287) |
0.3% |
||||||||||
|
Q2 |
50 306 (49 909–50 698) |
2665 (1932–3445) |
5.3% |
473 (245–723) |
0.9% |
||||||||||
|
Q3 |
57 295 (56 891–57 724) |
6124 (5199–7288) |
10.7% |
2031 (1459–2700) |
3.5% |
||||||||||
|
Q4 |
66 145 (65 662–66 647) |
10 517 (9280–11 842) |
15.9% |
4722 (3609–5856) |
7.1% |
||||||||||
|
Q5 (most disadvantaged) |
66 775 (66 277–67 216) |
13 469 (12 150–14 815) |
20.2% |
7498 (6184–8822) |
11.2% |
||||||||||
|
Bowel cancer |
|
|
|
|
|
||||||||||
|
Q1 (least disadvantaged) |
6210 (6064–6354) |
140 (63–214) |
2.2% |
39 (2–78) |
0.6% |
||||||||||
|
Q2 |
6275 (6166–6384) |
255 (152–354) |
4.1% |
72 (18–131) |
1.1% |
||||||||||
|
Q3 |
6794 (6683–6908) |
393 (275–518) |
5.8% |
153 (70–244) |
2.2% |
||||||||||
|
Q4 |
7918 (7782–8061) |
704 (547–880) |
8.9% |
361 (226–518) |
4.6% |
||||||||||
|
Q5 (most disadvantaged) |
7514 (7370–7665) |
797 (630–985) |
10.6% |
456 (302–633) |
6.1% |
||||||||||
|
Breast cancer |
|
|
|
|
|
||||||||||
|
Q1 (least disadvantaged) |
2352 (2251–2457) |
86 (41–134) |
3.6% |
26 (6–48) |
1.1% |
||||||||||
|
Q2 |
2160 (2090–2229) |
167 (112–227) |
7.7% |
67 (28–110) |
3.1% |
||||||||||
|
Q3 |
2236 (2168–2304) |
251 (183–327) |
11.2% |
115 (56–178) |
5.1% |
||||||||||
|
Q4 |
2311 (2231–2392) |
327 (242–416) |
14.1% |
175 (91–261) |
7.6% |
||||||||||
|
Q5 (most disadvantaged) |
2064 (1983–2149) |
329 (237–422) |
15.9% |
189 (97–278) |
9.2% |
||||||||||
|
Lung cancer |
|
|
|
|
|
||||||||||
|
Q1 (least disadvantaged) |
10 367 (10 199–10 540) |
265 (153–378) |
2.6% |
32 (5–61) |
0.3% |
||||||||||
|
Q2 |
11 671 (11 523–11 814) |
617 (455–793) |
5.3% |
147 (75–223) |
1.3% |
||||||||||
|
Q3 |
14 064 (13 907–14 227) |
1282 (1041–1543) |
9.1% |
450 (304–609) |
3.2% |
||||||||||
|
Q4 |
17 007 (16 817–17 203) |
2119 (1821–2450) |
12.5% |
937 (695–1202) |
5.5% |
||||||||||
|
Q5 (most disadvantaged) |
18 057 (17 842–18 282) |
2640 (2296–3022) |
14.6% |
1339 (1050–1656) |
7.4% |
||||||||||
|
Pancreatic cancer |
|
|
|
|
|
||||||||||
|
Q1 (least disadvantaged) |
4212 (4101–4324) |
111 (42–176) |
2.6% |
18 (0–40) |
0.4% |
||||||||||
|
Q2 |
4123 (4040–4208) |
225 (147–303) |
5.5% |
68 (27–110) |
1.6% |
||||||||||
|
Q3 |
4229 (4150–4310) |
340 (249–433) |
8.0% |
127 (66–192) |
3.0% |
||||||||||
|
Q4 |
4604 (4509–4700) |
521 (409–643) |
11.3% |
253 (160–354) |
5.5% |
||||||||||
|
Q5 (most disadvantaged) |
4372 (4276–4473) |
574 (455–697) |
13.1% |
307 (200–417) |
7.0% |
||||||||||
|
Prostate cancer |
|
|
|
|
|
||||||||||
|
Q1 (least disadvantaged) |
1033 (940–1130) |
164 (97–231) |
15.8% |
49 (14–85) |
4.7% |
||||||||||
|
Q2 |
1100 (1024–1176) |
309 (232–385) |
28.1% |
151 (86–215) |
13.8% |
||||||||||
|
Q3 |
1252 (1172–1331) |
427 (338–516) |
34.1% |
248 (154–336) |
19.8% |
||||||||||
|
Q4 |
1430 (1339–1525) |
491 (383–597) |
34.3% |
275 (165–376) |
19.2% |
||||||||||
|
Q5 (most disadvantaged) |
1296 (1207–1393) |
458 (350–564) |
35.3% |
262 (153–359) |
20.2% |
||||||||||
|
Rare cancers |
|
|
|
|
|
||||||||||
|
Q1 (least disadvantaged) |
16 778 (16 537–17 018) |
418 (313–521) |
2.5% |
79 (39–120) |
0.5% |
||||||||||
|
Q2 |
16 962 (16 761–17 154) |
996 (863–1132) |
5.9% |
250 (166–335) |
1.5% |
||||||||||
|
Q3 |
18 650 (18 448–18 853) |
1749 (1592–1908) |
9.4% |
595 (473–723) |
3.2% |
||||||||||
|
Q4 |
20 972 (20 748–21 201) |
2690 (2494–2895) |
12.8% |
1132 (956–1309) |
5.4% |
||||||||||
|
Q5 (most disadvantaged) |
20 512 (20 265–20 762) |
3070 (2857–3299) |
15.0% |
1521 (1320–1728) |
7.4% |
||||||||||
|
|
|||||||||||||||
|
CrI: credible interval. * Cancer types were defined by International statistical classification of diseases and related health problems (10th revision) codes: bowel (C18–C20), pancreatic (C25), lung (C33, C34), female breast (C50), prostate (C61) and all invasive cancers (C00–C96, D45, D46, D47.1, D47.3–D47.5). See Supporting Information for information on definition of rare cancers. † Optimal benchmark was the 5‐year relative survival for the area where survival was better than 80% of all. ‡ Average benchmark was the model baseline, which can be considered equivalent to the national average 5‐year relative survival. § Area disadvantage was measured by 2016 Index of Relative Socio‐economic Disadvantage. ¶ Number of attributable cancer deaths was the number of modelled cancer‐related deaths within 5 years of diagnosis that exceeded the number that would have occurred if all areas at least met the benchmark. ** Attributable percentage was the number of attributable cancer deaths expressed as a percentage of the cancer‐related deaths in the corresponding area. |
|||||||||||||||
Received 28 April 2025, accepted 11 September 2025
- Charlotte K Bainomugisa1,2
- Jessica Cameron1,2
- Paramita Dasgupta1,2
- Peter Baade1,2
- 1 Centre for Data Science, Queensland University of Technology, Brisbane, QLD
- 2 Viertel Cancer Research Centre, Cancer Council Queensland, Brisbane, QLD
Data Sharing:
The unit record data that support the findings of our study were obtained from the Australian Cancer Database, which is held by the Australian Institute of Health and Welfare. These data may be requested from the Australian Institute of Health and Welfare (subject to ethical and data custodian approval). Information on how to request these data from the Australian Institute of Health and Welfare is available online (https://www.aihw.gov.au/our‐services/data‐on‐request). Restrictions apply to the availability of these data, which were used under licence for our study. Modelled estimates and further information are available from the corresponding author on request.
This study was funded by Cancer Council Queensland through the generosity of its donors. We acknowledge the staff of the cancer registries from all states and territories in Australia for collecting and providing the data used for analyses through the Australian Cancer Database, which is produced by the Australian Institute of Health and Welfare. The registries include Queensland Cancer Register, NSW Cancer Registry, Victorian Cancer Registry, Tasmanian Cancer Registry, South Australian Cancer Registry, Western Australian Cancer Registry, ACT Cancer Registry and Northern Territory Cancer Registry. This work was conducted as part of the Australian Cancer Atlas (https://atlas.cancer.org.au), which was co‐led by Kerrie Mengersen from Queensland University of Technology. We thank Sandi Hayes from Cancer Council Queensland for her comments on a draft of this manuscript.
No relevant disclosures.
Authors’ contributions:
Charlotte Bainomugisa: Writing (original draft), writing (reviewing and editing). Jessica Cameron: Conceptualization, methodology, formal analysis, software, visualization, writing (original draft), writing (reviewing and editing). Paramita Dasgupta: Data curation, formal analysis, software, writing (reviewing and editing). Peter Baade: Conceptualization, project administration, writing (reviewing and editing).
- 1. Australian Institute of Health Welfare. Cancer data in Australia. Canberra: AIHW, 2024. https://www.aihw.gov.au/reports/cancer/cancer‐data‐in‐australia (viewed Apr 2025).
- 2. Dasgupta P, Cramb SM, Kou K, et al. Quantifying the number of cancer deaths avoided due to improvements in cancer survival since the 1980s in the Australian population, 1985–2014. Cancer Epidemiol Biomarkers Prev 2020; 29: 1825‐1831.
- 3. Mahumud RA, Alam K, Dunn J, Gow J. Emerging cancer incidence, mortality, hospitalisation and associated burden among Australian cancer patients, 1982 – 2014: an incidence‐based approach in terms of trends, determinants and inequality. BMJ Open 2019; 9: e031874.
- 4. Adair T, Lopez A. Widening inequalities in premature mortality in Australia, 2006‐16. Aust Popul Stud 2020; 4: 37‐56.
- 5. Public Health Information Development Unit, Torrens University Australia. Causes of premature and potentially attributable death; identifying hotspots of inequality. 2021. https://phidu.torrens.edu.au/social‐health‐atlases/topic‐atlas/cause‐of‐death‐hotspots (viewed Apr 2025).
- 6. Bishop K, Moreno‐Betancur M, Balogun S, et al. Quantifying cause‐related mortality in Australia, incorporating multiple causes: observed patterns, trends and practical considerations. Int J Epidemiol 2023; 52: 284‐294.
- 7. Ederer F, Axtell LM, Cutler SJ. The relative survival rate: a statistical methodology. J Natl Cancer Inst Monogr 1961; 6: 101‐121.
- 8. Cramb SM, Mengersen K, Turrell G, Baade PD. Spatial inequalities in colorectal and breast cancer survival: premature deaths and associated factors. Health Place 2012; 18: 1412‐1421.
- 9. Australian Institute of Health and Welfare. Australian Cancer Database [online database]. https://www.aihw.gov.au/about‐our‐data/our‐data‐collections/australian‐cancer‐database (viewed Nov 2024).
- 10. Australian Institute of Health and Welfare. Australian Burden of Disease Study: impact and causes of illness and death in Australia 2015 (AIHW Cat. No. BOD 22; Australian Burden of Disease Series No. 19). Canberra: AIHW, 2019. https://www.aihw.gov.au/reports/burden‐of‐disease/burden‐disease‐study‐illness‐death‐2015/summary (viewed Mar 2024).
- 11. Australian Bureau of Statistics. Australian Statistical Geography Standard (ASGS): Volume 5 ‐ Remoteness Structure, July 2016 (ABS Cat. No. 1270.0.55.005). Canberra: ABS, 2018. https://www.abs.gov.au/AUSSTATS/abs@.nsf/Latestproducts/1270.0.55.005Main%20Features15July%202016 (viewed Feb 2025).
- 12. Australian Bureau of Statistics. Census of Population and Housing: Socio‐Economic Indexes for Areas (SEIFA), Australia, 2016 (ABS Cat. No. 2033.0.55.001). Canberra: ABS, 2018. https://www.abs.gov.au/AUSSTATS/abs@.nsf/DetailsPage/2033.0.55.0012016?OpenDocument (viewed Mar 2025).
- 13. Australian Bureau of Statistics. Standard for Sex, Gender, Variations of Sex Characteristics and Sexual Orientation Variables. Canberra: ABS, 2021. https://www.abs.gov.au/statistics/standards/standard‐sex‐gender‐variations‐sex‐characteristics‐and‐sexual‐orientation‐variables/latest‐release (viewed July 2025).
- 14. Fairley L, Forman D, West R, Manda S. Spatial variation in prostate cancer survival in the Northern and Yorkshire region of England using Bayesian relative survival smoothing. Br J Cancer 2008; 99: 1786‐1793.
- 15. Yu, XQ, O’Connell DL, Gibberd RW, et al. Estimating regional variation in cancer survival: a tool for improving cancer care. Cancer Causes Control 2004; 15: 611‐618.
- 16. Cramb SM, Mengersen KL, Turrell G, Baade PD. Spatial inequalities in colorectal and breast cancer survival: premature deaths and associated factors. Health Place 2012; 18: 1412‐1421.
- 17. R Core Team. R: A language and environment for statistical computing. Vienna: R Foundation for Statistical Computing, 2019. https://www.R‐project.org/ (viewed Nov 2024).
- 18. Lunn DJ, Thomas A, Best N, Spiegelhalter D. WinBUGS — a Bayesian modelling framework: concepts, structure, and extensibility. Statistics and Computing 2000; 10: 325‐337.
- 19. Sturtz S, Ligges U, Gelman A. R2WinBugs: a package for running WinBUGS from R. Vienna: R Foundation for Statistical Computing, 2015. https://cran.r‐project.org/web/packages/R2WinBUGS/vignettes/R2WinBUGS.pdf (viewed Feb 2025).
- 20. de Valpine P, Turek D, Paciorek CJ, et al. Programming with models: writing statistical algorithms for general model structures with NIMBLE. J Comput Graph Stat 2017; 26: 403‐413.
- 21. Australian Institute of Health Welfare. Profile of Australia’s population. Canberra: AIHW, 2025. https://www.aihw.gov.au/reports/australias‐health/profile‐of‐australias‐population (viewed Apr 2025).
- 22. Tervonen HE, Aranda S, Roder D, et al. Cancer survival disparities worsening by socio‐economic disadvantage over the last 3 decades in New South Wales, Australia. BMC Public Health 2017; 17: 691.
- 23. Stanbury JF, Baade PD, Yu Y, Yu XQ. Cancer survival in New South Wales, Australia: socioeconomic disparities remain despite overall improvements. BMC Cancer 2016; 16: 48.
- 24. Dasgupta P, Cameron JK, Cramb SM, et al. Geographical and spatial disparities in the incidence and survival of rare cancers in Australia. Int J Cancer 2023; 152: 1601‐1612.
- 25. Azar D, Murphy M, Fishman A, et al. Barriers and facilitators to participation in breast, bowel and cervical cancer screening in rural Victoria: a qualitative study. Health Promot J Austr 2022; 33: 272‐281.
- 26. Dasgupta P, Cameron JK, Goodwin B, et al. Geographical and spatial variations in bowel cancer screening participation, Australia, 2015‐2020. PLoS One 2023; 18: e0288992.
- 27. Tao L, Wang R, Gao YT, Yuan J. Impact of postdiagnosis smoking on long‐term survival of cancer patients: the Shanghai cohort study. Cancer Epidemiol Biomarkers Prev 2013; 22: 2404‐2411.
- 28. Aquina CT, Probst CP, Becerra AZ, et al. High volume improves outcomes: the argument for centralization of rectal cancer surgery. Surgery 2016; 159: 736‐748.
- 29. Australian Institute of Health Welfare. Rural and remote health. Canberra: AIHW, 2024. https://www.aihw.gov.au/reports/rural‐remote‐australians/rural‐and‐remote‐health (viewed Apr 2025).
- 30. Australian Bureau of Statistics. Insights into Australian smokers, 2021‐22. Canberra: ABS, 2022. https://www.abs.gov.au/articles/insights‐australian‐smokers‐2021‐22 (viewed July 2025).
- 31. Videtic GM, Stitt LW, Dar AR, et al. Continued cigarette smoking by patients receiving concurrent chemoradiotherapy for limited‐stage small‐cell lung cancer is associated with decreased survival. J Clin Oncol 2003; 21: 1544‐1549.
- 32. Australian Government Department of Health. Prioritising mental health and suicide prevention – suicide prevention (pillar 2). Canberra: Department of Health, 2022. https://www.health.gov.au/sites/default/files/documents/2022/03/budget‐2022‐23‐mental‐health‐suicide‐prevention‐pillar‐2.pdf (viewed Mar 2025).
- 33. National Road Safety Strategy. Road Safety Program. https://www.roadsafety.gov.au/projects/road‐safety‐programs/road‐safety‐program (viewed Mar 2025).
- 34. Australian Bureau of Statistics. Causes of death, Australia. Canberra: ABS, 2024. https://www.abs.gov.au/statistics/health/causes‐death/causes‐death‐australia/latest‐release (viewed Mar 2025).
- 35. Australian Institute of Health Welfare. Deaths in Australia. Canberra: AIHW, 2025. https://www.aihw.gov.au/reports/life‐expectancy‐deaths/deaths‐in‐australia (viewed Apr 2025).
- 36. Wong DW. Modifiable areal unit problem. In: Kitchin R, Thrift N, editors. International encyclopedia of human geography. Oxford: Elsevier, 2009; pp. 169‐174.
- 37. Jahan F, Haque S, Hogg J, et al. Assessing the influence of the modifiable areal unit problem on Bayesian disease mapping in Queensland, Australia. PLoS One 2025; 20: e0313079.
- 38. Sarfati D, Blakely T, Pearce N. Measuring cancer survival in populations: relative survival vs cancer‐specific survival. Int J Epidemiol 2010; 39: 598‐610.
- 39. Australian Government Department of Health, Disability and Ageing. Efficient Funding of Chemotherapy Program. 2025. https://www.pbs.gov.au/info/browse/section‐100/chemotherapy (viewed July 2025).
Abstract
Objective: To estimate the number of cancer‐related deaths that could be attributed to spatial disparities in survival.
Design: Cohort study of cancer registry data.
Setting: Australia, 1 January 2010 to 31 December 2019.
Main outcome measures: The numbers and percentages of cancer‐related deaths attributable to spatial disparities in survival were estimated by calculating the numbers of cancer‐related deaths that would have occurred if all areas in Australia met or exceeded a benchmark 5‐year survival rate. This benchmark corresponded to the survival rate of the area with survival better than 80% of all areas, with “area” referring to residential location at diagnosis.
Results: Of all 289 075 cancer‐related deaths in Australia in 2010–2019, 33 892 (11.7%) were attributable to spatial disparities in survival. Although numbers were greatest in major cities, as remoteness and area disadvantage increased, the percentages of cancer‐related deaths attributable to spatial disparities in survival increased. Of all cancer‐related deaths in remote areas and the most socio‐economically disadvantaged areas, 1569 of 5208 (30.1%) and 13 469 of 66 775 (20.2%) deaths were attributable to survival disparities, respectively. The highest numbers and percentages of attributable cancer deaths in remote areas were for rare cancers (529/1809 [29.3%]), lung cancer (300/1298 [23.1%]) and head and neck cancers (162/370 [43.8%]). In the most disadvantaged areas, rare cancers (3070/20 512 [15.0%]) and lung cancer (2640/18 057 [14.6%]) had the highest numbers of attributable cancer deaths.
Conclusions: These findings quantify the impact of spatial disparities in survival and highlight the need for equitable access to diagnostic and treatment services across Australia.