


The known: Previous research has shown that cancer survival in the Northern Territory is lower for Aboriginal peoples; however, it is unknown whether survival rates have improved over the past decade.
The new: We investigated 30 years of cancer survival data for people living in the NT and observed improvements for both Aboriginal and non‐Aboriginal peoples. The gap in cancer survival persists, with poorer outcomes for Aboriginal peoples.
The implications: More needs to be done to improve timely access to culturally appropriate cancer services. Complementary programs aimed at reducing risk factors, fostering Aboriginal‐led quality improvement approaches and increasing Aboriginal participation in clinical trials may help close the gap in cancer survival for Aboriginal peoples in the NT.
Improving health equity between Aboriginal and non‐Aboriginal peoples is one of Australia's biggest challenges.1 Aboriginal and Torres Strait Islander peoples (henceforth referred to as Aboriginal peoples) in the Northern Territory have lower incidence of cancer overall compared with non‐Aboriginal people, but have significant excess mortality for all major cancer sites with the exception of liver cancer.2,3 In 2023, cancer was a leading cause of years of life lost (YLL) in the NT for both Aboriginal peoples (66.4 YLL per 1000 population) and non‐Aboriginal peoples (32.4 YLL per 1000 population).4 However, it has also been demonstrated that reductions in YLL due to cancer contributed to increases in life expectancy for Aboriginal and non‐Aboriginal peoples in the NT during the period 1999 to 2018.5
National commitments towards Closing the Gap in health outcomes continue to be an important focus of Australian health policy.1 Understanding the contribution of cancer survival towards this is critical, as it provides an indicator of intervention effectiveness. Vast improvements in cancer survival have been made in Australia through earlier detection and advances in treatments.6 Our objective was to determine whether improvements have occurred for the NT population by examining cancer survival by cancer sites and by NT subpopulations.
Methods
Study design and study population
We undertook a 30‐year retrospective cohort study in accordance with Strengthening the Reporting of Observational Studies in Epidemiology (STROBE) guidelines. Invasive cancer diagnoses for NT residents from 1 January 1991 to 31 December 2020 were obtained from the Northern Territory Cancer Registry and included in the analysis of all cancers combined. Only primary cancer sites with greater than 300 cases were included in site‐specific analyses. Cases diagnosed on a death certificate only and without a date of diagnosis were excluded as survival time was unidentified for these individuals.
Statistical analysis
Life tables for all‐cause population mortality by year, single year of age, sex and Indigenous status were derived from the Australian Coordinating Registry mortality database and estimated resident population data were sourced from the Australian Bureau of Statistics.7 Age‐standardised incidence rates were reported per 100 000 population and adjusted to the 2001 Australian standard population using direct age standardisation.
Age‐adjusted relative survival was estimated using the Ederer II period method and statistical analysis was undertaken in Stata SE 18.0 (StataCorp). Probabilities of observed survival 5 years after diagnosis are reported by 10‐year periods (1 January 1991 to 31 December 2000, 1 January 2001 to 31 December 2010, and 1 January 2011 to 31 December 2020) and presented as percentages and associated 95% confidence intervals. Excess mortality associated with cancer diagnosis was modelled using excess hazard ratios (EHRs), applying Poisson regression and relative survival methods, with comparison of data for Aboriginal and non‐Aboriginal people adjusted by sex and 5‐year age group at diagnosis.8
Ethics approval and Aboriginal governance
Ethics approval for this study was obtained from the Human Research Ethics Committee of NT Health and Menzies School of Health Research (reference 2022‐4486). This article is co‐authored by an Aboriginal man (CC) with experience in NT Aboriginal health policy and cancer care; in addition, it was reviewed by the NT Health First Nations Health and Wellbeing Division, who are supportive of its release as a contribution to understanding improvements in the health of Aboriginal people and addressing persistent cancer inequity issues.
Results
Between 1 January 1991 and 31 December 2020, there were 17 787 cancer registrations, of which 28 were excluded from our analysis (27 were diagnosed on a death certificate only and one was missing a date of diagnosis). Of the 17 759 cases analysed, 14 409 (81.1%) were among non‐Aboriginal people, 3350 (18.9%) were among Aboriginal people and 10 213 (57.5%) were among males (Box 1).
Trends in 5‐year survival for all cancers combined
Cancer survival 5 years after diagnosis for all cancers improved significantly over the 30‐year period for non‐Aboriginal and Aboriginal peoples, and for both males and females (Box 2). The largest increases in survival occurred from 1991–2000 to 2001–2010, with significant gains observed for all populations, including Aboriginal males (20.5% to 30.6%), non‐Aboriginal males (50.0% to 59.6%), Aboriginal females (32.3% to 43.7%) and non‐Aboriginal females (64.5% to 71.7%).
From 1991–2000 to 2011–2020, the 5‐year survival gap between Aboriginal and non‐Aboriginal peoples narrowed. For Aboriginal males, the gap reduced by 2.4% (0.7 percentage difference, from 29.5% to 28.8%), and for Aboriginal females, it decreased by 12.4% (4.0 percentage difference, from 32.2% to 28.2%). Survival improved for all populations in the most recent decade of 2011–2020 compared with 1991–2000; however, the improvements were only statistically significant for all NT cancers and non‐Aboriginal males (the population with the highest number of diagnoses).
During the period 2011–2020, there were significant differences in 5‐year survival between populations; the highest observed survival was for non‐Aboriginal females (75.4%), followed by non‐Aboriginal males (65.9%) and Aboriginal females (47.2%), and the lowest observed survival was for Aboriginal males (37.1%).
Trends in 5‐year survival by cancer site
Survival for the 15 most common cancer sites diagnosed in the NT is shown in Box 3. There were statistically significant improvements observed for ten of the 15 cancer sites: lung, liver, bowel, non‐Hodgkin lymphoma, uterus, female breast, melanoma of the skin, prostate, thyroid and unknown primary cancers. Between 1991–2000 and 2001–2010, there were significant improvements in survival for two sites: prostate cancer (77.8% to 88.4%) and uterine cancer (58.9% to 81.5%). Survival increased significantly from 2001–2010 to 2011–2020 for two sites: lung cancer (10.9% to 20.5%) and non‐Hodgkin lymphoma (63.6% to 80.7%). More gradual improvements were observed for the other six sites, from 1991–2000 to 2011–2020: liver cancer (6.5% to 23.7%), unknown primary site (9.6% to 26.3%), bowel cancer (50.5% to 66.6%), female breast cancer (82.5% to 89.9%), melanoma of the skin (86.5% to 93.8%), and thyroid cancer (77.3% to 94.6%).
For the remaining five sites, improvements in survival were observed between 2001–2010 and 2011–2020, but did not reach statistical significance: kidney cancer (72.8% to 78.6%), cervical cancer (59.5% to 68.8%), cancer of the oral cavity and pharynx (39.5% to 47.9%), leukaemia (42.5% to 52.1% [and higher in 2001–2010, 60.2%]), and pancreatic cancer, which had the poorest survival outcomes overall (7.1% to 16.4% [but lower in 2001–2010, 6.3%]).
Aboriginal and non‐Aboriginal cancer survival and excess mortality, 2011–2020
The 5‐year survival rates for the most recent decade, 2011–2020, and a comparison of the excess hazard ratios by Indigenous status are shown in Box 4. Overall, excess mortality 5 years after a cancer diagnosis was 3.3 times higher for Aboriginal peoples compared with non‐Aboriginal peoples.
By cancer site, 11 of 13 sites with sufficient case numbers showed disproportionately higher excess mortality for Aboriginal peoples following diagnosis. The highest difference was for prostate cancer, for which excess mortality was 6.1 times higher for Aboriginal males. This was followed by non‐Hodgkin lymphoma (EHR, 5.9), cervical cancer (EHR, 5.0), uterine cancer (EHR, 4.6), kidney cancer (EHR, 3.9), female breast cancer (EHR, 3.3), leukaemia (EHR, 3.3), cancer of the oral cavity and pharynx (EHR, 3.1), bowel cancer (EHR, 2.1) and lung cancer (EHR, 1.6).
Liver and pancreatic cancers had similar excess mortality outcomes for Aboriginal and non‐Aboriginal peoples. These cancers, along with lung cancer and unknown primary site cancer, had the poorest survival outcomes. The 5‐year survival outcomes for Aboriginal and non‐Aboriginal people, respectively, were: pancreatic cancer, 12.9% and 17.5%; liver cancer, 17.2% and 28.6%; lung cancer, 13.2% and 22.9%; and unknown primary cancer, 9.8% and 35.0%.
Discussion
Cancer survival has improved significantly for non‐Aboriginal and Aboriginal peoples in the NT. Our results build on previous findings documenting non‐significant improvement in survival (1991–2010),2 and confirm real improvements in cancer outcomes for NT residents. Our reporting of cancer survival by Indigenous status is unique, as not all states and territories have the same quality of Indigenous identification in their cancer registries. As cancer treatments have become increasingly targeted to cancer sites, we extend knowledge to 15 sites, enabling identification of survival by cancer site on a population level and examination of equity in outcomes.
Cancer survival outcomes for Aboriginal peoples are persistently lower compared with those for non‐Aboriginal people. The gap in excess mortality remains unchanged for eight cancer sites (oral cavity and pharynx, bowel, lung, female breast, liver, cervix, uterus and leukaemia) and this concords with findings from a previous NT study.2 For all cancers combined, from 1991–2000 to 2011–2020, we found a small narrowing of the survival gap for Aboriginal females of 12.4% (4.0 percentage difference), but only 2.4% (0.7 percentage difference) for Aboriginal males. Further investigation is needed to understand why the survival gap has narrowed more for Aboriginal females than males. The poorer survival outcomes for Aboriginal males highlight the need for tailored approaches to prevention, early diagnoses and treatment, including optimising screening for prostate cancer, for which Aboriginal males experience 6.1 times higher excess mortality compared with non‐Aboriginal males. Factors contributing to the inequity of cancer outcomes are multifaceted and complex. They include less access to services such as diagnostic testing and treatment for people living in remote areas, high prevalence of comorbidities, social stressors, risk factors such as smoking, health literacy barriers to undertaking cancer screening, genetics factors, and adverse tumour biology.9,10,11 Further research is required to better understand cancer biology and genomics for Aboriginal peoples. Synergistic cancer plans launched in 2023 from the National Aboriginal Community Controlled Health Organisation and the Australian Government seek to address inequities of health access and cancer outcomes for Aboriginal peoples and populations living in remote regions.12,13 In addition, pancreatic cancer, which has the poorest outcomes and 50% higher mortality risk for Aboriginal peoples, has been targeted to improve outcomes at key points along the optimal care pathway, from prevention to end‐of‐life care, through the National Pancreatic Cancer Roadmap.14
Our findings validate significant investment in NT cancer services across the spectrum of cancer control. Introduction of chemotherapy and radiotherapy services in Darwin from 2010 and spoke services in Alice Springs and Katherine have increased treatment access for remote clients who are predominately Aboriginal. Also, there has been progress in oncology telehealth, mobile screening services and enhanced diagnostic capabilities, including investment in positron emission tomography. The formation of the Northern Territory Cancer Care Network in 2014 has facilitated the planning and development of culturally safe services.15 Moreover, the NT's prevention and early intervention framework for chronic conditions aims to address behavioural risk factors, such as smoking, in order to reduce cancer incidence.16 Aboriginal‐led preventive strategies in the NT have been shown to improve Aboriginal participation in health‐related programs and health literacy.17 Thus, opportunities to expand quality improvement activities that are led by Aboriginal peoples for cancer prevention should be prioritised. However, delivering services to a sparse population over an extensive landmass presents formidable challenges and requires a commitment to ongoing and increased resourcing.
Advanced stage at diagnosis likely contributes to poorer survival outcomes among Aboriginal peoples. Previous studies have shown that Aboriginal peoples in the NT who have colon cancer, rectal cancer, breast cancer, cervical cancer or non‐Hodgkin lymphoma are often diagnosed at a later stage than their non‐Aboriginal counterparts.10,18 Concerningly, although Aboriginal peoples were more frequently diagnosed with lung cancer at an earlier stage,18 our findings show that they still experience inferior survival outcomes. Thus, while advanced stage at diagnosis plays a significant role, it does not entirely account for the disparities and further research will be needed to determine the efficacy of the National Lung Cancer Screening Program (launching in 2025) for the NT Aboriginal population.19 As data on cancer stage at diagnosis are not routinely collected Australia‐wide (including in the NT), there is a gap in our ongoing knowledge of the role that stage at diagnosis contributes to survival outcomes. Considerable discussion and advocacy have centred on standardising and routinely collecting nationwide staging data. Nevertheless, addressing this imperative requires strategic resource allocation to bridge the existing knowledge gap.
Survival trends improved for all 15 cancer sites, with statistically significant improvements in ten: lung, liver, bowel, non‐Hodgkin lymphoma, uterus, female breast, melanoma of skin, prostate, thyroid and unknown primary cancers. The evolution of cancer treatment, including targeted drugs, hormone therapies, immunotherapies, chemotherapies, radiotherapy, and surgical techniques, alongside evidence supporting combination therapies, has markedly enhanced cancer prognosis.20,21 While treatment advances are too numerous to address in detail, we identified relevant research specific to our findings which showed that novel therapies have extended survival significantly in some malignancies, in both adjuvant and metastatic settings. This includes a 2006 research finding that adjuvant chemotherapy extends survival for patients with resected non‐small cell lung cancer,22 which correlates with our finding of a two‐fold increase in 5‐year survival for lung cancer patients, from 10.9% in 2001–2010 to 20.5% in 2011–2020. The addition of combination immunotherapy in stage IV melanoma has significantly increased median survival rates,23 and the NT had a significant increase in survival following diagnosis of melanoma of skin, from 86.5% in 1991–2000 to 93.8% in 2011–2020. The 5‐year outcomes of the PRODIGE 24/Canadian Cancer Trials Group PA6 trial confirm the survival benefits of treatment with adjuvant combination chemotherapy versus single‐agent therapy for resected pancreatic ductal adenocarcinoma.24 Consistent with this, we observed an increase in pancreatic survival, from 7.1% in 1991–2000 to 16.4% in 2011–2020. Finally, a relevant study on liver cancer survival (for which we found significant improvement from 6.5% in 1991–2000 to 23.7% in 2011–2020) demonstrated that the combination of immunotherapy and a targeted agent maintained clinically meaningful survival benefits in patients with unresectable and metastatic hepatocellular carcinoma.25
Aboriginal peoples are notably under‐represented in cancer clinical trials, with only 1.5% participation despite comprising 3% of the Australian population.26 Research indicates a positive correlation between participation in clinical trials and improved survival rates.26 Common exclusion criteria include remote residence and comorbidities, and trials are often biased towards cancer sites that are more prevalent in non‐Aboriginal populations.27 Ensuring equitable access to clinical trials could enhance outcomes for Aboriginal peoples and would improve knowledge on treatment and care responses for this population.
While survival improvements were evident for all 15 cancer sites that we included in our study over the 30‐year period, five cancers did not show significant improvement, possibly because of small numbers of these cancers in the NT population. Comparison with national trends shows similar patterns of survival for pancreatic cancers (improving from 2010 onwards) and cancers of the oral cavity and pharynx (consistent improvement from the 1990s).6 Leukaemia survival improved from 1991–2000 (42.5%) to 2001–2010 (60.2%), but this improvement was not maintained in 2011–2020 (52.1%). This differs from trends observed nationally, which identify a consistent improvement in leukaemia survival; this warrants further investigation in the NT. Similarly, kidney cancer survival improved from 72.8% to 78.6% in the NT; however, a decrease was observed in the middle years, to 67.4% in 2001–2010, which differed from Australian trends. Cervical cancer survival has seen a steady improvement nationally, with the gains in the NT only occurring after 2000. This followed the introduction of the National Cervical Screening Program in 1991 and the introduction of the human papillomavirus vaccine in the NT for females in 2007, with vaccinations expanded to males in 2013. Further, the NT has commenced developing a framework to eliminate cervical cancer, aligning with international and national commitments to eliminate cervical cancer as a public health problem by 2035.28
Limitations
Limitations arose in precision of estimates, which may have affected our ability to identify trends among rare cancers. Application of the period method may have underestimated survival in the most recent 10‐year period, but it enabled more contemporary reporting. Consistent with Australia‐wide reporting, we reported age‐specific rates of relative survival; thus, due to the younger age composition of the NT population, we could not compare specific survival estimates directly to national survival statistics but we could compare overall trends.6
Conclusions
Survival rates for both Aboriginal and non‐Aboriginal populations in the NT have improved across major cancer sites in the past three decades. The gap in survival remains for Aboriginal peoples, with only a marginal narrowing for Aboriginal females and a smaller, negligible narrowing for Aboriginal males compared with the non‐Aboriginal population. While progress in screening, diagnostics and treatment has contributed to enhanced survival, there remains a crucial need to comprehensively address inequities, overcome barriers in culturally sensitive ways with initiatives led by Aboriginal peoples, and ensure accessibility to services.
Box 1 – Demographic characteristics of Northern Territory residents diagnosed with invasive cancer between 1 January 1991 and 31 December 2020
|
Characteristic |
Aboriginal |
Non‐Aboriginal |
Total |
||||||||||||
|
|
|||||||||||||||
|
Total cases included in analysis |
3350 |
14 409 |
17 759 |
||||||||||||
|
Age group (years) |
|
|
|
||||||||||||
|
0–19 |
90 |
174 |
264 |
||||||||||||
|
20–44 |
590 |
2030 |
2620 |
||||||||||||
|
45–59 |
1306 |
4680 |
5986 |
||||||||||||
|
60–74 |
1082 |
5510 |
6592 |
||||||||||||
|
≥ 75 |
282 |
2015 |
2297 |
||||||||||||
|
Sex |
|
|
|
||||||||||||
|
Male |
1578 |
8635 |
10 213 |
||||||||||||
|
Female |
1772 |
5774 |
7546 |
||||||||||||
|
10‐year period of diagnosis |
|
|
|
||||||||||||
|
1 January 1991 – 31 December 2000 |
659 |
2916 |
3575 |
||||||||||||
|
1 January 2001 – 31 December 2010 |
1097 |
4539 |
5636 |
||||||||||||
|
1 January 2011 – 31 December 2020 |
1594 |
6954 |
8548 |
||||||||||||
|
Cases excluded from analysis* |
13 |
15 |
28 |
||||||||||||
|
|
|||||||||||||||
|
* Twenty‐seven cases were excluded due to the diagnosis being recorded on a death certificate only, and one was excluded as it was missing a date of diagnosis. |
|||||||||||||||
Box 2 – Five‐year age‐adjusted relative survival for all cancers combined, by Indigenous status, sex and 10‐year period of diagnosis, 1 January 1991 to 31 December 2020
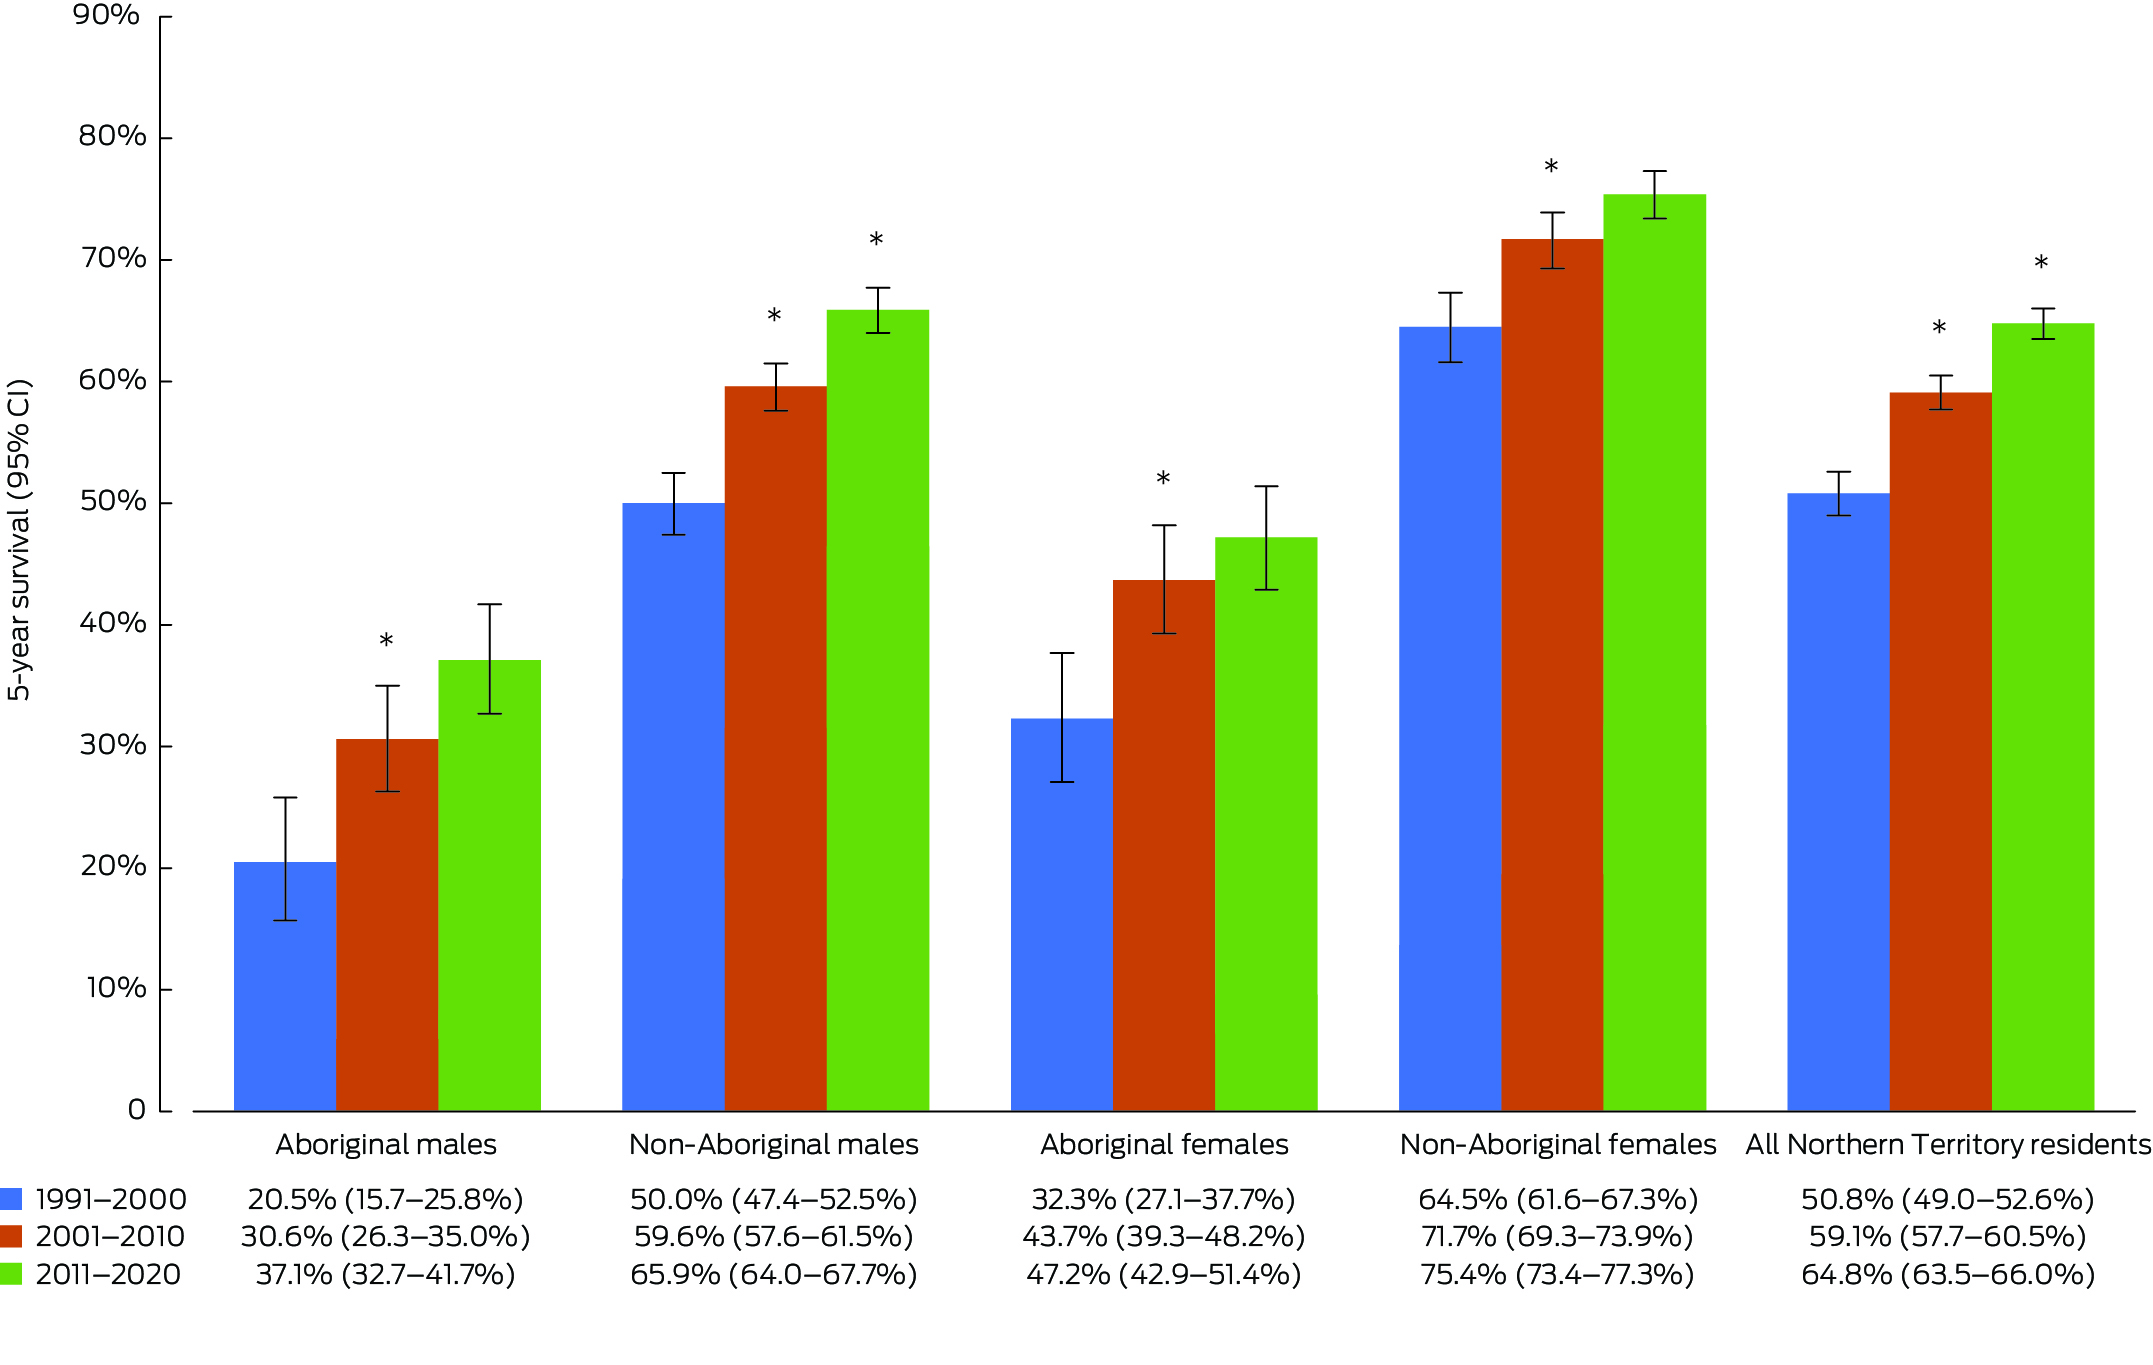
* Statistically significant improvement compared with the previous 10‐year period (P < 0.05).
Box 3 – Five‐year survival, by cancer site and 10‐year period of diagnosis, 1 January 1991 to 31 December 2020
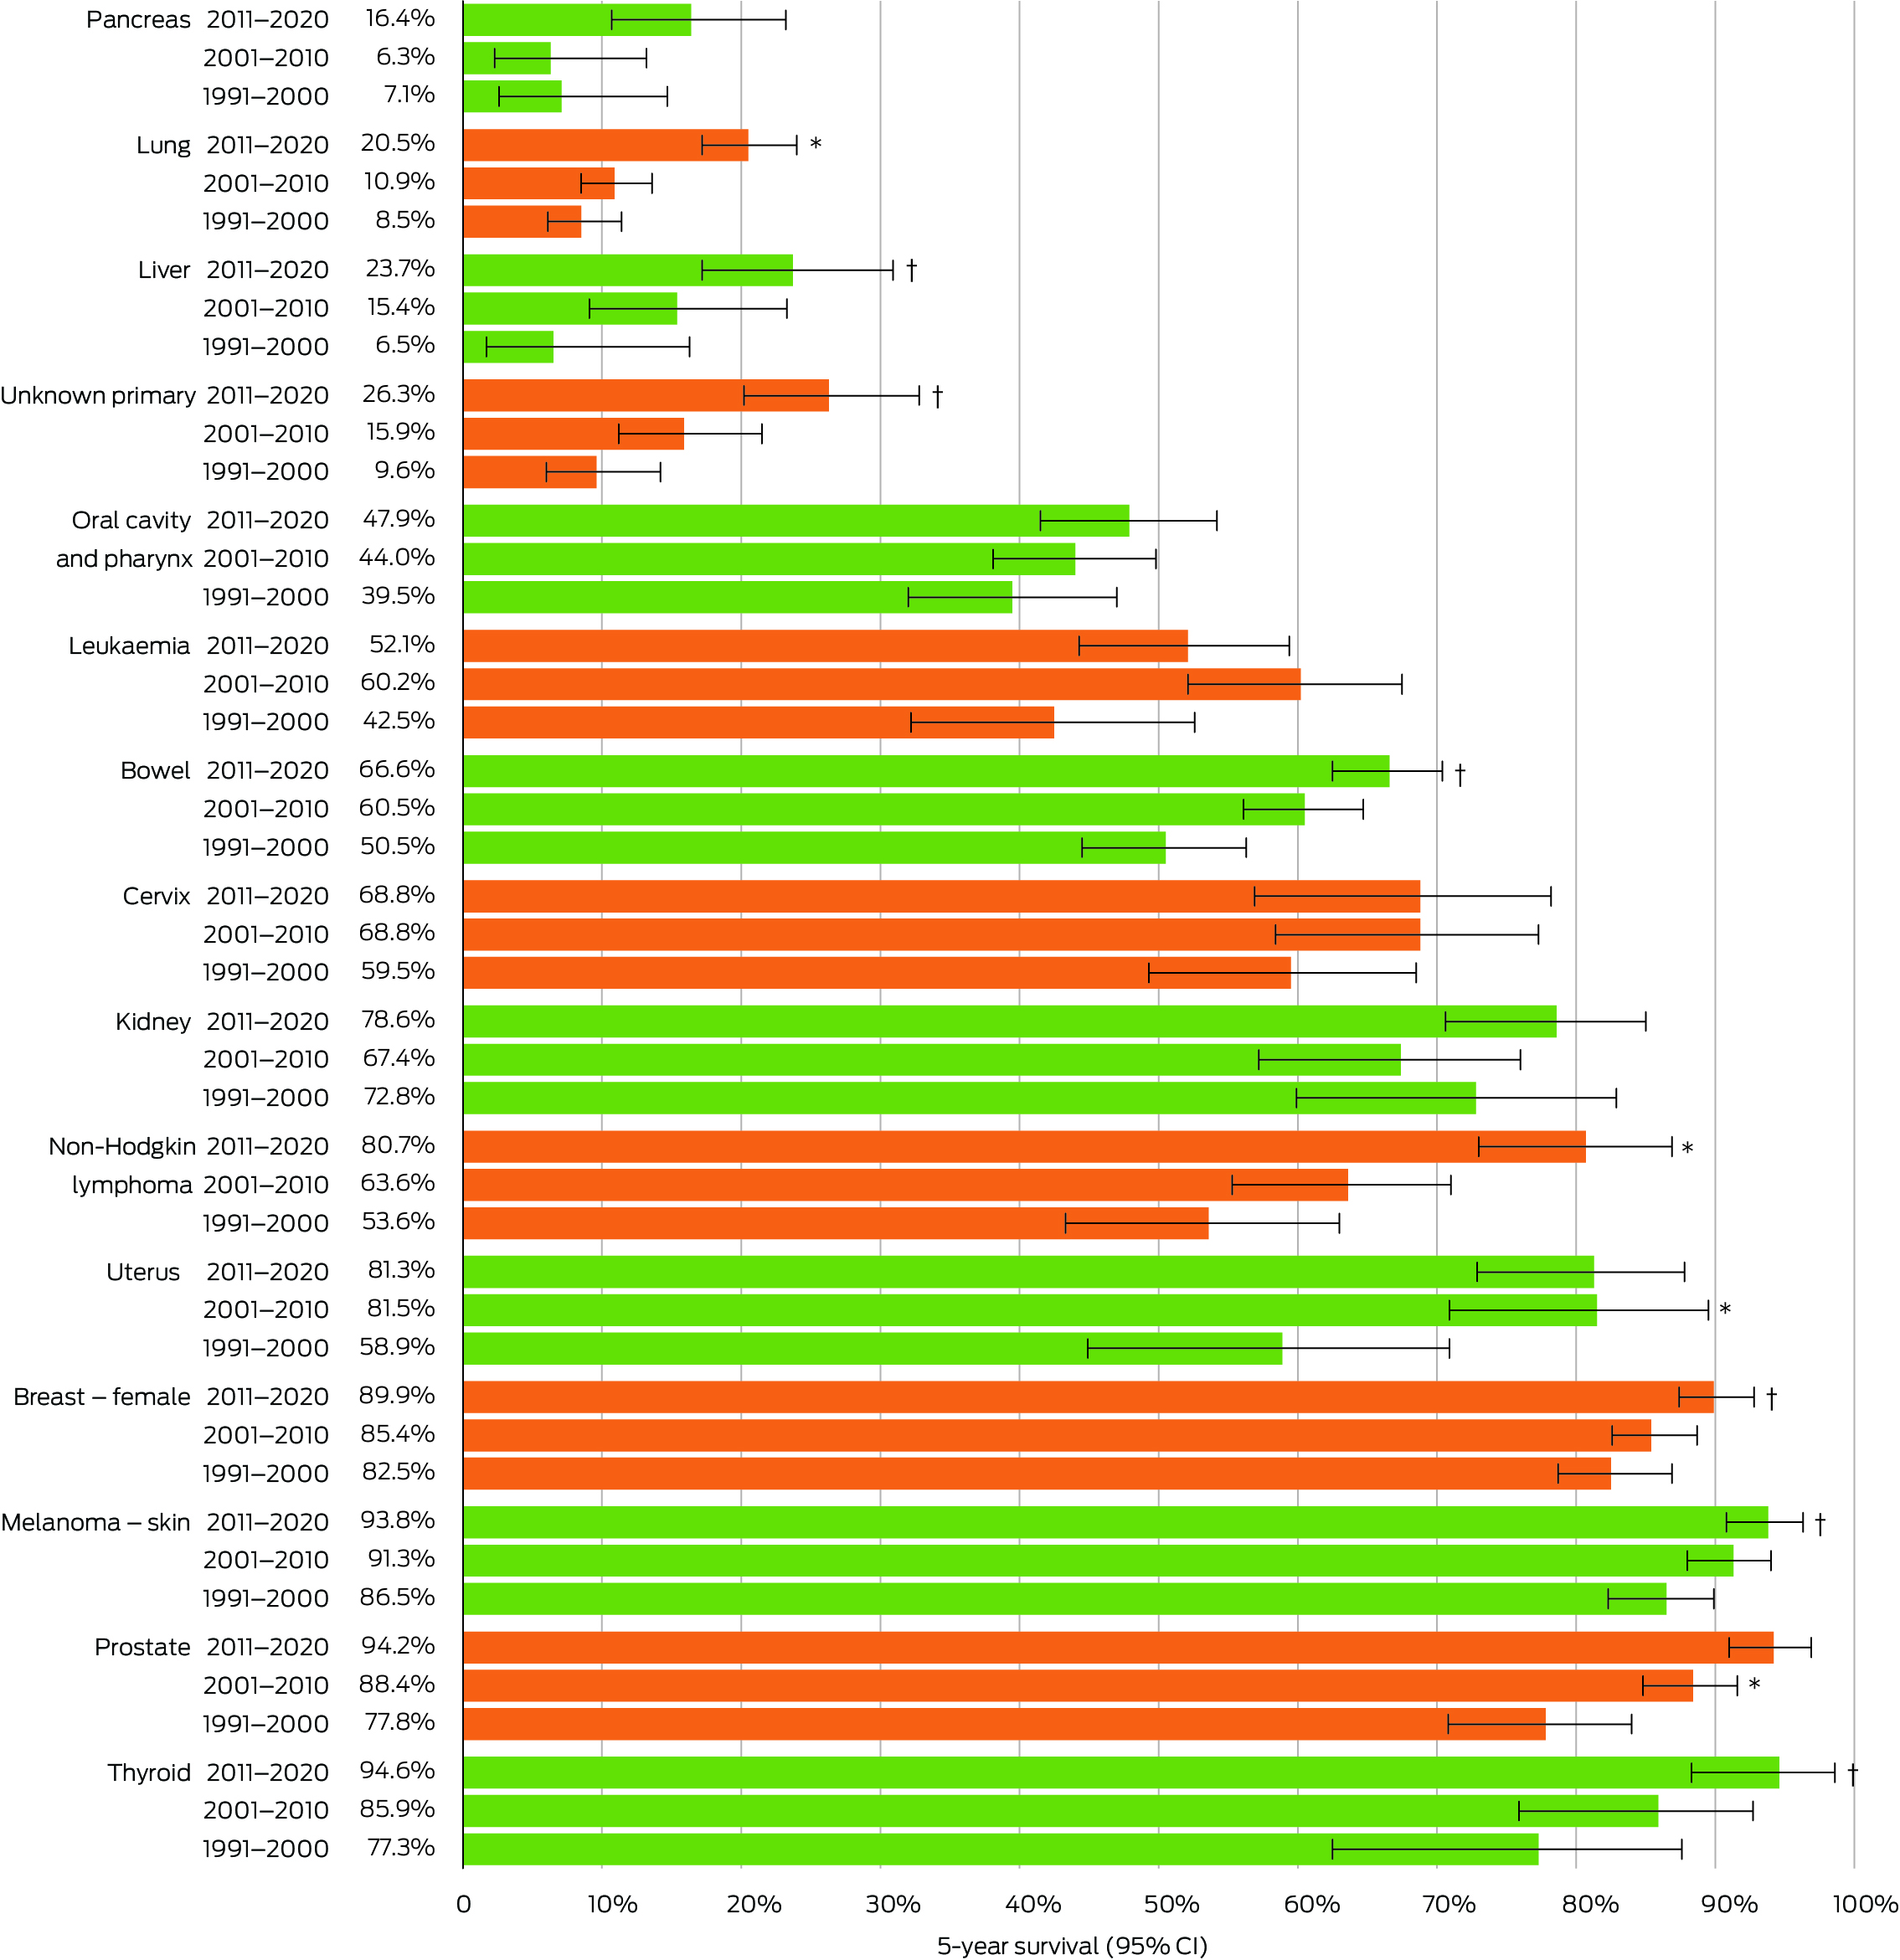
* Statistically significant improvement compared with the previous 10‐year period (P < 0.05). † Statistically significant improvement compared with 1991–2000 (P < 0.05).
Box 4 – Cancer notifications, age‐standardised incidence and 5‐year survival, by Indigenous status and cancer site, and excess hazard ratio for cancer mortality for Aboriginal versus non‐Aboriginal peoples, 1 January 2011 to 31 December 2020
|
|
Aboriginal |
Non‐Aboriginal |
Aboriginal v non‐Aboriginal |
||||||||||||
|
Cancer site (ICD‐10) |
Number of cases |
Incidence per 100 000 population (95% CI) |
Percentage 5‐year survival (95% CI) |
Number of cases |
Incidence per 100 000 population (95% CI) |
Percentage 5‐year survival (95% CI) |
Excess hazard ratio (95% CI) |
||||||||
|
|
|||||||||||||||
|
All cancers combined (C00–C96, D45–D46, D47.1, D47.3–D47.5) |
1594 |
423.5 (399.3–447.7) |
42.6 (39.5–45.7) |
6954 |
475.1 (462.4–487.7) |
69.7 (68.4–71.1) |
3.3 (3.0–3.6)* |
||||||||
|
Oral cavity and pharynx (C01–C14) |
134 |
31.4 (25.5–37.3) |
33.8 (23.8–44.4) |
249 |
16.4 (14.1–18.7) |
55.7 (47.5–63.3) |
3.1 (2.2–4.4)* |
||||||||
|
Bowel (C18–C20) |
84 |
22.4 (16.7–28.1) |
53.3 (38.6–66.8) |
827 |
57.3 (52.8–61.7) |
67.9 (63.7–71.9) |
2.1 (1.4–3.2)* |
||||||||
|
Liver (C22) |
148 |
43.0 (35.0–51.0) |
17.2 (8.6–28.7) |
138 |
9.5 (7.8–11.3) |
28.6 (19.7–38.3) |
1.3 (0.9–1.7) |
||||||||
|
Pancreas (C25) |
49 |
16.2 (11.0–21.3) |
12.9 (4.3–27.2) |
146 |
12.3 (10.0–14.5) |
17.5 (10.9–25.6) |
1.5 (1.0–2.1) |
||||||||
|
Lung (C33–C44) |
235 |
67.9 (58.1–77.7) |
13.2 (8.1–19.8) |
671 |
52.1 (47.6–56.5) |
22.9 (19.0–27.1) |
1.6 (1.3–1.9)* |
||||||||
|
Melanoma of skin (C43) |
10 |
2.4 (0.7–4.2) |
98.8 (48.1–100) |
919 |
54.1 (49.9–58.2) |
93.7 (90.8–96.2) |
NR |
||||||||
|
Breast – female (C50) |
182 |
81.0 (67.5–94.4) |
79.2 (69.5–87.2) |
890 |
116.5 (107.9–125.1) |
92.1 (89.1–94.5) |
3.3 (1.9–5.6)* |
||||||||
|
Cervix (C53) |
36 |
14.6 (9.3–20.0) |
44.1 (25.6–61.8) |
60 |
6.9 (5.1–8.7) |
84.0 (69.7–92.1) |
5.0 (2.0–12.3)* |
||||||||
|
Uterus (C54–C55) |
59 |
24.7 (17.8–31.5) |
70.0 (52.1–83.8) |
137 |
18.5 (15.1–21.9) |
86.0 (76.3–92.6) |
4.6 (1.7–12.7)* |
||||||||
|
Prostate (C61) |
43 |
34.0 (22.3–45.8) |
86.7 (61.0–100) |
868 |
112.6 (104.2–121.0) |
94.6 (91.3–97.3) |
6.1 (1.9–19.4)* |
||||||||
|
Kidney (C64) |
28 |
6.7 (3.8–9.6) |
57.2 (28.4–81.1) |
177 |
11.0 (9.2–12.8) |
81.3 (73.1–87.6) |
3.9 (1.9–9.4)* |
||||||||
|
Thyroid (C73) |
62 |
13.8 (9.6–17.9) |
88.2 (73.2–97.6) |
131 |
7.6 (6.2–8.9) |
97.8 (90.8–100) |
NR |
||||||||
|
Non‐Hodgkin lymphoma (C82–C86) |
20 |
4.7 (2.3–7.1) |
61.0 (31.3–84.1) |
204 |
14.1 (11.9–16.4) |
82.6 (74.7–88.9) |
5.9 (2.0–17.0)* |
||||||||
|
Leukaemia (C91–C95) |
52 |
10.9 (7.2–14.7) |
37.0 (21.9–52.5) |
186 |
12.1 (9.9–14.2) |
56.4 (47.5–64.6) |
3.3 (2.1–5.3)* |
||||||||
|
Unknown primary (C76, C80) |
81 |
27.4 (20.5–34.2) |
9.8 (4.2–18.3) |
152 |
12.1 (9.9–14.3) |
35.0 (26.6–43.5) |
3.2 (2.3–4.4)* |
||||||||
|
|
|||||||||||||||
|
ICD‐10 = International statistical classification of diseases and related health problems, 10th revision. NR = not reported (case numbers too small for comparison). * Statistically significant difference (P < 0.05) between Aboriginal and non‐Aboriginal groups. |
|||||||||||||||
Received 29 May 2024, accepted 6 November 2024
- Rowena Boyd1
- Michail Charakidis1,2,3
- C Paul Burgess1
- Sarah Dugdale1
- Craig Castillon (Jawoyn, Katherine Region, NT)1
- Dzulfikaar Sutandar1
- Alyson Wright1
- 1 Northern Territory Department of Health, Darwin, NT
- 2 Royal Darwin Hospital, Darwin, NT
- 3 Charles Darwin University, Darwin, NT
Data Sharing:
Legislated restrictions prevent this data being shared. Data can be requested from the Northern Territory Cancer Registry https://health.nt.gov.au/data‐and‐research/Innovation‐and‐research/northern‐territory‐cancer‐registry/ntcr‐data‐release‐guidelines.
No relevant disclosures.
- 1. National Indigenous Australians Agency. History of Closing the Gap. https://www.closingthegap.gov.au/resources/history (viewed Feb 2024).
- 2. Condon JR, Zhang X, Dempsey K, et al. Trends in cancer incidence and survival for Indigenous and non‐Indigenous people in the Northern Territory. Med J Aust 2016; 205: 454‐458. https://www.mja.com.au/journal/2016/205/10/trends‐cancer‐incidence‐and‐survival‐indigenous‐and‐non‐indigenous‐people
- 3. Boyd R. Cancer in the Northern Territory, 1991‐2020 [fact sheet]. Darwin: NT Health, 2023. https://health.nt.gov.au/__data/assets/pdf_file/0013/1323040/cancer‐nt‐1991‐to‐2020‐factsheet.PDF (viewed Mar 2024).
- 4. Zhao Y, Chondur R, Li S, Burgess P. Mortality burden of disease and injury in the Northern Territory 1999‐2018. Darwin: NT Health, 2022. https://health.nt.gov.au/__data/assets/pdf_file/0008/1149461/Mortality‐burden‐of‐disease‐and‐injury‐in‐the‐Northern‐Territory‐1999‐2018.pdf (viewed Oct 2024).
- 5. Zhao Y, Li S, Wilson T, Burgess P. Improved life expectancy for Indigenous and non‐Indigenous people in the Northern Territory, 1999–2018: overall and by underlying cause of death. Med J Aust 2022; 217: 30‐35. https://www.mja.com.au/journal/2022/217/1/improved‐life‐expectancy‐indigenous‐and‐non‐indigenous‐people‐northern‐territory
- 6. Australian Institute of Health and Welfare. Cancer data in Australia. Canberra: AIHW, 2023. https://www.aihw.gov.au/reports/cancer/cancer‐data‐in‐australia/contents/survival (viewed Feb 2024).
- 7. Australian Bureau of Statistics. National, state and territory population. Canberra: ABS, 2023. https://www.abs.gov.au/statistics/people/population/national‐state‐and‐territory‐population/dec‐2022 (viewed June 2023).
- 8. Dickman PW, Coviello E. Estimating and modeling relative survival. Stata J 2015; 15: 186‐215.
- 9. Minas TZ, Kiely M, Ajao A, Ambs S. An overview of cancer health disparities: new approaches and insights and why they matter. Carcinogenesis 2021; 42: 2‐13.
- 10. Read DJ, Frentzas S, Ward L, et al. Do histopathological features of breast cancer in Australian Indigenous women explain the survival disparity? A two‐decade long study in the Northern Territory. Asia Pac J Clin Oncol 2020; 16: 348‐355.
- 11. Goodwin BC, Rowe AK, Crawford‐Williams F, et al. Geographical disparities in screening and cancer‐related health behaviour. Int J Environ Res Public Health 2020; 17: 1246.
- 12. Cancer Australia. Australian Cancer Plan. https://www.canceraustralia.gov.au/australian‐cancer‐plan (viewed Oct 2024).
- 13. National Aboriginal Community Controlled Health Organisation. Aboriginal and Torres Strait Islander Cancer Plan. https://www.naccho.org.au/app/uploads/2024/02/NACCHO_CancerPlan_Oct2023_FA_online.pdf (viewed Oct 2024).
- 14. Cancer Australia. National Pancreatic Cancer Roadmap [website]. https://pancreaticroadmap.canceraustralia.gov.au (viewed Oct 2024).
- 15. NT Health. Northern Territory Cancer Care Strategy 2018‐2022. Darwin: Northern Territory Government, 2019. https://digitallibrary.health.nt.gov.au/nthealthserver/api/core/bitstreams/336ce354‐cd27‐4f32‐a0df‐3de415a3fb7a/content (viewed Apr 2024).
- 16. Northern Territory Government, Aboriginal Medical Services Alliance Northern Territory, Northern Territory Primary Health Network. Healthy, well and thriving – the Northern Territory's early intervention framework for chronic conditions 2024–2030. https://health.nt.gov.au/__data/assets/pdf_file/0007/1405564/healthy‐well‐and‐thriving‐2024‐2030.pdf (viewed Oct 2024).
- 17. Williams C, Kander Y, Law K, et al. Culturally focused pre‐surgery screening to reduce Aboriginal and Torres Strait Islander patient surgical cancellations. J Perioper Nurs 2021; 34: e‐34‐e‐41.
- 18. Condon J, Barnes T, Armstrong B, et al. Stage at diagnosis and cancer survival for Indigenous Australians in the Northern Territory. Med J Aust 2005; 182: 277‐280. https://www.mja.com.au/journal/2005/182/6/stage‐diagnosis‐and‐cancer‐survival‐indigenous‐australians‐northern‐territory
- 19. Cancer Australia. National Lung Cancer Screening Program. https://www.canceraustralia.gov.au/key‐initiatives/national‐lung‐cancer‐screening‐program (viewed Mar 2025).
- 20. Arnold M, Rutherford MJ, Bardot A, et al. Progress in cancer survival, mortality, and incidence in seven high‐income countries 1995–2014 (ICBP SURVMARK‐2): a population‐based study. Lancet Oncol 2019; 20: 1493‐1505.
- 21. Markham MJ, Wachter K, Agarwal N, et al. Clinical cancer advances 2020: annual report on progress against cancer from the American Society of Clinical Oncology. J Clin Oncol 2020; 38: 1081‐1106.
- 22. Douillard JY, Rosell R, De Lena M, et al. Adjuvant vinorelbine plus cisplatin versus observation in patients with completely resected stage IB–IIIA non‐small‐cell lung cancer (Adjuvant Navelbine International Trialist Association [ANITA]): a randomised controlled trial. Lancet Oncol 2006; 7: 719‐727.
- 23. Wolchok JD, Chiarion‐Sileni V, Gonzalez R, et al. Long‐term outcomes with nivolumab plus ipilimumab or nivolumab alone versus ipilimumab in patients with advanced melanoma. J Clin Oncol 2022; 40: 127‐137.
- 24. Conroy T, Castan F, Lopez A, et al. Five‐year outcomes of FOLFIRINOX vs gemcitabine as adjuvant therapy for pancreatic cancer: a randomized clinical trial. JAMA Oncol 2022; 8: 1571‐1578.
- 25. Cheng AL, Qin S, Ikeda M, et al. Updated efficacy and safety data from IMbrave150: atezolizumab plus bevacizumab vs sorafenib for unresectable hepatocellular carcinoma. J Hepatol 2022; 76: 862‐873.
- 26. Xu G, Modi D, Hunter KE, et al. Landscape of clinical trial activity focusing on Indigenous health in Australia: an overview using clinical trial registry data from 2008‐2018. BMC Public Health 2022; 22: 971‐982.
- 27. Cunningham J, Garvey G. Are there systematic barriers to participation in cancer treatment trials by Aboriginal and Torres Strait Islander cancer patients in Australia? Aust N Z J Public Health 2021; 45: 39‐45.
- 28. Australian Centre for the Prevention of Cervical Cancer. National Strategy for the Elimination of Cervical Cancer in Australia. 2023. https://www.health.gov.au/sites/default/files/2023‐11/national‐strategy‐for‐the‐elimination‐of‐cervical‐cancer‐in‐australia.pdf (viewed Oct 2024).
Abstract
Objectives: To investigate cancer survival for Aboriginal and non‐Aboriginal peoples in the Northern Territory during the period 1991–2020, across the 15 most prevalent primary cancer sites.
Study design: Retrospective cohort study of Northern Territory Cancer Registry notifications.
Setting, participants: NT residents diagnosed with an invasive cancer from 1 January 1991 to 31 December 2020.
Main outcome measures: Five‐year survival for all cancers and for 15 primary cancer sites by 10‐year periods of diagnosis, and excess hazard ratios comparing excess mortality following cancer diagnosis for Aboriginal peoples compared with non‐Aboriginal peoples.
Results: Of 17 759 cancer registrations analysed, 3350 (18.9%) had Indigenous status recorded as Aboriginal. Five‐year survival improved significantly from 1991–2000 to 2011–2020 for all populations, including Aboriginal (males, 20.5% to 37.1%; females, 32.3% to 47.2%) and non‐Aboriginal (males, 50.0% to 65.9%; females, 64.5% to 75.4%). The gap in 5‐year cancer survival for Aboriginal peoples closed by 12.4% (4.0 percentage difference) for females, but only by 2.4% (0.7 percentage difference) for males. For all 15 cancer sites, 5‐year survival improved, but Aboriginal peoples experienced excess mortality, ranging from an excess hazard ratio of 1.3 for mortality following diagnosis of liver cancer to 6.1 for prostate cancer during the period 2011–2020.
Conclusions: Cancer survival has improved for Aboriginal and non‐Aboriginal peoples in the NT. However, the gap in survival outcomes for Aboriginal peoples persists. Further research is required on pathways to close the gap, including: improving access to care, understanding social and cultural factors, reducing diagnostic and treatment delays, and promoting greater equity of Aboriginal participation in clinical trials. Quality improvement approaches led by Aboriginal peoples should be prioritised to tailor culturally appropriate preventive strategies.