


The known: Mean hospital length of stay declined in Australia during the period 1993–94 to 2001–02, while the number of hospital admissions and the bed utilisation rate increased.
The new: Hospital utilisation data for the period 1993–94 to 2019–20 indicate that the decline in mean hospital length of stay has slowed considerably, particularly for people aged 75 years or more. The proportions of admissions and bed utilisation for people in this age group have increased.
The implications: Restricting the availability of beds and reducing hospital lengths of stay may have reached their limits.
The population of the developed world is ageing rapidly.1 Older adults are more likely to present to hospital with more than one health condition, and multimorbidity is associated with longer hospital stays.2,3 Consequently, pressure on hospital capacity is expected to increase, as are the mean costs of patient care.4
The number of public hospital beds, relative to population size, has steadily declined in recent years, but the number of presentations has increased.5 The Australasian College for Emergency Medicine reported that the number of hospital presentations per 1000 people increased by 3% between 2016–17 and 2020–21, but that the number of available hospital beds per 1000 people declined by 4%.6 This has led to hospitals frequently operating beyond the 85% bed occupancy rate recommended by the Australian Medical Association.7 A high degree of bed occupancy has negative consequences for hospital care, particularly in emergency departments,8,9 including higher risks of hospital‐associated infections and poorer staff health.9
We have previously reported that the impact of rising admission numbers on bed occupancy rates during 1993–2002 had been offset by the declining mean length of stay for multiple day hospitalisations; further, the proportion of beds occupied by older patients remained constant, despite population ageing.10 However, a recent European modelling study projected that offsetting demand by reducing lengths of stay would become insufficient by 2030, by which point the shift in demand to beds for the care of older people and for chronic care would dominate.11
To determine whether a similar change might be emerging in Australia, we have extended our earlier examination of hospital admissions, hospital bed utilisation, and mean length of stay, to cover the period 1993–94 to 2019–20.
Methods
We examined Australian Institute of Health and Welfare (AIHW) separation statistics for private and public hospitals for the financial years 1993–94 to 2019–20.12 Data were downloaded as CSV files and graphs were prepared in Excel (Microsoft).
We extracted data on numbers of hospital separations, hospital bed utilisation (bed‐days), and mean hospital length of stay (days). Hospital separations include hospital discharges, transfers from one care type to another, and deaths. Bed utilisation is recorded by the AIHW as “one” for same‐day separations (eg, renal dialysis; people admitted from an emergency department and discharged on the same day) and as the number of nights for multiple day admissions (midnight as the census point). Hospital length of stay was based on total stay (acute and sub‐acute) and calculated by subtracting the date of admission from the date of separation, less any leave days. Further information about definitions are available on the AIHW METEOR website.13
AIHW data are reported by 5‐year age group; as in our earlier publication,10 we report summary data (absolute numbers and proportions) and bed utilisation rates for three age categories (under 65 years, 65–74 years, 75 years or more) and mean hospital length of stay for six categories (under 65, 65–69, 70–74, 75–79, 80–84, 85 years or more). We calculated population hospital separation and bed utilisation rates (number per 1000 population) using Australian Bureau of Statistics annual population estimates.14 We also calculated a projected bed utilisation figure for each financial year by applying the 1993–94 rate to the corresponding population number.
Ethics approval
As our report is based on publicly available data, we did not seek formal ethics approval.
Results
The Australian population increased from 17.6 million in 1993–94 to 25.7 million in 2019–20 (44% growth). The number of people aged 75 years or more increased 115%, from 815 584 (4.6% of the population) to 1 754 435 (6.9%) (Box 1). The changes in hospital utilisation across this period are summarised in Box 2.
Hospital separations
The annual total number of hospital separations increased from 4.61 million in 1993–94 to 11.33 million in 2019–20 (146% increase): from 3.30 million to 6.49 million for people under 65 years of age (96% increase), from 0.70 million to 2.28 million for people aged 65–74 years (226% increase), and from 0.61 million to 2.57 million for people aged 75 years or more (323% increase) (Box 3). The proportion of separations for people aged 75 years or more increased from 13.2% to 22.7%.
The annual number of same‐day separations increased from 1.70 million to 6.76 million (298% increase); the number for people aged 75 years or more increased from 0.13 million to 1.42 million (977% increase). The annual number of multiple day separations increased from 2.91 million to 4.55 million (56% increase); the number for people aged 75 years or more increased from 0.47 million to 1.14 million (141% increase).
The annual hospital separation rate increased from 261 per 1000 people in 1993–94 to 435 per 1000 people in 2019–20 (66% increase): from 212 to 294 per 1000 people under 65 years of age (39% increase), from 565 to 971 per 1000 people aged 65–74 years (72% increase), and from 745 to 1441 per 1000 people aged 75 years or more (94% increase).
The annual multiple day hospital separation rate increased from 165 per 1000 people in 1993–94 to 167 per 1000 people in 2019–20 (1% increase). The rate declined from 129 to 114 per 1000 people under 65 years of age (11% decline) and from 346 to 306 per 1000 people aged 65–74 years (12% decline) for people aged 75 years or more, the rate rose from 582 to 676 separations per 1000 people in 2016–17 (16% increase), then fell to 631 per 1000 people in 2019–20 (8% increase since 1993–94) (Box 4).
Bed utilisation
Total bed utilisation increased from 21.0 million bed‐days in 1993–94 to 29.9 million bed‐days in 2019–20 (42% increase). The proportion of bed‐days for patients under 65 years of age declined from 53.4% to 50.5%, remained stable at about 18.5% for those aged 65–74 years, and increased from 28.2% to 30.9% for patients aged 75 years or more (Box 5).
The total bed utilisation rate was 1192 bed‐days per 1000 people in 1993–94 and 1179 bed‐days per 1000 people in 2019–20. The multiple day admission rate declined from 1096 to 912 per 1000 people (17% reduction): it declined from 637 to 528 bed‐days per 1000 people under 65 years of age (17% reduction), from 2919 to 1774 bed‐days per 1000 people aged 65–74 years (39% reduction), and from 7098 to 4453 bed‐days per 1000 people aged 75 years or more (37% reduction) (Box 6).
Projected bed utilisation
Actual bed utilisation was 16.8% lower in 2019–20 than projected from the rate for 1993–94: 17.1% lower for people under 65 years of age (1.13 million v 1.36 million), 39.3% for people aged 65–74 years (4.05 million v 6.67 million), and 37.3% lower for people aged 75 years or more (7.81 million v 12.45 million) (Box 7).
Mean hospital length of stay
The mean length of stay for multiple day hospital admissions declined from 6.6 days in 1993–94 to 5.4 days in 2019–20 (18% reduction). For patients under 65 years of age it declined from 4.9 to 4.6 days (7% reduction), for people aged 65–74 from 8.4 to 5.8 days (31% reduction), and for people aged 75 years or more from 12.2 to 7.1 days (42% reduction); the mean stay for patients aged 85 years or more declined from 15.2 to 7.7 days (49% reduction). The decline in all age groups has slowed markedly since 2017–18 (Box 8).
Discussion
We have described bed utilisation in Australian public and private hospitals during 1993–94 to 2019–20, with a particular focus on use by older people. We have previously reported that the number and population rate of hospital admissions of people aged 65 years or more had increased during 1993–94 to 2002–03, but the proportion of beds occupied by patients in this age group had not markedly changed, primarily because mean hospital length of stay declined for people aged 75 years or more and the number of admissions of people aged 65–74 years had declined.10 The number of hospital admissions continued to increase during 2002–03 to 2019–20, most markedly admissions of people aged 75 years or more, but the decline in mean length of stay has slowed, with minimal change for any age group in the past few years. The bed utilisation rate has continued to decline for all age groups, but the proportion for people aged 75 years or more has increased.
Most studies of hospital service use do not report these characteristics by age group, making comparisons difficult. The changes in Australia were broadly similar to those reported in the United States, where overall mean length of stay declined by 0.2% per year during 2003–2012, and bed utilisation declined from 64% to 62% during 2007–2017.15
Shorter hospital stays, particularly for older people, could be explained by the increasing availability of alternative care models (eg, the Transition Care Program,16 home care packages), improved hospital processes and practices (eg, discharge planning, care coordination), and improved clinical care (eg, early patient mobility). However, shorter hospital stays could also reflect inappropriate discharge practices. Investigations of associations between reduced length of stay and adverse outcomes, such as 30‐day re‐admissions, often find no significant association17 or that longer stays are a risk factor for re‐admission.18 Changes in mean hospital length of stay could also reflect changes in administrative or coding practices, such as increases in the numbers of administrative transfers within hospitals and same‐day transfers between hospitals on the same site. Linkage of data across multiple time points would be needed to determine whether the changes in separation numbers and length of stay are associated; that is, to assess whether people are released from hospital early only to be re‐admitted with related problems.
Nevertheless, the decline in hospital length of stay could not continue indefinitely, and there is evidence that the limit has been approached during the past few years,11 posing challenges for hospital systems and policy makers. Members of the “baby boomer” generation, the oldest of whom are now more than 75 years old, have more health risk factors than earlier generations, including physical inactivity, low fruit and vegetable intake, and higher prevalence of obesity and diabetes.19 Combined with declining mortality rates, these complex, chronic health conditions will increase the pressure on hospital systems, even if hospital stays are as short as reasonably possible and care is diverted to outpatient or hospital‐in‐the‐home settings when feasible.15
Health service planning, provision, and policy will need to be adjusted in response to population ageing. For instance, hospital bed utilisation and length of stay have not declined markedly for people under 65 years of age; reducing both would be one avenue for relieving the burden on hospitals. Indeed, it has been reported that hospital utilisation during the final one to three years of life is greater for middle‐aged (55–64 years) than older patients (65 years or more), and greatest for people aged 35–44 years.20 Technological advances may help reduce hospital stays for younger patients, but investing more in the prevention of chronic and age‐related diseases will be important, including treating disease risk factors early, reducing their prevalence, preventing or slowing the progression of disease, and reducing morbidity and complication rates.21 Other approaches include training and new care pathways for older adults, social reorganisation to ensure that care is both accessible and used, and ensuring that older adults remain integrated in their communities.22
Limitations
AIHW hospital data are comprehensive, include data for both public and private hospitals across Australia, and cover more than 25 years. However, the data were available only in aggregate form, so we could not delve deeper into differences by disease status or location. Further, we could not determine from these data the factors that influence changes in hospital bed use, nor whether rises in recorded admission numbers reflect real increases or are an artifact of coding changes or clinical practices, including greater numbers of sub‐acute care beds, hospital substitution, and increased use of the maintenance care classification. Analysis of longitudinal data linked with other health and medical records would be needed to address these questions.
Conclusion
Hospital bed utilisation rates declined and separation rates increased during 1993–94 to 2019–20. The proportion of beds occupied by people aged 75 years or more increased, associated with a slow in the decline of mean hospital length of stay. Containing hospital costs by limiting bed availability and reducing length of stay may not be viable in the near future. The capacity of a health system to provide care depends not only on bed availability but also on the ability to substitute ambulatory and home‐based alternatives for traditional overnight care. Life course disease prevention and health promotion are also important for improving health in older people and reducing the need for acute care across life.
Hospital bed utilisation should be re‐examined in the next five to ten years to determine, among other questions, the impact on hospitals of the more than 5.5 million baby boomers,23 most of whom will by then be 75 years of age or older. The ongoing health impact of COVID‐19, including persistent impairment of exercise capacity, chronic fatigue, and damage to body systems and organs,24 may also contribute to chronic health conditions, causing even greater pressure on hospital systems. Epidemiologists, public health experts, and policy makers should monitor these factors in order to mitigate future risks.
Box 1 – Australian population, 1993–94 to 2019–20, by age group*
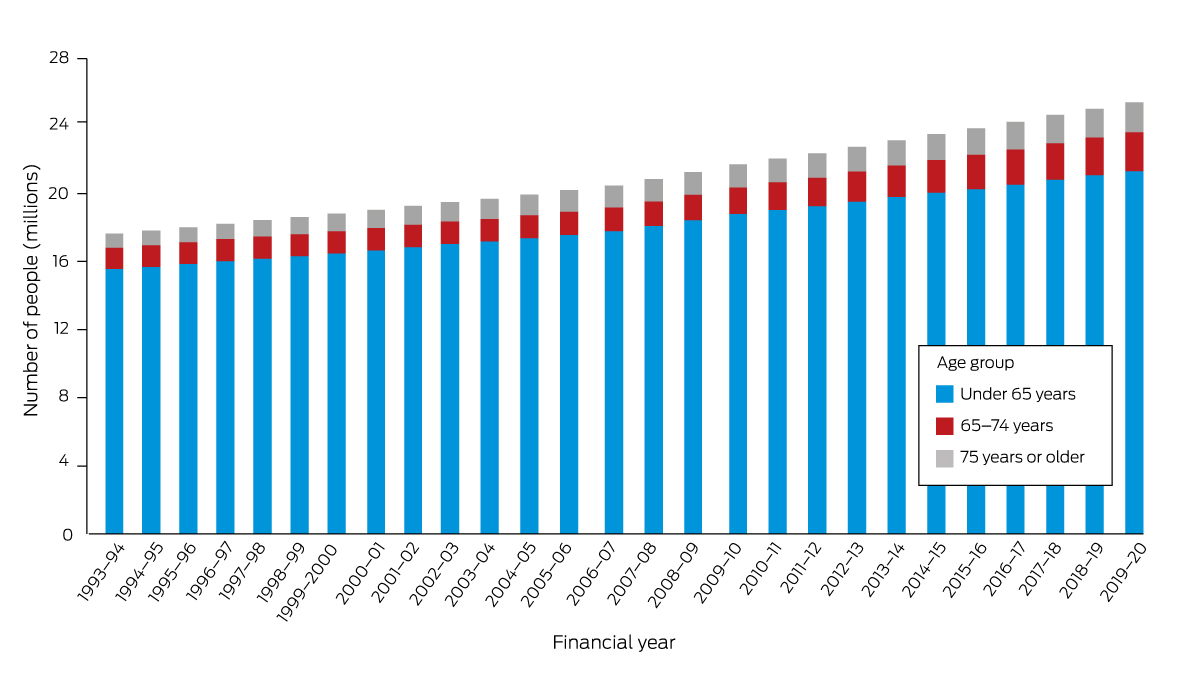
* Data source: Australian Bureau of Statistics.14 The data for this figure are included in the Supporting Information, table 1; age‐group‐based population proportions are depicted in the Supporting Information, figure 1.
Box 2 – Hospital utilisation, Australia (public and private), 1993–94 and 2019–20: summary, by age group*
|
Characteristic/age group (years) |
1993–94 |
2019–20 |
Proportional difference |
||||||||||||
|
|
|||||||||||||||
|
Population change |
17 634 808 |
25 365 745 |
44% |
||||||||||||
|
0–64 |
15 582 160 |
21 325 615 |
37% |
||||||||||||
|
65–74 |
1 237 064 |
2 285 695 |
85% |
||||||||||||
|
≥ 75 |
815 584 |
1 754 435 |
115% |
||||||||||||
|
All admissions |
4 608 764 |
11 326 362 |
146% |
||||||||||||
|
Separations |
|
|
|
||||||||||||
|
0–64 |
3 302 860 |
6 485 342 |
96% |
||||||||||||
|
65–74 |
698 641 |
2 274 367 |
226% |
||||||||||||
|
≥ 75 |
607 263 |
2 566 653 |
323% |
||||||||||||
|
Separation rate (per 1000 population) |
261 |
435 |
66% |
||||||||||||
|
0–64 |
212 |
294 |
39% |
||||||||||||
|
65–74 |
565 |
971 |
72% |
||||||||||||
|
≥ 75 |
745 |
1441 |
94% |
||||||||||||
|
Length of stay (days), mean |
4.6 |
2.7 |
–40% |
||||||||||||
|
0–64 |
3.4 |
2.40 |
–29% |
||||||||||||
|
65–74 |
5.6 |
2.5 |
–55% |
||||||||||||
|
≥ 75 |
9.8 |
3.7 |
–63% |
||||||||||||
|
Bed utilisation (bed‐days) |
21 022 925 |
29 905 564 |
42% |
||||||||||||
|
0–64 |
11 220 678 |
15 095 516 |
35% |
||||||||||||
|
65–74 |
3 881 263 |
5 575 478 |
44% |
||||||||||||
|
≥ 75 |
5 920 984 |
9 234 570 |
56% |
||||||||||||
|
Bed utilisation rate (per 1000 population) |
1192 |
1179 |
–1% |
||||||||||||
|
0–64 |
720 |
708 |
–2% |
||||||||||||
|
65–74 |
3137 |
2439 |
–22% |
||||||||||||
|
≥ 75 |
7260 |
5264 |
–28% |
||||||||||||
|
Same day admissions |
|
|
|
||||||||||||
|
Separations |
1 696 837 |
6 780 817 |
+300% |
||||||||||||
|
0–64 |
1 294 969 |
3 836 954 |
+196% |
||||||||||||
|
65–74 |
269 791 |
1 521 442 |
+464% |
||||||||||||
|
≥ 75 |
132 077 |
1 422 421 |
+977% |
||||||||||||
|
Separation rate (per 1000 population) |
96.22 |
267.32 |
178% |
||||||||||||
|
0–64 |
83.11 |
179.92 |
117% |
||||||||||||
|
65–74 |
218.09 |
665.64 |
205% |
||||||||||||
|
≥ 75 |
161.94 |
810.76 |
401% |
||||||||||||
|
Multiple day admissions |
|
|
|
||||||||||||
|
Separations |
2 911 927 |
4 545 545 |
56% |
||||||||||||
|
0–64 |
2 007 891 |
2 648 388 |
32% |
||||||||||||
|
65–74 |
428 850 |
752 925 |
76% |
||||||||||||
|
≥ 75 |
475 186 |
1 144 232 |
141% |
||||||||||||
|
Separation rate (per 1000 population) |
165 |
167 |
1% |
||||||||||||
|
0–64 |
129 |
114 |
–11% |
||||||||||||
|
65–74 |
346 |
306 |
–12% |
||||||||||||
|
≥ 75 |
582 |
631 |
8% |
||||||||||||
|
Length of stay (days), mean |
6.6 |
5.4 |
–18% |
||||||||||||
|
0–64 |
4.9 |
4.6 |
–7% |
||||||||||||
|
65–74 |
8.4 |
5.8 |
–31% |
||||||||||||
|
≥ 75 |
12.2 |
7.1 |
–42% |
||||||||||||
|
Bed utilisation (bed‐days) |
19 326 088 |
23 124 747 |
+20% |
||||||||||||
|
0–64 |
9 925 709 |
11 258 562 |
+13% |
||||||||||||
|
65–74 |
3 611 472 |
4 054 036 |
+12% |
||||||||||||
|
≥ 75 |
5 788 907 |
7 812 149 |
+35% |
||||||||||||
|
Bed utilisation rate (per 1000 population) |
1096 |
912 |
–17% |
||||||||||||
|
0–64 |
637 |
528 |
–17% |
||||||||||||
|
65–74 |
2919 |
1774 |
–39% |
||||||||||||
|
≥ 75 |
7098 |
4453 |
–37% |
||||||||||||
|
|
|||||||||||||||
|
* Data source: Australian Institute of Health and Welfare.12 |
|||||||||||||||
Box 3 – All hospital separations, Australia (public and private), 1993–94 to 2019–20, by age group*
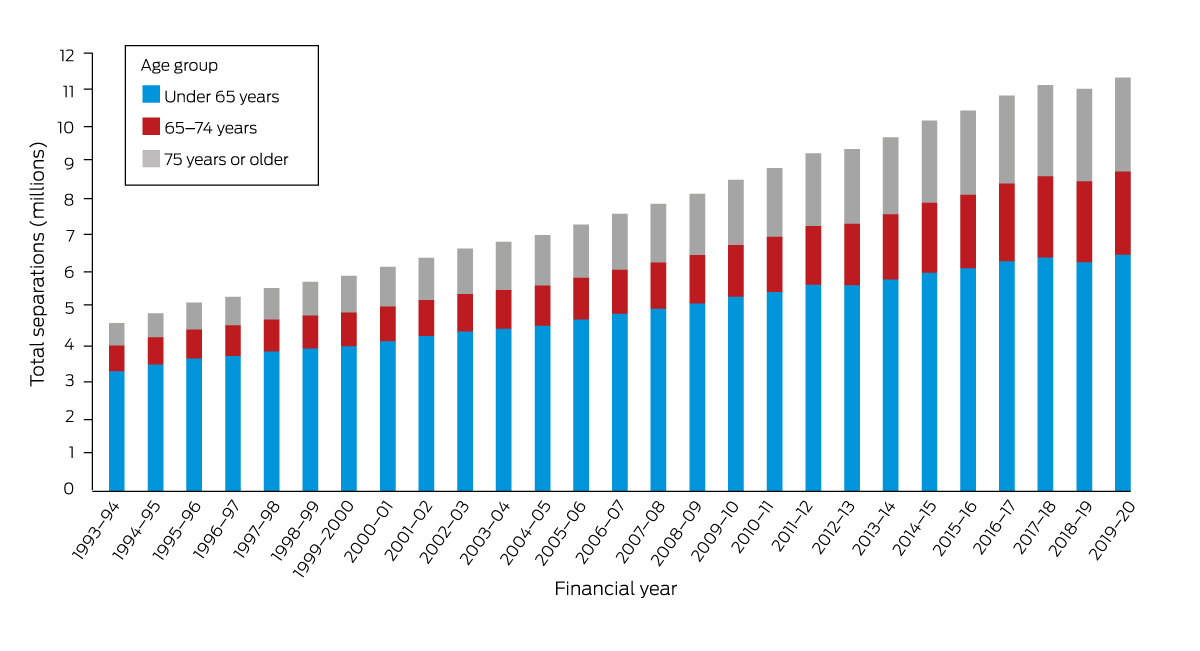
* Data source: Australian Institute of Health and Welfare.12 The data for this figure are included in the Supporting Information, table 2; age‐group‐based population proportions are depicted in the Supporting Information, figure 2.
Box 4 – Multiple day hospital separation rate (per 1000 population), Australia (public and private), 1993–94 to 2019–20, by age group*
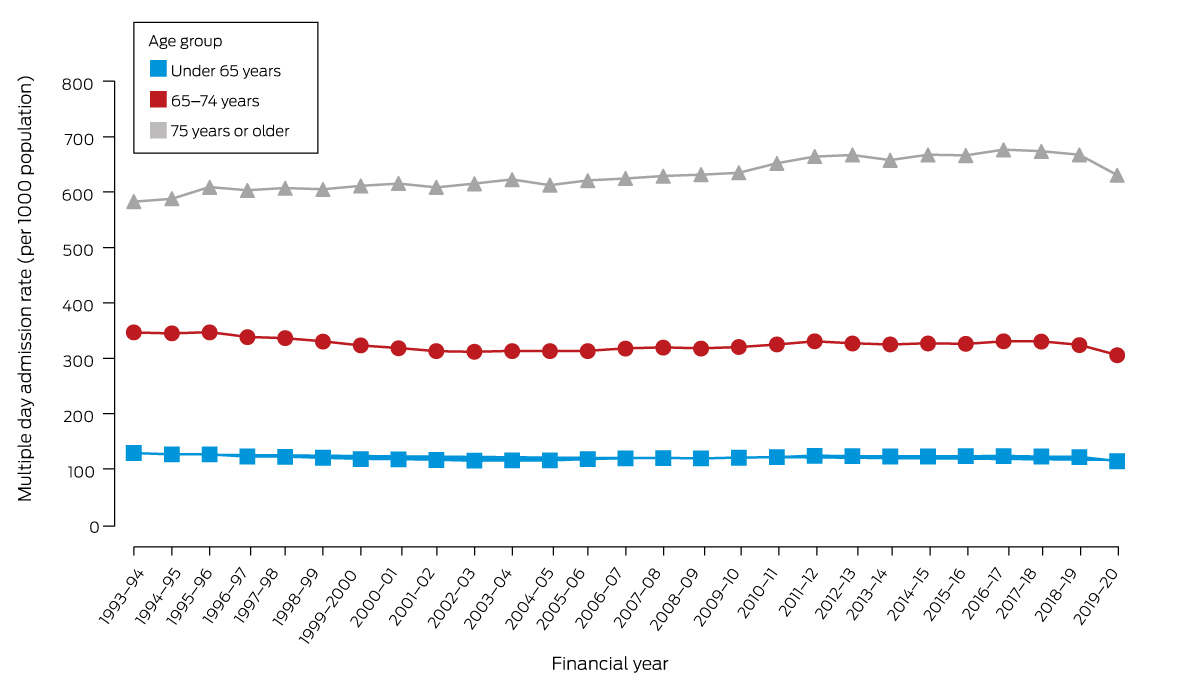
* Data source: Australian Institute of Health and Welfare.12 The data for this figure are included in the Supporting Information, table 3.
Box 5 – Total hospital bed utilisation, Australia (public and private), 1993–94 to 2019–20, by age group*
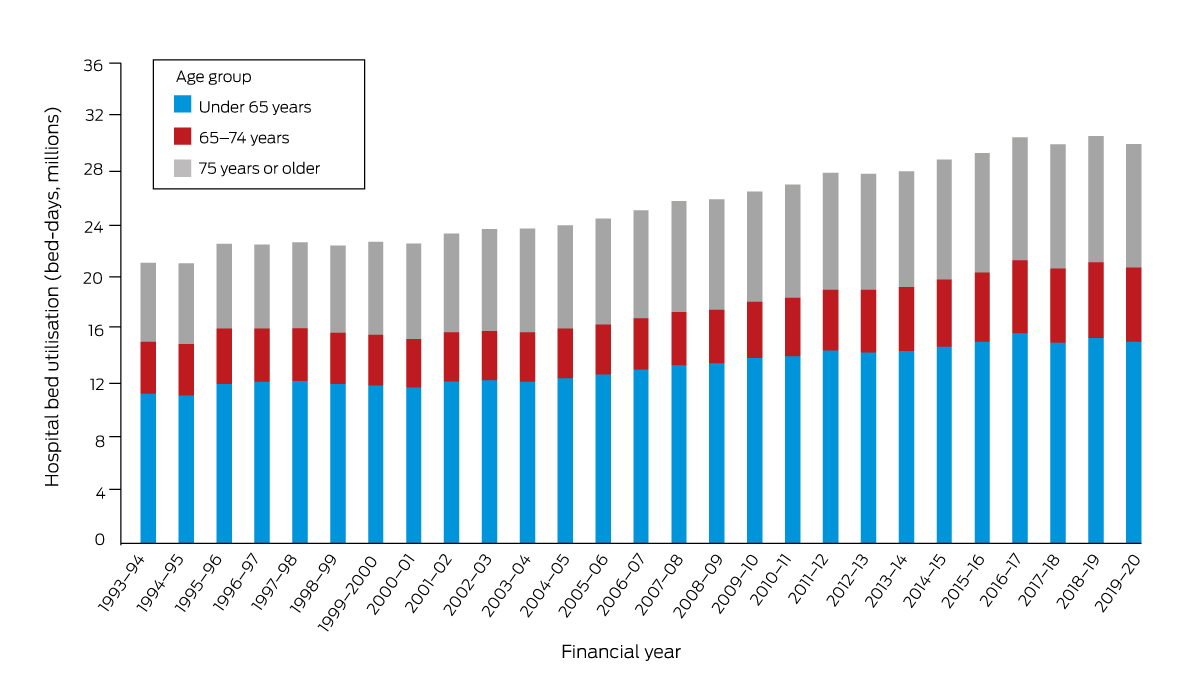
* Data source: Australian Institute of Health and Welfare.12 The data for this figure are included in the Supporting Information, table 4; age‐group‐based population proportions are depicted in the Supporting Information, figure 3.
Box 6 – Multiple day admission hospital bed utilisation rates, Australia (public and private), 1993–94 to 2019–20, by age group*
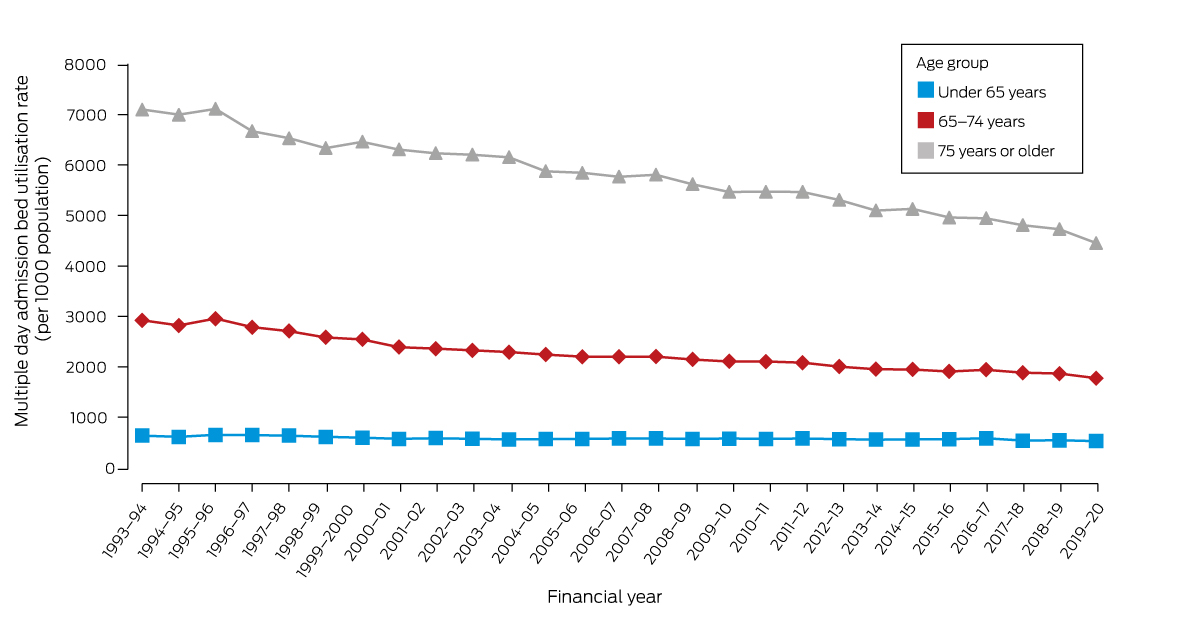
* Data source: Australian Institute of Health and Welfare.12 The data for this figure are included in the Supporting Information, table 5.
Box 7 – Actual and projected (based on 1993–94 rate) multiple day hospital bed utilisation, Australia (public and private), 1993–94 to 2019–20*
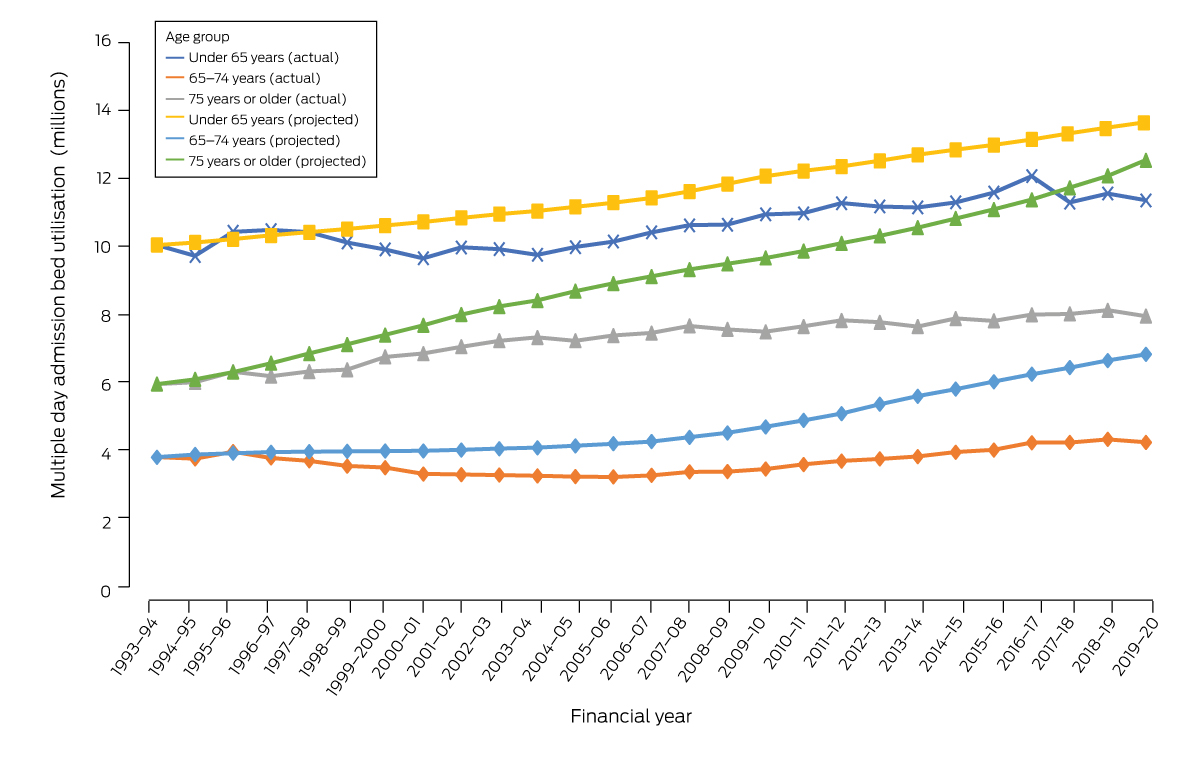
* Data source: Australian Institute of Health and Welfare.12 The data for this figure are included in the Supporting Information, table 6.
Box 8 – Mean hospital length of stay for multiple day admissions, Australia (public and private), 1993–94 to 2019–20, by age group*
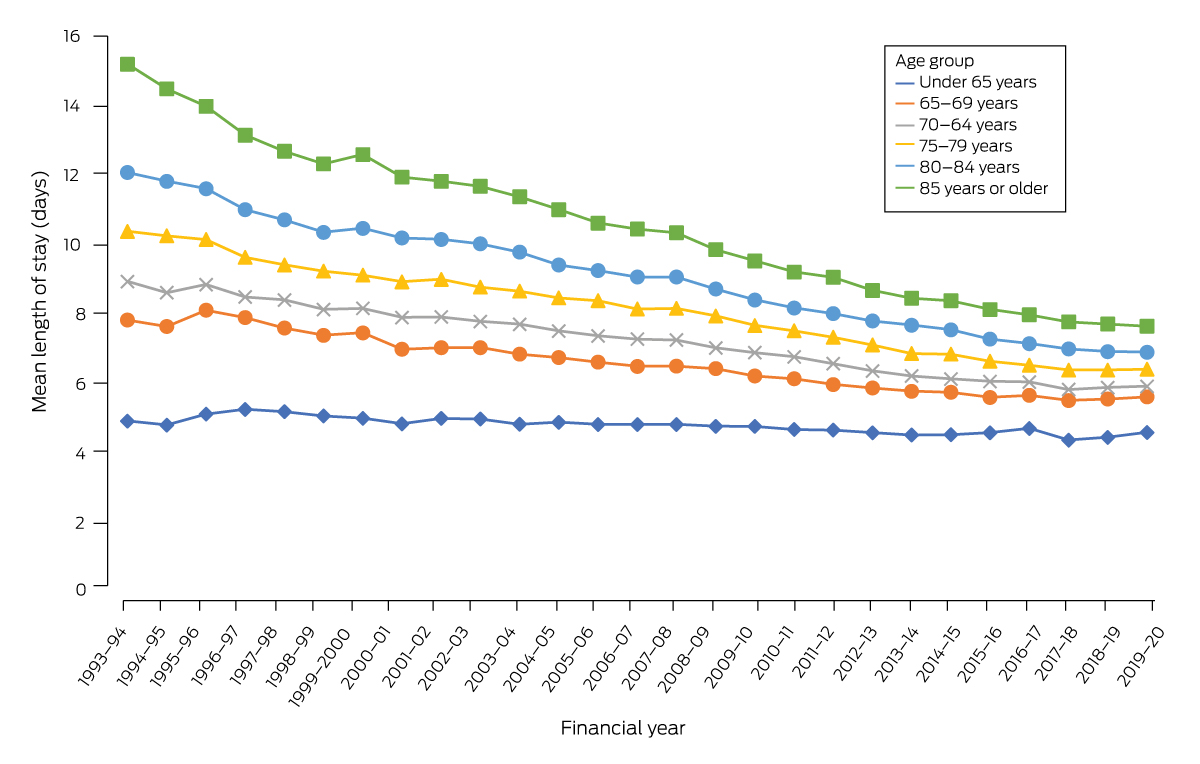
* Data source: Australian Institute of Health and Welfare.12 The data for this figure are included in the Supporting Information, table 7.
Received 7 November 2022, accepted 29 May 2023
- Natasha Reid1
- Thakeru Gamage1
- Stephen J Duckett2
- Leonard C Gray1
- 1 Centre for Health Services Research, the University of Queensland, Brisbane, QLD
- 2 The University of Melbourne, Melbourne, VIC
Open access:
Open access publishing facilitated by The University of Queensland, as part of the Wiley ‐ The University of Queensland agreement via the Council of Australian University Librarians.
No relevant disclosures.
- 1. World Health Organization; National Institute on Aging (US); National Institutes of Health (US). Global health and aging (NIH publication no. 11‐7737). Oct 2011. https://www.nia.nih.gov/sites/default/files/2017‐06/global_health_aging.pdf (viewed June 2022).
- 2. Bähler C, Huber CA, Brüngger B, Reich O. Multimorbidity, health care utilization and costs in an elderly community‐dwelling population: a claims data based observational study. BMC Health Serv Res 2015; 15: 23.
- 3. Ruiz M, Bottle A, Long S, Aylin P. Multi‐morbidity in hospitalised older patients: who are the complex elderly? PLoS One 2015; 10: e0145372.
- 4. Calver J, Brameld KJ, Preen DB, et al. High‐cost users of hospital beds in Western Australia: a population‐based record linkage study. Med J Aust 2006; 184: 393‐397. https://www.mja.com.au/journal/2006/184/8/high‐cost‐users‐hospital‐beds‐western‐australia‐population‐based‐record‐linkage
- 5. Forero R, Hillman KM, McCarthy S, et al. Access block and ED overcrowding. Emerg Med Australas 2010; 22: 119‐135.
- 6. Australasian College for Emergency Medicine. State of emergency 2022, version 1.0. Nov 2022. https://acem.org.au/getmedia/81b2f4f8‐c0f2‐46a0‐86c1‐64b7d1d311c2/State‐of‐Emergency‐D32‐MSTC (viewed Mar 2023).
- 7. Australian Medical Association. Public hospital report card 2011. 3 Nov 2011. https://www.ama.com.au/articles/ama‐public‐hospital‐report‐card‐2011 (viewed June 2022).
- 8. Innes G. Sorry: we're full! Access block and accountability failure in the health care system. CJEM 2015; 17: 171‐179.
- 9. Keegan AD. Hospital bed occupancy: more than queuing for a bed. Med J Aust 2010; 193: 291‐293. https://www.mja.com.au/journal/2010/193/5/hospital‐bed‐occupancy‐more‐queuing‐bed
- 10. Gray LC, Yeo MA, Duckett SJ. Trends in the use of hospital beds by older people in Australia: 1993–2002. Med J Aust 2004; 181: 478‐481. https://www.mja.com.au/journal/2004/181/9/trends‐use‐hospital‐beds‐older‐people‐australia‐1993‐2002
- 11. Van Den Heede K, Bouckaert N, Van de Voorde C. The impact of an ageing population on the required hospital capacity: results from forecast analysis on administrative data. Eur Geriatr Med 2019; 10: 697‐705.
- 12. Australian Institute of Health and Welfare. Principal diagnosis data cubes (Cat. no. WEB 216). Updated 8 July 2022. https://www.aihw.gov.au/reports/hospitals/principal‐diagnosis‐data‐cubes (viewed Mar 2023).
- 13. Australian Institute of Health and Welfare. METEOR: metadata online registry. https://meteor.aihw.gov.au/content/181162 (viewed Mar 2023).
- 14. Australian Bureau of Statistics. National, state and territory population. Reference period December 2022. 15 June 2023. https://www.abs.gov.au/statistics/people/population/national‐state‐and‐territory‐population/dec‐2022 (viewed June 2022).
- 15. Song Z, Ferris TG. Baby boomers and beds: a demographic challenge for the ages. J Gen Intern Med 2018; 33: 367‐369.
- 16. Flinders Consulting for the Department of Health (Australia). National evaluation of the Transition Care Program. 31 May 2008. https://apo.org.au/node/2652 (viewed June 2022).
- 17. Kaboli PJ, Go JT, Hockenberry J, et al. Associations between reduced hospital length of stay and 30‐day readmission rate and mortality: 14‐year experience in 129 Veterans Affairs hospitals. Ann Intern Med 2012; 157: 837‐845.
- 18. Rachoin JS, Aplin KS, Gandhi S, et al. Impact of length of stay on readmission in hospitalized patients. Cureus 2020; 12: e10669.
- 19. Humpel N, O'Loughlin K, Wells Y, Kendig H. The health of Australian baby boomers. Australas J Ageing 2010; 29: 8‐13.
- 20. Busse R, Krauth C, Schwartz FW. Use of acute hospital beds does not increase as the population ages: results from a seven year cohort study in Germany. J Epidemiol Community Health 2002; 56: 289‐293.
- 21. Australian Institute of Health Welfare. Australia's health 2014 (Cat. no. AUS 178). Canberra: AIHW, 2014. https://www.aihw.gov.au/reports/australias‐health/australias‐health‐2014/overview (viewed June 2022).
- 22. Knickman JR, Snell EK. The 2030 problem: caring for aging baby boomers. Health Serv Res 2002; 37: 849‐884.
- 23. Australian Bureau of Statistics. Talkin’ ’bout our generations: where are Australia's baby boomers, generation X & Y and iGeneration? In: 3235.0. Population by age and sex, regions of Australia, 2014. 18 Aug 2015. https://www.abs.gov.au/ausstats/abs@.nsf/Previousproducts/3235.0Feature%20Article12014 (viewed June 2022).
- 24. Castanares‐Zapatero D, Chalon P, Kohn L, et al. Pathophysiology and mechanism of long COVID: a comprehensive review. Ann Med 2022; 54: 1473‐1487.
Abstract
Objectives: To assess Australian hospital utilisation, 1993–2020, with a focus on use by people aged 75 years or more.
Design: Review of Australian Institute of Health and Welfare (AIHW) hospital utilisation data.
Setting, participants: Tertiary data from all Australian public and private hospitals for the financial years 1993–94 to 2019–20.
Main outcome measures: Numbers and population‐based rates of hospital separations and bed utilisation (bed‐days) (all and multiple day admissions) and mean hospital length of day (multiple day admissions), overall and by age group (under 65 years, 65–74 years, 75 years or more).
Results: Between 1993–94 and 2019–20, the Australian population grew by 44%; the number of people aged 75 years or more increased from 4.6% to 6.9% of the population. The annual number of hospital separations increased from 4.61 million to 11.33 million (146% increase); the annual hospital separation rate increased from 261 to 435 per 1000 people (66% increase), most markedly for people aged 75 years or more (from 745 to 1441 per 1000 people; 94% increase). Total bed utilisation increased from 21.0 million to 29.9 million bed‐days (42% increase), but the bed utilisation rate did not change markedly (1993–94, 1192 bed‐days per 1000 people; 2019–20, 1179 bed‐days per 1000 people), primarily because the mean hospital length of stay for multiple day admissions declined from 6.6 days to 5.4 days; for people aged 75 years or more it declined from 12.2 to 7.1 days. However, declines in stay length have slowed markedly since 2017–18. Total bed utilisation was 16.8% lower than projected from 1993–94 rates, and was 37.3% lower for people aged 75 years or more.
Conclusion: Hospital bed utilisation rates declined although admission rates increased during 1993–94 to 2019–20; the proportion of beds occupied by people aged 75 years or more increased slightly during this period. Containing hospital costs by limiting bed availability and reducing length of stay may no longer be a viable strategy.