


The known: Some critically unwell people with COVID-19 were transferred between hospitals in Australia during the pandemic, but whether this influenced their outcomes has not been examined.
The new: People admitted to intensive care units with COVID-19 and transferred between hospitals typically received more intense treatment and more frequently experienced complications than patients who were not transferred. Their median hospital stay was longer, but their risk of dying in hospital was similar to that of patients not transferred.
The implications: Careful case selection and sustained commitment to care ensured that outcomes for critically ill patients with COVID-19 did not vary according to whether transfer to another hospital for intensive care was required.
By November 2022, the severe acute respiratory syndrome coronavirus 2 (SARS-CoV-2) had caused more than 635 million cases of coronavirus disease 2019 (COVID-19) and more than 6.6 million deaths around the world; in Australia, there had been more than 10.5 million cases and 15 000 deaths, with marked differences in case numbers between states.1 Multiple waves of infection have affected Australia since early 2020: the first from mid-March to mid-April 2020, the second in June 2020, and the third (Delta variant) wave in June 2021. In November 2021, the Omicron SARS-CoV-2 variant initiated a fourth wave that persisted into 2022.2
Australians critically unwell with COVID-19 were transferred between hospitals at different stages of the pandemic, typically to provide access to higher level care, because clinical demand was unevenly distributed, or particular hospitals were under strain. The impact of inter-hospital transfer on clinical outcomes for people with COVID-19 has been examined overseas;3,4,5,6 in France, for example, inter-hospital transfer was associated with a lower risk-adjusted probability of dying in hospital.4,5 Investigating its impact in Australia is particularly important, given the critical role played by inter-hospital transfers in the health care system.
The aim of our national cohort study was to evaluate the association between inter-hospital transfer and in-hospital mortality in people with COVID-19 admitted to intensive care units (ICUs) in Australia.
Methods
The Short Period Incidence Study of Severe Acute Respiratory Infection (SPRINT-SARI) Australia7 is a national, prospective, observational cohort study of people with COVID-19 admitted to ICUs. Data were collected from both electronic and paper medical records, entered into a REDCap database, and de-identified. The study is coordinated and the database maintained by the Australian and New Zealand Intensive Care Research Centre (ANZIC-RC) at Monash University; data quality assessment and protocol standardisation for the database has been described previously.8,9 Our reporting of the study adheres to the Strengthening and Reporting of Observational studies in Epidemiology (STROBE) statement.10
We analysed data for consecutive patients with polymerase chain reaction (PCR)-confirmed SARS-CoV-2 infections admitted to one of the 63 participating ICUs that contributed data during 1 January 2020 – 1 April 2022. Inter-hospital transfer status (no transfer or at least one transfer) was prospectively recorded in the SPRINT-SARI database for each person. A separate transfer log was maintained by the coordinating centre to allow tracking of patient movement, including the cross-checking of patient disposition by study site.
Data collection
On 7 June 2022, we extracted baseline demographic and clinical data from the SPRINT-SARI Australia database for people admitted to the participating ICUs: age, gender, body mass index (BMI), COVID-19 vaccination history, and chronic health conditions. The Acute Physiology and Chronic Health Evaluation (APACHE-II) score was calculated for each person within 24 hours of ICU admission. Comorbid conditions recorded were based on the United States Centers for Disease Control and Prevention list.11 Data on investigations and ICU treatment and interventions were collected daily until day 28 of the ICU admission; for interventions treated as categorical variables, a positive response was recorded if an intervention was provided at any point during the ICU stay. We calculated the time from symptom onset to index hospital admission (in days), from symptom onset to index ICU admission (days), from hospital admission to ICU admission (hours), and from ICU admission to intubation (days). ICU length of stay for transferred patients was calculated as the total number of days in intensive care since the index admission to hospital.
The primary outcome was in-hospital mortality; secondary outcomes were ICU and hospital lengths of stay and frequency of selected complications.
Statistical analysis
Data are summarised as counts and proportions (omitting missing data; Supporting information, table 1) or medians with interquartile ranges (IQRs) as appropriate. For categorical variables, risk differences (RDs) were estimated in a generalised linear model with binomial distribution and identity link; for continuous variables, median differences (MDs) were estimated in a quantile (median) regression model using an interior point algorithm. The 95% confidence intervals [CIs] were calculated using bootstrapping with one thousand samples for the MD and the Wald method for the RD. ICU and hospital lengths of stay were compared in Fine–Gray competing risk models that treated death before the event as a competing risk, with the result reported as a sub-distribution hazard ratio (SHR). Survival probability for the two groups is depicted in Kaplan–Meier curves. In addition to the univariable models, multivariable models for clinical outcomes were adjusted for age, BMI, APACHE II score, number of co-existing disorders, time from hospital to ICU admission, mechanical ventilation, number of patients admitted per month, and hours between consecutive admissions, with centre and week of admission as random effects.
A series of sensitivity analyses tested the consistency of our findings: models adjusted for age, APACHE II score, number of co-existing disorders, time from hospital to ICU admission, use of mechanical ventilation, and number of patients admitted per month, with hospital and week of admission as random effects (model I); models adjusted for age, use of mechanical ventilation, use of inotropic or vasopressor agents, number of co-existing disorders, time from hospital to ICU admission, and number of patients admitted per month, with hospital and week of admission as random effects (model II); and models in which a propensity score was used (as a continuous variable) to adjust for age, BMI, APACHE II score, number of co-existing disorders, time from hospital to ICU admission, use of mechanical ventilation, and number of patients admitted per month. Finally, all models were repeated after excluding people who underwent withdrawal of support, and after multiple imputation for missing data.
All analyses were performed in R 4.0.2 (R Foundation for Statistical Computing); P < 0.05 was deemed statistically significant.
Ethics approval
Approval for data collection was granted under the National Mutual Acceptance scheme, by the human research ethics committee of Alfred Health (HREC/16/Alfred/59), and after separate applications to the human research ethics committees of the participating hospitals. The requirement for written informed consent from patients or their medical treatment decision maker was waived.
Results
At 1 April 2022, data for 5207 people with PCR-confirmed COVID-19 had been recorded in the SPRINT-SARI Australia database, of whom 328 (6.3%) had been transferred between hospitals at least once, including 305 (93%) during the third pandemic wave (Supporting information, figure 1).
Compared with patients who were not transferred, the median age of those transferred was lower (MD, –7.0 [95% CI, –9.3 to –4.7] years), their median BMI was higher (MD, 2.3 kg/m2; 95% CI, 0.86–3.8 kg/m2), and fewer had received a COVID-19 vaccine (22% v 44.9%; RD, –22 [95% CI, –27 to –17] percentage points). The median APACHE II scores were similar for the two groups (MD, –0.00; 95% CI, –0.58 to 0.58). Time from hospital admission to ICU admission was marginally shorter for patients who had been transferred (MD, –3.2 [95% CI, –5.8 to –0.52] hours); time from ICU admission to intubation was similar for the two groups (MD, 0.0 [95% CI, –0.06 to 0.06] hours) (Box 1).
Interventions and complications
Larger proportions of transferred than non-transferred patients received invasive mechanical ventilation (71.2% v 38.1%), extra-corporeal membrane oxygenation (ECMO; 26% v 1.7%), vasoactive medications (89.0% v 39.5%), neuromuscular blockade (71% v 29.0%), prone positioning (64.6% v 45.3%), or renal replacement therapy (19% v 7.9%). Invasive ventilation was the highest level of respiratory support for 215 of 302 transferred patients (71.2%), ECMO for 77 of 303 (25.4%); a larger proportion of patients who were not transferred received non-invasive ventilation or high-flow nasal cannulas (46.1% v 0.3%) (Box 2).
Bacterial pneumonia was the most frequent complication in each group (transferred, 189 of 292, 64.7%; not transferred, 1132 of 3906, 29.0%; RD, 35.7 [95% CI, 30.0–41.3] percentage points). Bacteraemia was reported for 80 of 293 transferred patients (27%) and 328 of 3913 non-transferred patients (8.3%; RD, 19 [95% CI, 14–24] percentage points). Thrombosis (38 of 292, 13% v 120 of 3880, 3.1%) and arrhythmia (50 of 293, 17% v 456 of 3938, 11.6%) were also more frequent in transferred patients (Box 2).
Clinical outcomes
Crude ICU (19% v 14.9%) and in-hospital mortality (19% v 18.4%) were each similar for patients who were or were not transferred (Box 3, Box 4), but median lengths of ICU stay (20.0 [IQR, 11.2–40.3] days v 4.6 [IQR, 2.1–10.1] days) and hospital stay (29.7 [IQR, 18.1–49.6] days v 12.3 [IQR, 7.3–21.0] days) were longer for transferred patients (Box 3; Box 5). In our multivariable regression analysis, adjusted in-hospital mortality risk was lower for transferred patients (RD, –5.0 [95% CI, –10 to –0.03] percentage points); after multiple imputation, the difference was not statistically significant (Box 6).
Sensitivity analyses
In sensitivity analyses and analyses excluding patients from whom support was withdrawn, in-hospital mortality was lower for transferred than for non-transferred patients in complete case analyses. The RD values were each smaller, and in some analyses were not statistically significant, after multiple imputation of missing data. In analyses with a covariate-balancing propensity score, the RDs were generally not statistically significant (Box 6).
Discussion
In our national observational cohort study of people with COVID-19 admitted to Australian ICUs, we found that about 6% (328 of 5207) were transferred between hospitals at least once. As a group, transferred patients required greater intensity of treatment (including invasive organ support) than people who had not been transferred, and larger proportions experienced complications, particularly bacterial pneumonia and bacteraemia. Their median age was lower, the median BMI higher, and a smaller proportion had been vaccinated against SARS-CoV-2 than people not transferred. Crude in-hospital mortality was similar among patients who had or had not been transferred, but median ICU and hospital lengths of stay were each longer for those who had been transferred. After adjustment for a number of demographic, clinical, and admission factors, in-hospital mortality risk was lower in the transferred patient group, but the difference was not statistically significant in a propensity score-adjusted analysis.
We report the first Australian study to examine the relationship between inter-hospital transfer and in-hospital mortality and morbidity outcomes for people with COVID-19 admitted to ICUs. Our findings are consistent with those from other countries.3,4,5,6,12,13 A national prospective ICU observational study in France during the first pandemic wave in 2020 found that a large number of people with COVID-19 required ICU admission (18 348 patients), and that about 13% were transferred to other hospitals. The authors found that mortality was lower among transferred patients than among those not transferred.4,5
Other studies have been smaller or single-centre studies. A United Kingdom study in three London hospitals (Charing Cross, Hammersmith, St. Mary's Hospital) found that mortality was not higher for ICU patients transferred between hospitals.6 A small single-centre retrospective cohort study in the United States also found that in-hospital mortality and length of stay were not significantly different for people who underwent inter-hospital transfers and those directly admitted to intensive care from emergency departments.3
Studies of inter-hospital transfer of patients admitted to ICUs with disorders other than COVID-19 have found no statistically significant differences in mortality14 or poorer outcomes.15,16,17,18,19,20 This suggests that the nature of the underlying pathophysiology and the clinical indication for transfer are more important for outcomes. Indeed, there are clear differences in the referral patterns and clinical urgency of inter-hospital transfers (eg, the need for urgent surgical intervention) in pandemic and non-pandemic situations.
While the risk of dying in hospital was similar for critically unwell people with COVID-19 who were or were not transferred, the median ICU length of stay was more than four times as long for transferred patients, despite similar median APACHE II scores in both groups. Median total hospital length of stay was twice as long for transferred patients. This probably reflects the need for protracted or advanced organ support, or the development of complications, such as bacterial pneumonia. Whether clinical deterioration during transfer contributed to the difference is unknown, but the similar mortality rates for both groups suggests that this was unlikely.
The two cited French studies also found that inter-hospital transfer was associated with longer ICU and hospital lengths of stay,4,5 while studies of disorders other than COVID-19 have reported longer overall length of stay and a greater proportion of time in intensive care for patients transferred between hospitals.17,18,19,20
Limitations
The SPRINT-SARI Australia data we analysed were probably representative of COVID-19-related inter-hospital transfers in Australia, but there were some geographic differences in COVID-19 case numbers (ie, between states). Demographic, interventions, and outcomes data were collected by dedicated research staff at each hospital, and we used a variety of statistical analyses to maximise the robustness of our findings. However, as with all observational studies, our findings are susceptible to information bias,21 and some data were missing, as reporting requirements changed during the pandemic. Nevertheless, our major study findings were relatively unaffected by multiple imputation of missing data, and sensitivity analyses yielded results similar to those of the main analyses. As transferred patients were subject to selection bias, our findings should be interpreted cautiously; in particular, data limitations precluded our exploring the influence of clinical indication for transfer (need for higher level care or capacity limitations), bed occupancy at the index hospital, illness severity at the time of transfer, timing and distance of transfer, and the number of transfers of single patients. As larger proportions of transferred than non-transferred patients required advanced organ support (such as ECMO) and developed complications (likely to require multidisciplinary care), and they remained in the ICU and hospital longer, it is probable that most people were transferred only once, and typically to receive higher level care not available at the referring hospital. Finally, we cannot comment on the functional status of people after their discharge from hospital, an outcome of critical importance in view of the level of care provided to transferred patients.
Conclusions
Our findings indicate that inter-hospital transfers in Australia during the first two years of the COVID-19 pandemic were of patients with greater need for ICU-based care, either because of deterioration of their primary condition (COVID-19) or the development of complications. They more frequently required a higher level of invasive intervention and treatment, and remained in hospital longer. Reassuringly, in-hospital mortality was not higher than that for patients not transferred, confirming careful case selection and sustained commitment to care in Australian hospitals.
Box 1 – Baseline characteristics of the 5207 intensive care unit (ICU) patients with PCR-confirmed COVID-19 recorded in the SPRINT-SARI Australia database, 1 January 2020 – 1 April 2022
|
|
Transferred |
Not transferred |
|
||||||||||||
|
Characteristic |
Data available |
Value |
Data available |
Value |
Difference* (95% CI) |
||||||||||
|
|
|||||||||||||||
|
Total number of patients |
328 |
|
4879 |
|
|
||||||||||
|
Age (years), median (IQR) |
328 |
53 (45–61) |
4879 |
60 (46–70) |
MD, –7.0 (–9.3 to –4.7) |
||||||||||
|
> 65 years |
|
57 (17%) |
|
1809 (37.1%) |
RD, –20 (–24 to –15) |
||||||||||
|
Gender (men) |
328 |
225 (68.6%) |
4875 |
3034 (62.2%) |
RD, 6.4 (1.0 to 11.4) |
||||||||||
|
Body mass index (kg/m2), median (IQR) |
286 |
32.5 (27.2–39.0) |
3517 |
30.1 (25.7–35.7) |
MD, 2.3 (0.86 to 3.8) |
||||||||||
|
APACHE II score, median (IQR) |
294 |
14.0 (12.0–18.0) |
3967 |
14.0 (10.0–19.0) |
MD, –0.00 (–0.58 to 0.58) |
||||||||||
|
Without age component |
|
12.0 (9.0–15.0) |
|
11.0 (8.0–15.0) |
MD, 1.00 (0.23 to 1.77) |
||||||||||
|
Symptom onset to hospital admission (days), median (IQR) |
297 |
6.7 (4.2–9.0) |
3900 |
6.2 (3.2–9.0) |
MD, 0.53 (–0.04 to 1.1) |
||||||||||
|
Symptom onset to ICU admission (days), median (IQR) |
293 |
8.1 (5.5–10.6) |
3896 |
7.6 (4.4–11) |
MD, 0.50 (–0.08 to 1.1) |
||||||||||
|
Hospital to ICU admission (hours), median (IQR) |
322 |
7.9 (2.5–44) |
4859 |
11.2 (4.1–51) |
MD, –3.2 (–5.8 to –0.52) |
||||||||||
|
Between consecutive admissions (hours), median (IQR)† |
321 |
22.1 (9.0–46.8) |
4799 |
23.5 (8.3–64) |
MD, –1.4 (–5.7 to 2.8) |
||||||||||
|
ICU admission to intubation (days), median (IQR) |
308 |
1.0 (0.0–2.0) |
1788 |
1.0 (0.0–2.0) |
MD, 0.0 (–0.06 to 0.06) |
||||||||||
|
Healthcare worker |
105 |
1 (1%) |
1155 |
54 (4.7%) |
RD, –3.7 (–7.8 to 0.4) |
||||||||||
|
Pregnant |
90 |
3 (3%) |
1593 |
105 (6.6%) |
RD, –3.3 (–6.2 to 1.9) |
||||||||||
|
COVID-19 vaccination |
302 |
68 (22%) |
4355 |
1954 (44.9%) |
RD, –22 (–27 to –17) |
||||||||||
|
Number of vaccine doses |
68 |
|
1944 |
|
P < 0.001‡ |
||||||||||
|
One |
|
42 (62%) |
|
437 (22.5%) |
|
||||||||||
|
Two |
|
22 (32%) |
|
1002 (51.5%) |
|
||||||||||
|
Three |
|
4 (6%) |
|
498 (25.6%) |
|
||||||||||
|
Four |
|
0 |
|
7 (0.4%) |
|
||||||||||
|
Time from the most recent dose median (IQR) |
62 |
|
1708 |
|
P < 0.001‡ |
||||||||||
|
Less than 7 days |
|
14 (23%) |
|
88 (5.2%) |
|
||||||||||
|
7–14 days |
|
10 (16%) |
|
140 (8.2%) |
|
||||||||||
|
More than 14 days |
|
38 (61%) |
|
1480 (86.7%) |
|
||||||||||
|
Vaccine type |
68 |
|
1801 |
|
P = 0.53‡ |
||||||||||
|
Pfizer/BioNTech |
|
38 (56%) |
|
812 (45.1%) |
|
||||||||||
|
Oxford/AstraZeneca |
|
27 (40%) |
|
852 (47.3%) |
|
||||||||||
|
Novavax |
|
0 |
|
5 (0.3%) |
|
||||||||||
|
Moderna |
|
1 (2%) |
|
57 (3.2%) |
|
||||||||||
|
Other |
|
2 (3%) |
|
75 (4.2%) |
|
||||||||||
|
Co-existing disorders: number |
|
|
|
|
P = 0.007‡ |
||||||||||
|
0 |
|
117 (36%) |
|
1563 (32.0%) |
|
||||||||||
|
1 |
|
86 (26%) |
|
1181 (24.2%) |
|
||||||||||
|
2 |
|
69 (21%) |
|
899 (18.4%) |
|
||||||||||
|
3 or more |
|
56 (17%) |
|
1236 (25.3%) |
|
||||||||||
|
Co-existing disorders: type |
|
|
|
|
|
||||||||||
|
Diabetes |
296 |
85 (29%) |
4274 |
1369 (32.0%) |
RD, –3.3 (–8.5 to 2.2) |
||||||||||
|
Obesity |
293 |
122 (42%) |
4187 |
1190 (28.4%) |
RD, 13 (7.5 to 19) |
||||||||||
|
ACEi or ARB used |
292 |
59 (20%) |
4228 |
951 (22.5%) |
RD, –2.3 (–6.8 to 2.7) |
||||||||||
|
Chronic cardiac failure |
294 |
31 (10%) |
4261 |
784 (18.4%) |
RD, –7.9 (–11 to –3.8) |
||||||||||
|
Tobacco use |
283 |
51 (18%) |
4133 |
727 (17.6%) |
RD, 0.43 (–3.9 to 5.3) |
||||||||||
|
Chronic pulmonary disease |
294 |
20 (6.8%) |
4251 |
435 (10.2%) |
RD, –3.4 (–6.1 to –0.06) |
||||||||||
|
Asthma |
294 |
35 (12%) |
4243 |
499 (11.8%) |
RD, 0.14 (–3.4 to 4.3) |
||||||||||
|
Immunosuppression |
294 |
19 (6.5%) |
4212 |
471 (11.2%) |
RD, –4.7 (–7.4 to –1.4) |
||||||||||
|
Chronic kidney disease |
293 |
12 (4.1%) |
4248 |
457 (10.8%) |
RD, –6.7 (–8.8 to –3.8) |
||||||||||
|
Chronic haematological disease |
294 |
4 (1%) |
4254 |
174 (4.1%) |
RD, –3 (–4 to –0.9) |
||||||||||
|
Cancer |
294 |
8 (3%) |
4247 |
170 (4.0%) |
RD, –1 (–3 to 1) |
||||||||||
|
|
|||||||||||||||
|
APACHE = Acute Physiology and Chronic Health Evaluation; ACEi = angiotensin-converting enzyme inhibitor; ARB = angiotensin II receptor blocker; COVID-19 = coronavirus disease 2019; IQR = interquartile range; MD = median difference; PCR = polymerase chain reaction; RD = risk difference. * Transferred v not transferred: risk difference (difference in proportions, as percentage points) for categorical variables, median difference for continuous variables. † In the same ICU. ‡ Fisher exact test. |
|||||||||||||||
Box 2 – Interventions and development of complications according to transfer status for patients with COVID-19 admitted to an intensive care unit (ICU) in Australia, 1 January 2020 – 1 April 2022
|
|
Transferred |
Not transferred |
|
||||||||||||
|
Characteristic |
Data available |
Value |
Data available |
Value |
Risk difference* (95% CI) |
||||||||||
|
|
|||||||||||||||
|
Total number of patients |
328 |
|
4879 |
|
|
||||||||||
|
Drug |
|
|
|
|
|
||||||||||
|
Steroids |
295 |
290 (98.3%) |
4087 |
3425 (83.8%) |
14.5 (12.3 to 16.2) |
||||||||||
|
Remdesivir |
328 |
28 (8.5%) |
4879 |
367 (7.5%) |
1.01 (–1.8 to 4.4) |
||||||||||
|
Tocilizumab |
328 |
34 (10%) |
4879 |
402 (8.2%) |
2.1 (–1.0 to 5.8) |
||||||||||
|
Baricitinib |
285 |
174 (61.1%) |
3717 |
1646 (44.3%) |
16.8 (10.8 to 22.5) |
||||||||||
|
Neutralising antibodies |
63 |
3 (5%) |
1082 |
143 (13.2%) |
–8 (–13 to –1) |
||||||||||
|
Organ support |
|
|
|
|
|
||||||||||
|
High-flow nasal cannula |
320 |
219 (68.4%) |
4136 |
3053 (73.8%) |
–5.38 (–10.8 to –0.26) |
||||||||||
|
Non-invasive ventilation |
321 |
158 (49.2%) |
4103 |
1624 (39.6%) |
9.64 (3.99 to 15.3) |
||||||||||
|
Invasive ventilation |
324 |
313 (96.6%) |
4202 |
1660 (39.5%) |
57.1 (54.4 to 59.4) |
||||||||||
|
Inotropic or vasopressor medications |
319 |
284 (89.0%) |
4075 |
1609 (39.5%) |
49.5 (45.5 to 53.0) |
||||||||||
|
Neuromuscular blocking agent |
105 |
75 (71%) |
1010 |
293 (29.0%) |
42 (33 to 51) |
||||||||||
|
Prone positioning |
|
206 (64.6%) |
|
1849 (45.3%) |
19.3 (13.7 to 24.6) |
||||||||||
|
Awake prone |
324 |
60 (18%) |
4196 |
1354 (32.3%) |
–14 (–18 to –9.1) |
||||||||||
|
Invasive prone |
321 |
188 (58.6%) |
4132 |
750 (18.2%) |
40.4 (34.8 to 45.8) |
||||||||||
|
Renal replacement therapy |
319 |
61 (19%) |
4069 |
321 (7.9%) |
11 (7.1 to 16) |
||||||||||
|
Tracheostomy |
304 |
95 (31%) |
4544 |
201 (4.4%) |
27 (22 to 32) |
||||||||||
|
Extracorporeal membrane oxygenation |
303 |
77 (25%) |
4564 |
68 (1.5%) |
24 (19 to 29) |
||||||||||
|
Highest level of respiratory support |
302 |
|
4101 |
|
< 0.001† |
||||||||||
|
None |
|
1 (0.3%) |
|
582 (14.2%) |
|
||||||||||
|
Non-invasive ventilation/high flow nasal cannula |
|
9 (3%) |
|
1890 (46.1%) |
|
||||||||||
|
Invasive ventilation |
|
215 (71.2%) |
|
1561 (38.1%) |
|
||||||||||
|
Extracorporeal membrane oxygenation |
|
77 (26%) |
|
68 (1.7%) |
|
||||||||||
|
Complications |
|
|
|
|
|
||||||||||
|
Bacterial pneumonia |
292 |
189 (64.7%) |
3906 |
1132 (29.0%) |
35.7 (30.0 to 41.3) |
||||||||||
|
Bacteraemia |
293 |
80 (27%) |
3913 |
328 (8.4%) |
19 (14 to 24) |
||||||||||
|
Stroke |
294 |
11 (3.7%) |
3924 |
76 (1.9%) |
1.8 (–0.04 to 4.4) |
||||||||||
|
Arrhythmia |
293 |
50 (17%) |
3938 |
456 (11.6%) |
5.5 (1.3 to 10) |
||||||||||
|
Barotrauma‡ |
293 |
56 (19%) |
3927 |
187 (4.8%) |
14 (10 to 19) |
||||||||||
|
Cardiac arrest |
293 |
11 (3.8%) |
3924 |
124 (3.2%) |
0.59 (–1.3 to 3.2) |
||||||||||
|
Pulmonary embolism |
293 |
69 (24%) |
3894 |
327 (8.4%) |
15 (10 to 20) |
||||||||||
|
Deep vein thrombosis |
292 |
38 (13%) |
3880 |
120 (3.1%) |
9.9 (6.3 to 14) |
||||||||||
|
Myocarditis |
292 |
25 (8.6%) |
3880 |
168 (4.3%) |
4.2 (1.3 to 7.8) |
||||||||||
|
|
|||||||||||||||
|
COVID-19 = coronavirus disease 2019; IQR = interquartile range. * Transferred v not transferred: risk difference (difference in proportions, as percentage points) for categorical variables, median difference for continuous variables. The data for drugs and respiratory support are depicted as graphs in the Supporting information, figure 2. † Fisher exact test. ‡ Pneumothorax, pneumomediastinum, or subcutaneous emphysema detected by chest X-ray or computed tomography. |
|||||||||||||||
Box 3 – Clinical outcomes according to transfer status for patients with COVID-19 admitted to intensive care units (ICUs) in Australia, 1 January 2020 – 1 April 2022
|
|
Transferred |
Not transferred |
Difference* (95% CI) |
||||||||||||
|
|
Data available |
Value |
Data available |
Value |
Unadjusted |
Adjusted† |
|||||||||
|
|
|||||||||||||||
|
Total number of patients |
328 |
|
4879 |
|
|
|
|||||||||
|
ICU length of stay (days), median (IQR) |
304 |
20.0 (11.2–40.3) |
4662 |
4.6 (2.1–10.1) |
SHR, 0.53 (0.49–0.58) |
SHR, 0.80 (0.70–0.92) |
|||||||||
|
Discharged alive |
|
18.7 (9.8–40.1) |
|
4.0 (2.0–8.7) |
MD, 14.7 (10.8–18.5) |
MD, 7.32 (2.32–12.3) |
|||||||||
|
Not discharged alive |
|
24.7 (18.3–40.4) |
|
10.3 (4.1–17.9) |
MD, 14.5 (9.34–19.6) |
MD, 10.9 (3.80–18.0) |
|||||||||
|
Hospital length of stay (days), median (IQR) |
306 |
29.7 (18.1–49.6) |
4478 |
12.3 (7.3–21.0) |
SHR, 0.65 (0.59–0.71) |
SHR, 0.83 (0.71–0.97) |
|||||||||
|
Discharged alive |
|
30.8 (16.2–51.6) |
|
12.0 (7.3–20.6) |
MD, 18.8 (15.0–22.5) |
MD, 9.47 (3.78–15.2) |
|||||||||
|
Not discharged alive |
|
27.5 (20.8–42.8) |
|
13.7 (7.1–22.2) |
MD, 13.7 (9.31–18.2) |
MD, 10.9 (3.86–18.0) |
|||||||||
|
Deaths in ICU |
310 |
58 (19%) |
4670 |
694 (14.9%) |
RD, 3.8 (–0.36 to 8.5) |
RD, –4.0 (–8.6 to 0.76) |
|||||||||
|
Deaths in hospital |
309 |
60 (19%) |
4487 |
827 (18.4%) |
RD, 0.98 (–3.32 to 5.77) |
RD, –5.0 (–10 to –0.03) |
|||||||||
|
|
|||||||||||||||
|
COVID-19 = coronavirus disease 2019; IQR = interquartile range; MD = median difference; RD = risk difference; SHR = subdistribution hazard ratio. * Transferred v not transferred: risk difference (difference in proportions, as percentage points) for categorical variables, median difference for continuous variables. Hospital mortality by age and gender is reported in the Supporting information, figure 3. † Adjusted for age, body mass index, APACHE II score, number of co-existing disorders, time from hospital to ICU admission, number of patients admitted per month, time between consecutive admission; hospitals and week of admission as random effects. |
|||||||||||||||
Box 4 – Survival to day 90 from hospital admission for people with COVID-19 admitted to intensive care units in Australia, 1 January 2020 – 1 April 2022: Kaplan–Meier curves
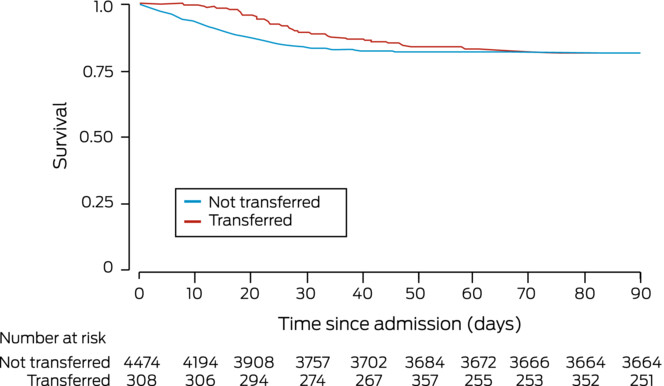
COVID-19 = coronavirus disease 2019.
Box 5 – Disposition during 30 days after admission of people with COVID-19 to intensive care units in Australia, 1 January 2020 – 1 April 2022
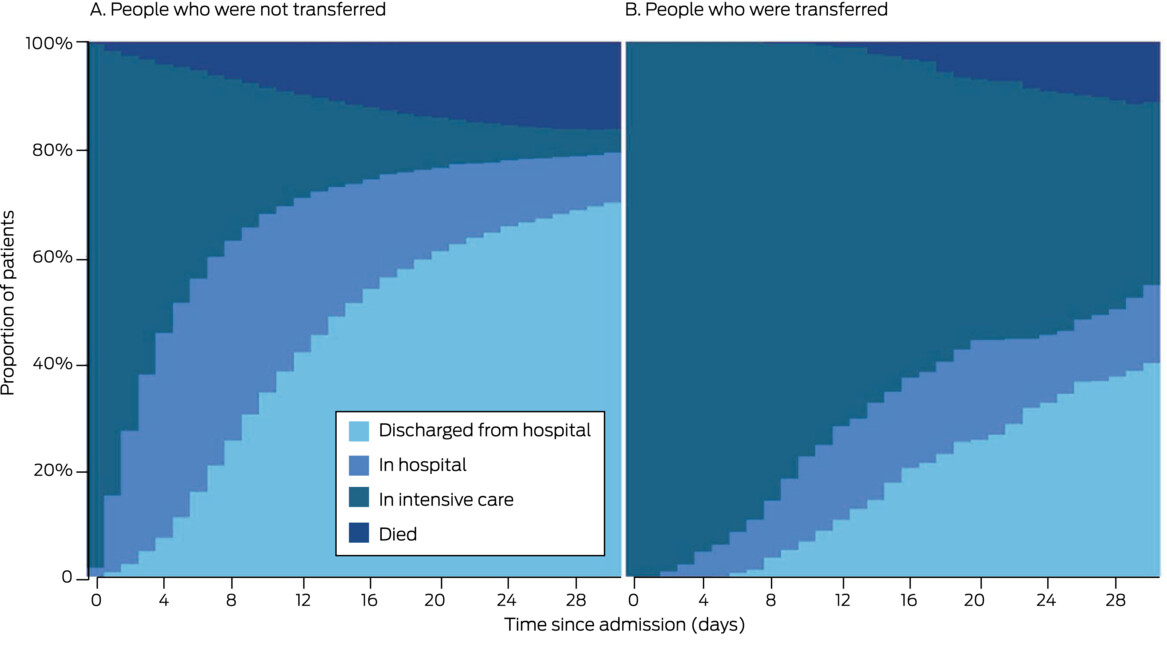
COVID-19 = coronavirus disease 2019.
Box 6 – Hospital mortality among people with COVID-19 admitted to intensive care units (ICUs) in Australia, 1 January 2020 – 1 April 2022: adjusted and unadjusted analyses, with and without imputation of missing data
|
|
Risk difference (95% CI): percentage points |
||||||||||||||
|
Analysis: transferred v not transferred |
Complete case analysis |
Multiple imputation |
|||||||||||||
|
|
|||||||||||||||
|
Major analyses |
|
|
|||||||||||||
|
Unadjusted analysis |
0.98 (–3.3 to 5.8) |
2.2 (–2.2 to 6.6) |
|||||||||||||
|
Adjusted analysis* |
–5.0 (–10 to –0.03) |
–3.8 (–8.1 to 0.43) |
|||||||||||||
|
Sensitivity analyses |
|
|
|||||||||||||
|
Model 1† |
–5.4 (–10 to –0.76) |
–4.0 (–8.3 to 0.22) |
|||||||||||||
|
Model 2‡ |
–6.4 (–11 to –1.8) |
–5.2 (–9.5 to –0.82) |
|||||||||||||
|
Propensity score§ |
–3.4 (–8.9 to 2.1) |
–1.7 (–6.4 to 3.0) |
|||||||||||||
|
Analyses excluding patients from whom support was withdrawn |
|
|
|||||||||||||
|
Unadjusted analysis |
0.08 (–3.4 to 4.2) |
1.3 (–2.4 to 5.0) |
|||||||||||||
|
Adjusted analysis* |
–6.9 (–11 to –2.5) |
–3.9 (–7.7 to –0.18) |
|||||||||||||
|
Model 1† |
–6.4 (–10 to –2.3) |
–4.0 (–7.7 to –0.20) |
|||||||||||||
|
Model 2‡ |
–6.6 (–11 to –2.6) |
–4.5 (–8.4 to –0.65) |
|||||||||||||
|
Propensity score§ |
–5.6 (–10 to –1.0) |
–2.3 (–6.3 to 1.7) |
|||||||||||||
|
|
|||||||||||||||
|
* Adjusted for age, body mass index, APACHE II score, number of co-existing disorders, time from hospital to ICU admission, use of mechanical ventilation, number of patients admitted per month; hospitals and week of admission as rand om effects. Full details of model are included in the Supporting information, table 2. † Adjusted for age, APACHE II score, number of co-existing disorders, time from hospital to ICU admission, use of mechanical ventilation, number of patients admitted per month; hospitals and week of admission as random effects. ‡ Adjusted for age, use of mechanical ventilation, use of inotropic or vasopressor agents, number of co-existing disorders, time from hospital to ICU admission, number of patients admitted per month; hospitals and week of admission as random effects. § Adjusted with a covariate-balancing propensity score based on age, body mass index, APACHE II score, number of co-existing disorders, time from hospital to ICU admission, use of mechanical ventilation, and number of patients admitted per month. |
|||||||||||||||
Received 16 November 2022, accepted 22 February 2023
- Courtney Cini1
- Ary S Neto2,3
- Aidan Burrell1,2
- Andrew Udy1,2
- the SPRINT‐SARI Australia investigators
- 1 Alfred Health, Melbourne, VIC
- 2 Australian and New Zealand Intensive Care Research Centre, Monash University, Melbourne, VIC
- 3 Austin Hospital, Melbourne, VIC
Open access:
Open access publishing facilitated by Monash University, as part of the Wiley – Monash University agreement via the Council of Australian University Librarians.
This investigation and SPRINT‐SARI Australia are supported by the Australian Department of Health (standing deed SON60002733). The full list of the SPRINT–SARI Australia investigators is included in the Supporting information.
No relevant disclosures.
- 1. COVID‐19 Epidemiology and Surveillance Team. COVID‐19 Australia: epidemiology report 68. Reporting period ending 20 November 2022. Commun Dis Intell (2018) 2022; 46.
- 2. Australian Bureau of Statistics. Measuring Australia's excess mortality during the COVID‐19 pandemic. 30 Mar 2022. https://www.abs.gov.au/articles/measuring‐australias‐excess‐mortality‐during‐covid‐19‐pandemic (viewed Apr 2022).
- 3. Chen E, Longcoy J, McGowan SK, et al. Interhospital transfer outcomes for critically ill patients with coronavirus disease 2019 requiring mechanical ventilation. Critical Care Explorations 2021; 3: e0559.
- 4. Sanchez MA, Vuagnat A, Grimaud O, et al. Impact of ICU transfers on the mortality rate of patients with COVID‐19: insights from comprehensive national database in France. Ann Intensive Care 2021; 11: 151.
- 5. Painvin B, Messet H, Rodriguez M, et al. Inter‐hospital transport of critically ill patients to manage the intensive care unit surge during the COVID‐19 pandemic in France. Ann Intensive Care 2021; 11: 54.
- 6. Huq F, Manners E, O'Callaghan D, et al. Patient outcomes following transfer between intensive care units during the COVID‐19 pandemic. Anaesthesia 2022; 77: 398‐404.
- 7. Australian and New Zealand Intensive Care Research Centre (ANZIC‐RC). SPRINT‐SARI. https://www.anzics.com.au/current‐active‐endorsed‐research/sprint‐sari (viewed Mar 2022).
- 8. Burrell AJ, Pellegrini, B, Sailimi F, et al. Outcomes for patients with COVID‐19 admitted to Australian intensive care units during the first four months of the pandemic. Med J Aust 2021; 214: 23‐30. https://www.mja.com.au/journal/2021/214/1/outcomes‐patients‐covid‐19‐admitted‐australian‐intensive‐care‐units‐during‐first
- 9. Begum H, Neto AS, Alliegro P, et al. People in intensive care with COVID‐19: demographic and clinical features during the first, second, and third pandemic waves in Australia. Med J Aust 2022; 217: 352‐360. https://www.mja.com.au/journal/2022/217/7/people‐intensive‐care‐covid‐19‐demographic‐and‐clinical‐features‐during‐first
- 10. Von Elm E, Altman DG, Egger M, et al; STROBE Initiative. The strengthening the reporting of observational studies in epidemiology (STROBE) statement: guidelines for reporting observational studies. Lancet 2007; 370: 1453‐1457.
- 11. Centers for Disease Control and Prevention. People with certain medical conditions. Updated Dec 2022. https://www.cdc.gov/coronavirus/2019‐ncov/need‐extra‐precautions/people‐with‐medical‐conditions.html (viewed Oct 2022).
- 12. Allen R, Wanersdorfer K, Zebley J, et al. Interhospital transfer of critically ill patients because of coronavirus disease 19‐related respiratory failure. Air Med J 2020; 39: 498‐501.
- 13. Salman S, Saleem SG, Khatri A, et al. Inter‐hospital communication and transfer practices during COVID‐19 pandemic in Karachi, Pakistan. A brief overview. Pak J Med Sci 2020; 36 (COVID19 Suppl 4): S118‐S120.
- 14. Faine BA, Noack JM, Wong T, et al. Interhospital transfer delays appropriate treatment for patients with severe sepsis and septic shock: a retrospective cohort study. Crit Care Med 2015; 43: 2589‐2596.
- 15. Arthur KR, Kelz RR, Mills AM, et al. Interhospital transfer: an independent risk factor for mortality in the surgical intensive care unit. Am Surg 2013; 79: 909‐913.
- 16. Duke GJ, Green JV. Outcome of critically ill patients undergoing interhospital transfer. Med J Aust 2001; 174: 122‐125. https://www.mja.com.au/journal/2001/174/3/outcome‐critically‐ill‐patients‐undergoing‐interhospital‐transfer
- 17. Sokol‐Hessner L, White AA, Davis KF, et al. Interhospital transfer patients discharged by academic hospitalists and general internists: characteristics and outcomes. J Hosp Med 2016; 11: 245‐250.
- 18. Mueller S, Zheng J, Orav EJ, Schnipper JL. Inter‐hospital transfer and patient outcomes: a retrospective cohort study. BMJ Qual Saf 2019; 28: e1.
- 19. Bernard AM, Hayward RA, Rosevear J, et al. Comparing the hospitalizations of transfer and non‐transfer patients in an academic medical center. Acad Med 1996; 71: 262‐266.
- 20. Gordon HS, Rosenthal GE. Impact of interhospital transfers on outcomes in an academic medical center: implications for profiling hospital quality. Med Care 1996; 34: 295‐309.
- 21. Song JW, Chung KC. Observational studies: cohort and case–control studies. Plast Reconstr Surg 2010; 126: 2234‐2242.
Abstract
Objectives: To examine the association between inter‐hospital transfer and in‐hospital mortality among people with coronavirus disease 2019 (COVID‐19) admitted to intensive care units (ICUs) in Australia.
Design: Retrospective cohort study; analysis of data collected for the Short Period Incidence Study of Severe Acute Respiratory Illness (SPRINT‐SARI) Australia study.
Setting, participants: People with COVID‐19 admitted to 63 ICUs, 1 January 2020 – 1 April 2022.
Main outcome measures: Primary outcome: in‐hospital mortality; secondary outcomes: ICU and hospital lengths of stay and frequency of selected complications.
Results: Of 5207 people with records in the SPRINT‐SARI Australia database at 1 April 2022, 328 (6.3%) had been transferred between hospitals, 305 (93%) during the third pandemic wave. Compared with patients not transferred, their median age was lower (53 years; interquartile range [IQR], 45–61 yearsv 60 years; IQR, 46–70 years), their median body mass index higher (32.5 [IQR, 27.2–39.0] kg/m2 v 30.1 [IQR, 25.7–35.7] kg/m2), and fewer had received a COVID‐19 vaccine (22% v 44.9%); their median APACHE II scores were similar (14.0; IQR, 12.0–18.0 v 14.0; IQR, 10.0–19.0). Bacterial pneumonia (64.7% v 29.0%) and bacteraemia (27% v 8%) were more frequent in transferred patients, as was the need for more intensive ICU interventions, including invasive mechanical ventilation (71.2% v 38.1%) and extra‐corporeal membrane oxygenation (26% v 1.7%). Crude ICU (19% v 14.9%) and in‐hospital mortality (19% v 18.4%) were similar for patients who were or were not transferred; median lengths of ICU (20.0 [IQR, 11.2–40.3] days v 4.6 [IQR, 2.1–10.1] days) and hospital stay (29.7 [IQR, 18.1–49.6] days v 12.3 [IQR, 7.3–21.0] days) were longer for transferred patients. In the multivariable regression analysis, in‐hospital mortality risk was lower for transferred patients (risk difference [RD], –5.0 percentage points; 95% confidence interval [CI] –10 to –0.03 percentage points), but not in the propensity score‐adjusted analysis (RD, –3.4 [95% CI, –8.9 to 2.1] percentage points).
Conclusions: Among people with COVID‐19 admitted to ICUs, patients transferred from another hospital required more intense interventions and remained in hospital longer, but were not at greater risk of dying in hospital than the patients who were not transferred.