


The known: Life expectancy at birth has increased for Indigenous and non‐Indigenous Australians since the 1960s, but the life expectancy gap between the two groups remains substantial in the Northern Territory.
The new: In the Northern Territory, life expectancy increased more rapidly for Indigenous than non‐Indigenous people during 1999–2018, but the gap in life expectancy between the two groups remains considerable (15.4 years for both men and women).
The implications: Our findings increase our knowledge of what needs to be done to further increase life expectancy in the Northern Territory for both Indigenous and non‐Indigenous people.
Life expectancy at birth, an important summary measure of population health, varies considerably in Australia by state and territory and by population group.1 According to the latest Australian Bureau of Statistics life tables (2018–2020), life expectancy at birth is lowest in the Northern Territory: 76.2 years for men (Australia: 81.2 years), 81.0 years for women (Australia: 85.3 years). On the other hand, life expectancy gains between 2008–2010 and 2018–2020 were greatest in the NT: 2.2 years for men (Australia: 1.7 years), 1.8 years for women (Australia: 1.3 years).1
The population proportion of Aboriginal and Torres Strait Islander (Indigenous) people is largest in the NT (2016: 30.3%; Australia: 3.3%).2 An important population health question is whether life expectancy at birth has improved for both Indigenous and non‐Indigenous Territorians. The 2020 Australian Closing the Gap report noted that the NT was among the jurisdictions in which Indigenous life expectancy in 2018 “showed little or no improvement since the 2006 baseline”.3 The difference in life expectancy between Indigenous and non‐Indigenous people is greater in the NT than elsewhere in Australia,4 and is also greater than the differences between indigenous and non‐indigenous populations in other countries.5
Life expectancy has improved in the NT since the 1960s for both Indigenous and non‐Indigenous people,6,7 but the difference remains substantial. In 2008–2012, life expectancy for NT Indigenous men was 63.6 years (all Australians: 80.0 years), and 68.4 years for Indigenous women (all Australians: 84.5 years).6 Tracking changes in life expectancy is consequently important, as is understanding what has led to increased life expectancy, as this information can be used for health services planning to further improve population health.7
To quantify progress in the NT towards the Closing the Gap target of eliminating the difference in life expectancy between Indigenous and non‐Indigenous Australians by 2031,3 we have prepared updated life expectancy estimates for the NT for the period 1999–2018. We also quantified the contributions of changes in years of life lost to specific disease groups to overall changes in life expectancy, in order to identify areas in which progress has been achieved.
Methods
We analysed data provided by the Australian Coordinating Registry, which collates data from all jurisdictional Registrars of Births, Deaths and Marriages, for the period 1 January 1999 – 31 December 2018. We obtained information on underlying and nine multiple causes of death, coded according to the International Statistical Classification of Diseases and Related Health Problems, tenth revision (ICD‐10), as well as data for key demographic variables (age, sex, Indigenous status, area of residence). Overall annual estimated resident population data were obtained from the Australian Bureau of Statistics.8 The annual Indigenous population number was estimated by interpolating from the estimated resident population data for census years.2
We undertook a retrospective trend analysis of life expectancy (based on year of death, not of registration) using abridged period life tables,1 followed by decomposition by age, sex, and cause of death for changes in life expectancy at birth.9 Period life expectancy summarises the mortality pattern for the study period and estimates mean life span by assuming that people experience prevailing mortality risks throughout their lives. Years of life lost were calculated from standard life expectancy at the age of death.10 Causes of death (underlying cause of death) were classified according to standard Australian burden of disease and injury categories.10 If an underlying cause of death was not included in any standard category, the multiple causes were sequentially assessed for this purpose; deaths that could not be classified using any listed cause were classified as “other”.
Ethics approval
The NT Department of Health and Menzies School of Health Research Human Research Ethics Committee approved the study (2020‐3860).
Results
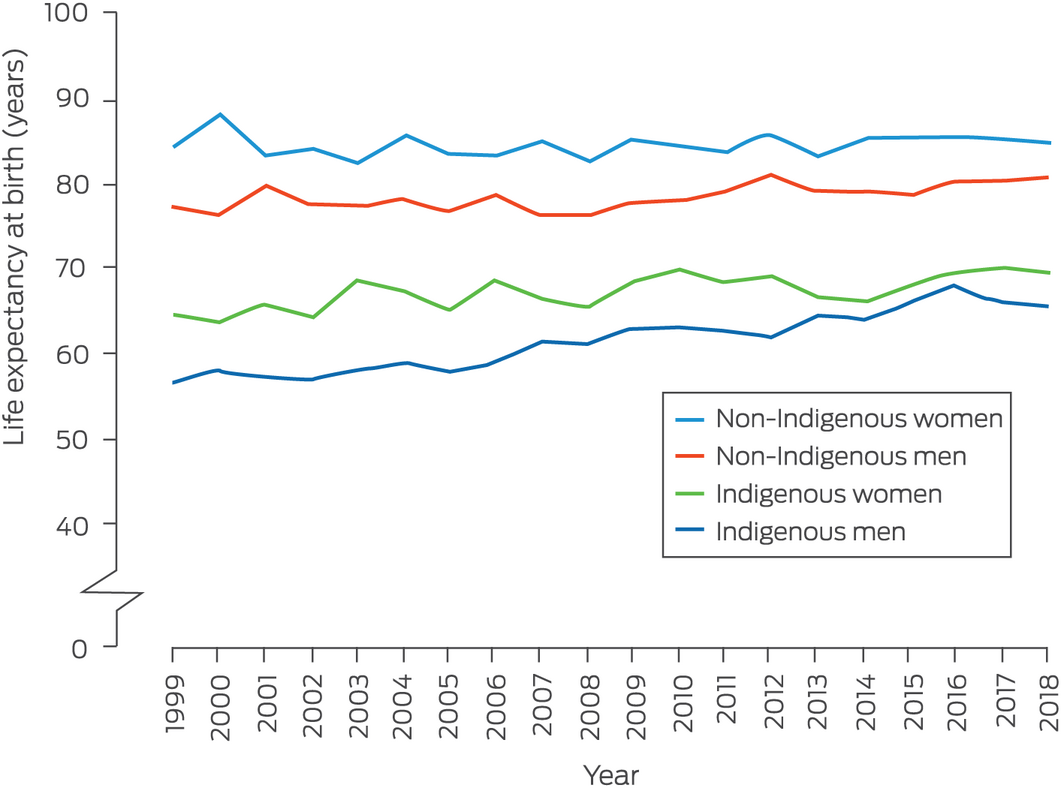
Life expectancy at birth for Indigenous men in the NT increased from 56.6 years in 1999 to 65.6 years in 2018 (change, 9.0 years; 95% confidence interval [CI], 7.9–10.0 years), and for Indigenous women from 64.8 to 69.7 years (change, 4.9 years; 95% CI, 3.2–6.7 years); for non‐Indigenous people, it increased from 77.4 to 81.0 years for men (change, 3.6 years; 95% CI, 2.8–4.4 years), and for women from 84.3 to 85.1 years (change, 0.8 years; 95% CI, –0.4 to 1.9 years) (Box 1, Box 2). Consequently, the difference in life expectancy between Indigenous and non‐Indigenous Territorians declined from 20.8 to 15.4 years for men (change, 5.4 years [26% reduction]; 95% CI, 4.1–6.7 years) and for women from 19.5 to 15.4 years (change, 4.1 years [21% reduction]; 95% CI, 2.1–6.2 years) (Box 2).
Increased life expectancy for Indigenous men was primarily linked with fewer life years lost to cancer (23% of overall change), unintentional injuries (18%), and cardiovascular disease (17%); for Indigenous women, the largest declines were in life years lost to cancer (24%), intentional injuries (17%), and kidney disease (14%) (Box 3). Analysis of deaths by ICD‐10 code indicated declines for all tumour types, except for increases in the numbers of life years lost to lung or liver cancer; that the decline in injury‐related life years lost reflected declines related to road traffic injuries or homicides; and that the reduction in life years lost to cardiovascular disease reflected declines in coronary heart disease, stroke, and rheumatic heart disease mortality (data not shown).
Increased life expectancy for non‐Indigenous people was primarily linked with fewer years of life lost to cancer (men, 37% of overall change; women, 43%) and neurological conditions (men, 18%; women, 37%), but more years of life were lost to cardiovascular disease (men, 7%; women, 39% relative loss) (Box 4). Analysis of deaths by ICD‐10 code identified improved survival with lung, bowel, and breast cancer, but more life years lost to liver cancer, and improved survival with dementia and epilepsy (data not shown). The numbers of years of life lost to coronary heart disease and stroke had declined, but those lost to atrial fibrillation, hypertensive heart disease, inflammatory heart disease, and, more recently, rheumatic heart disease had increased (data not shown).
Discussion
In contrast to the Closing the Gap analysis for the period 2006–2018,3 we found that life expectancy at birth increased markedly between 1999 and 2018 for Indigenous people in the NT, and to a smaller degree for non‐Indigenous people. The life expectancy gap between Indigenous and non‐Indigenous Territorians narrowed by 26% for men and 21% for women, but remained substantial. Fewer life years lost to preventable chronic diseases (including ischaemic heart disease, stroke, rheumatic heart disease, and chronic kidney disease), some cancers, and injuries contributed to improved life expectancy for Indigenous people in the NT.
Eliminating the health inequities experienced by Indigenous people requires a life course perspective. In 1999, the Chronic Conditions Prevention and Management Strategy (CCPMS) was initiated in the NT as an integrated life course approach to averting and managing preventable chronic conditions.11 Our analysis does not indicate whether the CCPMS was responsible for the improved outcomes for people with chronic conditions, but they were temporally associated with concerted activities affecting health policy, self‐management, systems of care, quality improvement and workforce reforms.
The CCPMS coordinated the activities of several health care partners, including the NT Primary Health Network and government and non‐government organisations, focusing on people at high risk receiving care in remote area primary care and Aboriginal Community Controlled Health Organisations.12,13 The CCPMS aimed to improve population health in remote areas through primary prevention, early detection, and strengthening the secondary and tertiary prevention of chronic conditions.11,14 Chronic conditions that have reduced life expectancy for Indigenous people over the past 20 years include diabetes, ischaemic heart disease, renal disease, chronic airways disease, rheumatic heart disease, mental illness, and some cancers.12,15 The NT Department of Health found that improved survival for people with these conditions accounted for more than half of the life expectancy gain for Indigenous people in the NT during 2010–2017.16
We found that reductions in life years lost to unintentional and intentional injuries accounted for 31% (men) and 29% (women) of the increase in life expectancy for Indigenous people in the NT between 1999 and 2018, and for 12% (men) and 11% (women) of the increase for non‐Indigenous people. Suicide, transport‐related injuries, and assault accounted for more than 80% of injury‐related deaths in the NT during 2003–2007.17 Indigenous status, remoteness, alcohol consumption, and seasonality influence the risk of injury in the NT;17 the proportion of people who drink alcohol at unsafe levels is higher than elsewhere in Australia.18 The NT Banned Drinker Register was introduced in July 2011 (disbanded in 2012, but reinstated in 2017) to reduce alcohol‐related harms, including injuries.19 Lower smoking rates may also have reduced the loss of life years to respiratory disease, which in our analysis contributed to increased life expectancy in both Indigenous (men, 7%; women, 13%) and non‐Indigenous Territorians (men, 7%; women, 12%). The smoking rate among Indigenous Australians aged 15 years or more declined from 41% in 2012–13 to 37% in 2018–19.20
Survival rates with almost all cancer types were lower for Indigenous than non‐Indigenous people in the NT during 1991–2012, but had improved across the study period for both populations.21 Dementia, including Alzheimer disease, was the fifth most frequent specific cause of death for Indigenous women and the 12th most frequent for Indigenous men in 2018.22 The standardised rate of death by suicide by Indigenous Australians increased from 20.2 deaths per 100 000 persons in 2009–2013 to 23.7 deaths per 100 000 persons in 2014–2018, almost twice that for non‐Indigenous Australians (2014–2018: 12.3 deaths per 100 000 persons).22
We found that the increase in life expectancy at birth for non‐Indigenous Territorians was largely attributable to fewer life years lost to cancer (men, 37% of gain; women, 43%) and neurological disorders, including dementia (men, 18%; women, 37%). Cardiovascular disease mortality did not decline during 1999–2018, reducing life expectancy improvements for men (–7%) and women (–39%), indicating that better cardiovascular care is required in the NT, including cardiac surgery.23 Sex‐based differences in the recognition and treatment of cardiovascular disease are recognised, and the relative burden of cardiovascular disease and treatment outcomes for NT women require further investigation.
We found that the life expectancy gap between Indigenous and non‐Indigenous Territorians narrowed by 26% for men and 21% for women during 1999–2018. However, this progress is inadequate for achieving the objective of closing the gap in Australia by 2031;24 at the current rate, a further 60 years will be required to eliminate the gap in the NT. The revised Closing the Gap agreement provides a range of government commitments regarding the social and economic determinants of health.24 Despite progress in reducing the years of life lost to chronic conditions and some injury types, the rising suicide rate calls for more attention to mental health care and suicide prevention.
Limitations
Life expectancy at birth is influenced by many factors, including access to health care, health risk behaviours, and socio‐economic status, but we focused on disease groups and ICD‐10‐coded causes of death as the underlying causes of deaths. We did not consider comorbidity, medical complications, and factors such as birthweight and quality of childhood nutrition.25 Our findings for the non‐Indigenous population may be influenced by variability in this population (annual population turnover of about 26%),26 especially as the total NT population is small (245 678 people in 20162). The likelihood of Indigenous people being reported as non‐Indigenous is very low in the NT, as indicated by inter‐census changes in Indigenous identification,27 making our analysis more reliable than it would be for other Australian states. Although annual life expectancy estimates may be useful for monitoring changes in life expectancy, we aggregated data to obtain more stable estimates and to perform decompositions by age, sex, and cause of death. Finally, causal relationships cannot be drawn from our observational study.
Conclusion
Our findings increase our knowledge of life expectancy changes during 1999–2018 for Indigenous and non‐Indigenous people in the NT. Our analysis is the first to compare the details of changes in life expectancy in both populations, and to identify the disease groups in which progress has been made, such as cancer and other chronic conditions. Mental health care and the social determinants of health, focuses of the Closing the Gap program, remain challenges.
Box 1 – Life expectancy at birth for Indigenous and non‐Indigenous people in the Northern Territory, 1999–2018, by sex
Box 2 – Life expectancy at birth, and differences between Indigenous and non‐Indigenous people, the Northern Territory, 1999–2018, by sex
|
|
Indigenous people |
Non‐Indigenous people |
Difference in life expectancy |
||||||||||||
|
Time period |
Women |
Men |
Women |
Men |
Women |
Men |
|||||||||
|
|
|||||||||||||||
|
Life expectancy at birth (years) |
|
|
|
|
|
||||||||||
|
1999 |
64.8 |
56.6 |
84.3 |
77.4 |
19.5 |
20.8 |
|||||||||
|
2018 |
69.7 |
65.6 |
85.1 |
81.0 |
15.4 |
15.4 |
|||||||||
|
Overall change (years), 1999–2018 |
|
|
|
|
|
||||||||||
|
Absolute change (years) (95% CI) |
4.9 |
9.0 |
0.8 |
3.6 |
–4.2 |
–5.4 |
|||||||||
|
Proportional change |
7.6% |
15.8% |
0.9% |
4.6% |
–21% |
–26% |
|||||||||
|
Life expectancy at birth (years), by 5‐year period |
|
|
|
|
|
||||||||||
|
1999–2003 |
65.4 |
57.4 |
83.8 |
77.6 |
18.4 |
20.2 |
|||||||||
|
2004–2008 |
66.5 |
59.6 |
83.9 |
77.2 |
17.4 |
17.6 |
|||||||||
|
2009–2013 |
68.2 |
63.0 |
84.5 |
78.8 |
16.3 |
15.8 |
|||||||||
|
2014–2018 |
68.8 |
65.9 |
85.5 |
79.9 |
16.7 |
14.0 |
|||||||||
|
Change (years), by 5‐year period |
|
|
|
|
|
||||||||||
|
1999–2003 to 2004–2008 |
1.08 |
2.23 |
0.12 |
–0.47 |
–0.05 |
–0.13 |
|||||||||
|
2004–2008 to 2009–2013 |
1.75 |
3.40 |
0.58 |
1.67 |
–0.12 |
–0.22 |
|||||||||
|
2009–2013 to 2014–2018 |
0.56 |
2.91 |
0.94 |
1.07 |
–0.09 |
–0.31 |
|||||||||
|
|
|||||||||||||||
|
CI = confidence interval. |
|||||||||||||||
Box 3 – Change in life expectancy at birth for Indigenous people in the Northern Territory, 1999–2018, by underlying cause of death
|
|
Absolute change (years) |
Proportion of overall change in life expectancy |
|||||||||||||
|
Cause of death |
1999–2003 to 2004–2008 |
2004–2008 to 2009–2013 |
2009–2013 to 2014–2018 |
1999–2003 to 2014–2018 |
1999–2003 to 2004–2008 |
2004–2008 to 2009–2013 |
2009–2013 to 2014–2018 |
1999–2003 to 2014–2018 |
|||||||
|
|
|||||||||||||||
|
Men: all causes |
2.23 |
3.40 |
2.91 |
8.54 |
— |
— |
— |
— |
|||||||
|
Cancer |
0.59 |
0.65 |
0.75 |
1.98 |
26% |
19% |
26% |
23% |
|||||||
|
Unintentional injury |
0.70 |
0.60 |
0.20 |
1.50 |
31% |
18% |
7% |
18% |
|||||||
|
Cardiovascular |
0.25 |
0.47 |
0.76 |
1.48 |
11% |
14% |
26% |
17% |
|||||||
|
Intentional injury |
0.11 |
0.65 |
0.38 |
1.14 |
5% |
19% |
13% |
13% |
|||||||
|
Renal |
0.13 |
0.37 |
0.29 |
0.78 |
6% |
11% |
10% |
9% |
|||||||
|
Respiratory |
0.40 |
–0.01 |
0.18 |
0.57 |
18% |
0 |
6% |
7% |
|||||||
|
Neurological |
0.09 |
0.32 |
0.03 |
0.44 |
4% |
9% |
1% |
5% |
|||||||
|
Gastrointestinal |
0.05 |
0.12 |
0.12 |
0.29 |
2% |
3% |
4% |
3% |
|||||||
|
Infant |
–0.23 |
0.11 |
0.31 |
0.19 |
–10% |
3% |
11% |
2% |
|||||||
|
Endocrine |
0.21 |
0.14 |
–0.32 |
0.02 |
9% |
4% |
–11% |
0 |
|||||||
|
Infectious |
0.02 |
–0.12 |
0.08 |
–0.01 |
1% |
–3% |
3% |
0 |
|||||||
|
Other |
–0.09 |
0.11 |
0.13 |
0.15 |
–4% |
3% |
5% |
2% |
|||||||
|
Women: all causes |
1.08 |
1.75 |
0.56 |
3.39 |
— |
— |
— |
— |
|||||||
|
Cancer |
–0.14 |
0.96 |
–0.01 |
0.81 |
–13% |
55% |
–1% |
24% |
|||||||
|
Intentional injury |
0.05 |
0.29 |
0.22 |
0.57 |
5% |
17% |
40% |
17% |
|||||||
|
Renal |
–0.14 |
0.51 |
0.09 |
0.46 |
–13% |
29% |
16% |
14% |
|||||||
|
Respiratory |
–0.27 |
0.44 |
0.28 |
0.45 |
–25% |
25% |
50% |
13% |
|||||||
|
Unintentional injury |
0.37 |
0.03 |
0.02 |
0.41 |
34% |
2% |
3% |
12% |
|||||||
|
Neurological |
0.12 |
‐0.04 |
0.28 |
0.36 |
11% |
‐2% |
50% |
11% |
|||||||
|
Gastrointestinal |
0.43 |
0.02 |
–0.20 |
0.25 |
40% |
1% |
–36% |
7% |
|||||||
|
Cardiovascular |
0.21 |
–0.13 |
0.04 |
0.12 |
20% |
–8% |
7% |
4% |
|||||||
|
Infant/maternal |
0.05 |
0.02 |
0.04 |
0.12 |
5% |
1% |
8% |
4% |
|||||||
|
Infectious |
–0.11 |
–0.07 |
0.08 |
–0.10 |
–10% |
–4% |
13% |
–3% |
|||||||
|
Endocrine |
0.26 |
–0.10 |
–0.30 |
–0.14 |
24% |
–6% |
–54% |
–4% |
|||||||
|
Other |
0.23 |
–0.18 |
0.03 |
0.07 |
21% |
–10% |
5% |
2% |
|||||||
|
|
|||||||||||||||
|
Mortality rates by underlying cause of death, sex, and age are provided in the Supporting Information, table 1. |
|||||||||||||||
Box 4 – Change in life expectancy at birth for non‐Indigenous people in the Northern Territory, 1999–2018, by underlying cause of death
|
|
Absolute change (years) |
Proportional of overall change |
|||||||||||||
|
Cause of death |
1999–2003 to |
2004–2008 to |
2009–2013 to |
1999–2003 to |
1999–2003 to |
2004–2008 to |
2009–2013 to |
1999–2003 to |
|||||||
|
|
|||||||||||||||
|
Men: all causes |
–0.47 |
1.67 |
1.07 |
2.27 |
— |
— |
— |
— |
|||||||
|
Cancer |
–0.21 |
0.66 |
0.21 |
0.85 |
45% |
40% |
20% |
37% |
|||||||
|
Neurological |
–0.06 |
0.29 |
0.31 |
0.40 |
12% |
17% |
29% |
18% |
|||||||
|
Unintentional injury |
–0.02 |
0.17 |
0.15 |
0.19 |
4% |
10% |
14% |
9% |
|||||||
|
Respiratory |
–0.04 |
0.04 |
0.12 |
0.16 |
8% |
2% |
11% |
7% |
|||||||
|
Infant |
–0.02 |
0.15 |
0.07 |
0.15 |
5% |
9% |
7% |
7% |
|||||||
|
Gastrointestinal |
–0.01 |
0.12 |
0.09 |
0.12 |
1% |
7% |
9% |
5% |
|||||||
|
Renal |
–0.03 |
0.08 |
0.05 |
0.11 |
5% |
5% |
4% |
5% |
|||||||
|
Infectious |
–0.01 |
0.05 |
0.05 |
0.08 |
3% |
3% |
5% |
3% |
|||||||
|
Intentional injury |
–0.01 |
0.00 |
0.13 |
0.07 |
1% |
0% |
12% |
3% |
|||||||
|
Endocrine |
–0.02 |
0.04 |
–0.02 |
0.05 |
4% |
3% |
–2% |
2% |
|||||||
|
Cardiovascular |
0.01 |
–0.12 |
–0.16 |
–0.15 |
–1% |
–7% |
–15% |
–7% |
|||||||
|
Other |
–0.06 |
0.19 |
0.08 |
0.25 |
13% |
11% |
7% |
11% |
|||||||
|
Women: all causes |
0.12 |
0.58 |
0.94 |
1.64 |
— |
— |
— |
— |
|||||||
|
Cancer |
0.06 |
0.24 |
0.25 |
0.70 |
53% |
41% |
26% |
43% |
|||||||
|
Neurological |
0.03 |
0.23 |
0.49 |
0.61 |
28% |
39% |
52% |
37% |
|||||||
|
Respiratory |
0.01 |
0.08 |
0.16 |
0.20 |
10% |
13% |
16% |
12% |
|||||||
|
Infant/maternal |
0.01 |
0.05 |
0.09 |
0.15 |
10% |
8% |
10% |
9% |
|||||||
|
Intentional injury |
0.00 |
0.05 |
0.08 |
0.10 |
2% |
9% |
9% |
6% |
|||||||
|
Unintentional injury |
0.01 |
0.03 |
0.04 |
0.09 |
5% |
6% |
4% |
5% |
|||||||
|
Gastrointestinal |
0.00 |
0.04 |
0.09 |
0.08 |
2% |
6% |
9% |
5% |
|||||||
|
Infectious |
0.00 |
0.00 |
0.23 |
0.08 |
–1% |
0 |
24% |
5% |
|||||||
|
Renal |
0.00 |
0.03 |
0.06 |
0.08 |
4% |
5% |
6% |
5% |
|||||||
|
Endocrine |
0.01 |
0.01 |
–0.07 |
0.03 |
7% |
2% |
–8% |
2% |
|||||||
|
Cardiovascular |
–0.04 |
–0.19 |
–0.60 |
–0.64 |
–31% |
–33% |
–63% |
–39% |
|||||||
|
Other |
0.01 |
0.03 |
0.13 |
0.16 |
11% |
6% |
14% |
10% |
|||||||
|
|
|||||||||||||||
|
Mortality rates by underlying cause of death, sex, and age are provided in the Supporting Information, table 2. |
|||||||||||||||
Received 22 December 2021, accepted 29 April 2022

Abstract
Objectives: To provide updated estimates of life expectancy at birth for Indigenous and non‐Indigenous people in the Northern Territory, 1999–2018; to quantify the contributions of changes in life years lost to disease‐specific causes of death to overall changes in life expectancy.
Design, setting, participants: Analysis of Australian Coordinating Registry data on underlying and nine multiple causes of death (ICD‐10) for deaths in the NT, by age, sex, and Indigenous status, 1 January 1999 – 31 December 2018.
Main outcome measures: Life expectancy at birth by year and 5‐year period, by Indigenous status and sex; change in life expectancy by year and 5‐year period, by Indigenous status and sex; contributions in changes in life years lost to leading underlying causes of death, by 5‐year period, Indigenous status and sex.
Results: Life expectancy for Indigenous men increased from 56.6 years in 1999 to 65.6 years in 2018 (change, 9.0 years; 95% CI, 7.9–10.0 years) and from 64.8 to 69.7 years for Indigenous women (4.9 years; 95% CI, 3.2–6.7 years); for non‐Indigenous men, it increased from 77.4 to 81.0 years (3.6 years; 95% CI, 2.8–4.4 years), and from 84.3 to 85.1 years for non‐Indigenous women (0.8 years; 95% CI, –0.4 to 1.9 years). Increased life expectancy for Indigenous men was primarily linked with fewer years of life lost to cancer (23% of overall change), unintentional injuries (18%), and cardiovascular disease (17%), and for Indigenous women with fewer life years lost to cancer (24%), intentional injuries (17%), and kidney disease (14%). During 1999–2018, the difference in life expectancy between Indigenous and non‐Indigenous people declined by 26% for men (from 20.8 to 15.4 years) and by 21% for women (from 19.5 to 15.4 years).
Conclusions: Life expectancy improved markedly during 1999–2018 for Indigenous people in the NT, particularly with respect to fewer years of life lost to cancer, injuries, and chronic disease. The smaller gains in life expectancy for non‐Indigenous people were linked with improved survival for those with cancer and neurological conditions.