


The known Life expectancy at birth (LE) is substantially lower for Aboriginal people than for other Australians.
The new During 1967–2012, LE improved for NT Aboriginal people: by 11.3 years for men and by 14.7 years for women. The age-specific contributions to these gains shifted over time from younger to older age groups. The higher mortality of NT Aboriginal people aged 35–74 years now accounts for 73% of the difference in LE between NT Aboriginal people and all Australians.
The implications Further LE gains for Aboriginal people will be achieved by improving chronic disease management throughout life. Socio-economic disadvantage and health needs must be tackled together.
There have been substantial efforts in recent decades to improve the health status of Aboriginal and Torres Strait Islander Australians (referred to as Aboriginal Australians in this article). This commitment was reinforced in 2009 by the Council of Australian Governments (COAG) with its undertaking to regularly report on key measures of progress in overcoming disadvantage among Aboriginal people.1,2 Life expectancy at birth (LE) is a widely used summary measure of the health of populations, and one of the key COAG targets was to eliminate the difference in LE between Aboriginal people and other Australians “within a generation”.3-5
Increases in the LE of Aboriginal Australians have been documented in several articles and reports,3-7 but concurrent increases in that of the general Australian population mean that the LE gap remains largely unchanged.4,6 This has led some to question the validity of the Closing the Gap target, as well as the general approach of the campaign,8,9 while others have commented that setting an unreasonable target has resulted in unwarranted pessimism.6 Major improvements in specific areas, such as infant and maternal health and the management of infectious diseases,5,10,11 are encouraging. Nonetheless, the available data suggest that closing the LE gap will require longer term initiatives for managing chronic disease throughout life, as well as action in other areas that influence health, including employment, education, and reducing general disadvantage.2,5,8,12
There are technical limitations to reporting LE changes for Aboriginal people. The required data (death registrations and population estimates) are often incomplete or inaccurate because of variations in Indigenous identification and population underestimation.5,7,13,14 Further, the data generally cover only a limited time span. Data for the Northern Territory, however, are available from the late 1960s,6,7,13,14 providing an opportunity to explore long term LE trends in this Aboriginal population.
Part of the challenge in maximising LE for Aboriginal Australians is ascertaining the various influences on health over time and understanding their relationships. Our study extends to 2012 that of Wilson, Condon and Barnes,6 with the aims of determining longer term trends in mortality and LE for Aboriginal people in the NT and of the total Australian population, and investigating the contributions to changes in LE by shifting mortality patterns in different age groups.
Methods
General death statistics for Australia for 1967–1984 were obtained from the Australian Bureau of Statistics (ABS) as summary historical statistics by year of death registration,15 and for 1985–2012 from the national deaths dataset (ABS, 1985–2005; Australian Coordinating Registry, 2006–2012) as de-identified unit record data by year of death.
For NT residents, unit record death data for local and interstate deaths from 1967 onwards were obtained from the national deaths dataset. Indigenous status has been included in NT death notifications since 1988. The ABS estimates that Indigenous identification in NT death registrations is close to 100%, based on matching of death registrations with census data for 2006 and 2011.16 Indigenous status for death registrations before 1988 was inferred from other recorded information (Aboriginal name; birth or death in a remote Aboriginal community); this approach had a 98% positive predictive value and 96% negative predictive value when tested with blinding on 1991 records.13
Australian mid-year estimated resident population (ERP) data were sourced from the ABS.15,17 NT ERPs were calculated from ABS NT data, which did not include information on Indigenous status. NT ERPs were recast to 1967 using 2011 census proportions, a reverse projection method, and an assumption of zero net migration.
Annual life tables were used for calculating the LE data shown in Box 1. NT non-Aboriginal populations were included in annual LE analyses, so that they could be compared with the total Australian population. Because of significant net movement in and out of the Territory, the NT non-Indigenous population is less stable than the Indigenous population. For this reason, we compared the NT Indigenous population with the overall Australian population.
Elsewhere, LE was calculated from simplified period abridged life tables incorporating aggregated mortality and population data.18 Direct methods of analysis were employed because of the high quality of NT data, thus overcoming potential variability resulting from the choice of methods and the assumptions underlying indirect methods.14,19 Life tables were extended to include the age groups 75–79, 80–84, and 85 or more years for the entire period; this strategy was adopted to reduce the inflation of LE estimates in later years that would ensue from using a single “75 years or more” category. This reduced the LE estimates for NT Aboriginal people for 1967–1971 by about 1.5 years. Five-year life tables were chosen to minimise fluctuations arising from small populations and numbers of deaths in older age groups. The differences in LE between four time periods (calendar years 1967–1971, 1980–1984, 1994–1998 and 2008–2012) were calculated for NT Aboriginal and all Australian residents by sex, to obtain estimates of LE change (with standard error [SE]) across three similar intervals (13, 14 and 14 years).
The statistical decomposition method of Arriaga was applied to examining the contribution of specific age groups to changes in LE during these intervals.18 For 2008–2012, LE differences between NT Aboriginal and the total Australian populations were also decomposed by age group, and 95% confidence intervals (CIs) calculated.
Statistical analyses were conducted in Excel 2010 (Microsoft).
Ethics approval
The project received ethics approval from the Human Research Ethics Committee of the NT Department of Health and Menzies School of Health Research (reference, HREC 2015-2422).
Results
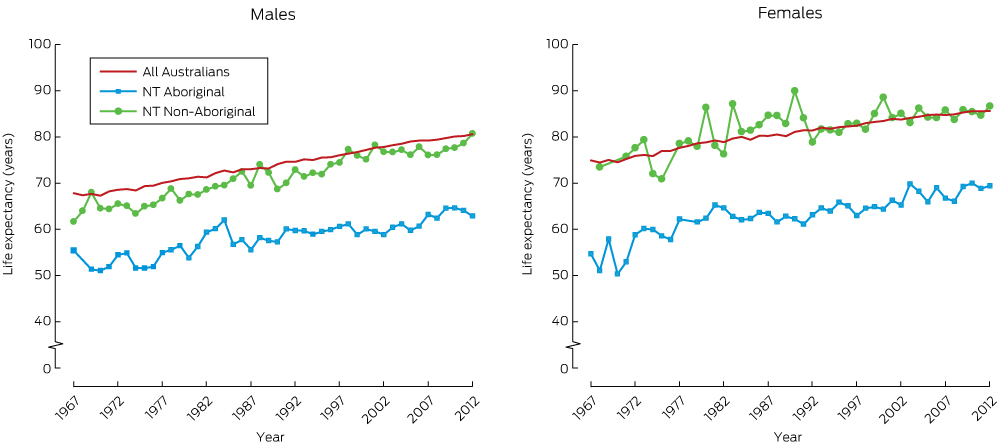
During 1967–2012, LE improved for both Aboriginal and non-Aboriginal NT residents, and also for all Australians (Box 1). Between 1967–71 and 2008–2012, LE increased by 11.3 years for NT Aboriginal males and by 12.3 years for all Australian males; over the same period, LE increased by 14.7 years for NT Aboriginal females, greater than the 10.1 year increase for all Australian females. LE for NT Aboriginal people plateaued from the mid-1980s to the early 2000s before rising again. NT Aboriginal LE remained lower than overall Australian LE in 2008–2012 for both males (63.6 v 80.0 years) and females (68.4 v 84.5 years) (Box 2). Fluctuations in annual LE estimates for the small NT populations indicate the importance of longer time series for determining trends.6
Mortality curves
Box 3 depicts estimated death counts (by sex and age group) of theoretical cohorts of 100 000 Australians and NT Aboriginal people born during 1967–1971 or 2008–2012, derived from the corresponding life tables. The peaks in the Australian mortality curves for 2008–2012 were later than for 1967–1971, indicating increased survival into older age.
The high mortality of NT Aboriginal people during infancy and early childhood during 1967–1971 (more than 10% of all Aboriginal deaths) had diminished substantially by 2008–2012. In contrast, improved survival beyond early childhood was minimal, with women faring slightly better than men. However, these modest changes added 4.7 years of LE beyond early childhood for Aboriginal males (or 43% of the corresponding gain for all Australian males) and 7.3 years (83%) for Aboriginal women. Further, the rise in the mortality curve for NT Aboriginal people was apparent from the late ’teens, whereas mortality for the Australian population only began increasing beyond 40 years of age. The 2008–2012 NT Aboriginal mortality curves were both less favourable than the corresponding 1967–1971 Australian curves.
Age-specific contributions to changes in life expectancy at birth
The LE of NT Aboriginal men increased by 5.8 years between 1967–1971 and 1980–1984, the major contribution being for the 0–4 year age groups (5.2 years, or 89% of LE gains for this period). The LE of NT Aboriginal women increased by 9.5 years during the same period, mainly as the result of mortality changes in infancy and early childhood, but also during middle adulthood (35–54 years). LE plateaued during the middle time interval for both men and women, before improving again in the third interval: in men, mainly through gains among those aged 15–74 years; in women, among those over 35, including those aged 75 or more (Box 2).
Over the entire period, the contribution by the 0–4 years age groups to the increase in LE among NT Aboriginal people was 6.6 years for males (59% of total LE gains) and 7.5 years for females (51%). However, age categories covering middle to late life (35–74 years) were also associated with increases in LE: 3.4 years (30% of total LE gains) for males, and 5.2 years (35%) for females (Box 2; online Appendix, figures 1 and 2).
The age group-specific contributions to differences in LE estimates for all Australians and NT Aboriginal people during 2008–2012 are presented in Box 4 and in the online Appendix, figure 3. The higher mortality among NT Aboriginal people aged 35–74 years accounted for 71–76% of the LE gap for Aboriginal people.
Discussion
LE for NT Aboriginal people improved substantially between 1967–1971 and 2008–2012: by 11.3 years for males and 14.7 years for females. During the same period, LE also increased for the total Australian population; the net effect was that the gap in LE for NT Aboriginal people had increased by one year for males and decreased by 4.6 years for females. Our results are consistent with the 1966–2011 estimates by Wilson.7
Our analysis of changes in LE during three time intervals identified periods of differing rates of change. During the first interval (1967–1971 to 1980–1984), rapid improvement was linked with lower mortality in younger age groups for both sexes and in middle age groups (35–74 years) for women. During the second interval (1980–1984 to 1994–1998), LE increased only slightly. Our findings for the first interval are consistent with improved management of maternal and child health and of infectious diseases; the greater part of the impact of these interventions on mortality had been achieved before the second interval, a period when chronic diseases were becoming more prevalent among Aboriginal people.6,11 LE gains during the third interval (1994–1998 to 2008–2012) were moderate, and largely reflected lower mortality among adult Aboriginal men and women, changes consistent with better access to health care and improved management of chronic diseases.10,20
Mortality among NT Aboriginal women declined during adulthood to a greater extent than among men, particularly in higher age groups. Earlier research had found progressive chronic disease-related improvements in LE for NT Aboriginal women during 1981–2000, but only limited change for Aboriginal men.11 Differential access to primary care services, including difficulties encountered by health care providers in engaging with men, may have contributed to these differences.20 This interpretation is supported by a recent study of 84 NT primary care services which reported that the proportions of total episodes of care were lower for adult men than for women (10% of all episodes of care were for men aged 25–44 years, 11% for men aged 45–64 years; 18% were for women aged 25–44 years, and 16% for those aged 45–64 years).21 The persisting difference in LE between Aboriginal and non-Aboriginal men also reflects substantially increased LE for Australian men overall, largely attributed to reductions in the prevalence of smoking (from an estimated 72% in the 1940s to 17% in 2013).22 The prevalence of smoking among Aboriginal people remains high.22
During 1967–2012, the predominant causes of death of Aboriginal people shifted from maternal, perinatal and infectious diseases to chronic diseases.11,13 A transition in nutrition from childhood malnourishment and stunting to overeating (often of food high in calories but of poor nutritional quality) is likely to have contributed to the increased prevalence of chronic diseases.23 A concurrent factor is socio-economic disadvantage,5 the major factor underlying the persisting LE gap in the NT, contributing as much as half of the difference between Aboriginal and non-Aboriginal populations.24
The implications of our findings
Evidence linking specific approaches and programs for Aboriginal health with improvements in LE is scarce, but inferences can be drawn from a range of studies.20 Our results indicate that only a small increase in LE (0.6–0.8 years; Box 4) can be attained by achieving parity in infant mortality rates with non-Aboriginal Australians; greater improvements will require reducing the impact of chronic diseases during adult life.
Several reports support continued emphasis on chronic disease management and primary care services.5,12,20,25 For example, reduced avoidable mortality (since the 1990s) and recent LE improvements in older age groups have followed major investment in primary care,20 the establishment of Aboriginal community-controlled health services, and the implementation of chronic disease management strategies.6
Evidence for relative underfunding and underutilisation of health services in the NT has been reported.20,26 This situation cannot be rectified by increasing funding alone, given problems of remote workforce supply and continuity of care.26 A recent cost-effectiveness study found that primary care services for key chronic diseases can lower costs while reducing mortality, the number of years of life lost, and the numbers of total and avoidable hospitalisations.25 The dual benefits of reducing costs and improving health outcomes through upgraded primary care are significant: the costs associated with Aboriginal health inequality in the NT were recently estimated to be $16.7 billion, or 19% of the NT gross state product.27 Attention paid to social disadvantage and related determinants of health must also be increased; while difficult to quantify, these factors are critical to sustained improvements in health.2,5
Limitations of our study
There are several limitations to our study. Despite the validation of early individual NT death records, Indigenous status may have been inaccurately assigned in up to 2% of records.13 In the early years covered by our study, deaths in remote communities, particularly of neonates, are likely to have been under-reported; if they had been included, these deaths would have reduced our estimates of initial Aboriginal LE. Estimates of the NT Aboriginal population are also uncertain; they have varied significantly between censuses, partly because of changes in willingness to identify as an Aboriginal Australian.14 We partially corrected for this feature by extrapolating estimates from the 2011 census, considered to be the most robust to date.7 A further limitation pertains to the generalisability of these results to the broader Aboriginal Australian population. Although specific factors affect Aboriginal health to a greater degree in the NT than elsewhere, including the high proportion of the population living in very remote communities, a shared burden of poor health and the overarching risks associated with social disadvantage make our findings more widely relevant.
Conclusion
Aboriginal Australians in the NT, like indigenous people in other countries, have transitioned from traditional lifestyles to those of the populations that have colonised them; that is, urban or Western lifestyles.23 LE has increased substantially in association with improved maternal and infant care, infectious disease control, and better nutrition. Some of these gains have been offset by increased lifestyle risks and the consequently increased prevalence of chronic diseases that contribute to maintaining the difference in LE between Aboriginal and non-Aboriginal Australians. Our study provides evidence that targeted health care can improve LE, but is likely to have only a limited impact on the LE gap unless socio-economic disadvantage and its associated risks are also reduced.
Box 1 – Life expectancy at birth for all Australians and for Northern Territory Aboriginal and non-Aboriginal residents, 1967–2012, by sex
Box 2 – Age group-specific contributions to changes in life expectancy at birth for all Australians and for Northern Territory Aboriginal residents
|
|
Northern Territory Aboriginal population |
Australian population |
|||||||||||||
|
1967–1971 to 1980–1984 |
1980–1984 to 1994–1998 |
1994–1998 to 2008–2012 |
1967–1971 to 2008–2012 |
1967–1971 to 1980–1984 |
1980–1984 to 1994–1998 |
1994–1998 to 2008–2012 |
1967–1971 to 2008–2012 |
||||||||
|
|
|||||||||||||||
|
Males |
|||||||||||||||
|
Life expectancy at birth, years (SE) |
|||||||||||||||
|
Start of period |
52.3 (0.3) |
58.1 (0.2) |
59.8 (0.4) |
52.3 (0.3) |
67.7 (0.0) |
71.7 (0.0) |
75.7 (0.0) |
67.7 (0.0) |
|||||||
|
End of period |
58.1 (0.2) |
59.8 (0.4) |
63.6 (0.4) |
63.6 (0.4) |
71.7 (0.0) |
75.7 (0.0) |
80.0 (0.0) |
80.0 (0.0) |
|||||||
|
Change in life expectancy attributable to age group, years (% of total change)* |
|||||||||||||||
|
0 |
4.24 (73%) |
0.44 (26%) |
0.24 (6%) |
5.29 (47%) |
0.70 (17%) |
0.38 (10%) |
0.13 (3%) |
1.31 (11%) |
|||||||
|
1–4 |
0.97 (17%) |
0.23 (13%) |
0.06 (2%) |
1.33 (12%) |
0.10 (2%) |
0.07 (2%) |
0.05 (1%) |
0.23 (2%) |
|||||||
|
5–14 |
–0.06 (–1%) |
0.15 (9%) |
0.14 (4%) |
0.21 (2%) |
0.09 (2%) |
0.09 (2%) |
0.05 (1%) |
0.24 (2%) |
|||||||
|
15–34 |
–0.21 (–4%) |
0.26 (15%) |
0.56 (15%) |
0.52 (5%) |
0.23 (6%) |
0.16 (4%) |
0.52 (12%) |
0.94 (8%) |
|||||||
|
35–54 |
0.46 (8%) |
–0.09 (–5%) |
1.71 (46%) |
1.94 (17%) |
0.82 (20%) |
0.70 (17%) |
0.34 (8%) |
2.10 (17%) |
|||||||
|
55–74 |
0.26 (4%) |
0.31 (18%) |
0.87 (23%) |
1.46 (13%) |
1.62 (40%) |
1.92 (48%) |
1.97 (46%) |
5.73 (46%) |
|||||||
|
≥ 75 |
0.18 (3%) |
0.42 (24%) |
0.15 (4%) |
0.54 (5%) |
0.49 (12%) |
0.69 (17%) |
1.23 (29%) |
1.79 (14%) |
|||||||
|
Total life expectancy change, years (SE) |
|||||||||||||||
|
|
5.8 (0.4) |
1.7 (0.4) |
3.74 (0.6) |
11.3 (0.5) |
4.0 (0.0) |
4.0 (0.0) |
4.3 (0.0) |
12.3 (0.0) |
|||||||
|
Females |
|||||||||||||||
|
Life expectancy at birth, years (SE) |
|||||||||||||||
|
Start of period |
53.7 (0.3) |
63.2 (0.2) |
64.4 (0.2) |
53.7 (0.3) |
74.4 (0.0) |
78.7 (0.0) |
81.6 (0.0) |
74.4 (0.0) |
|||||||
|
End of period |
63.2 (0.2) |
64.4 (0.2) |
68.4 (0.4) |
68.4 (0.4) |
78.7 (0.0) |
81.6 (0.0) |
84.5 (0.0) |
84.5 (0.0) |
|||||||
|
Change in life expectancy attributable to age group, years (% of total change)* |
|||||||||||||||
|
0 |
4.12 (43%) |
0.04 (3%) |
0.73 (18%) |
5.18 (35%) |
0.58 (14%) |
0.31 (11%) |
0.12 (4%) |
1.07 (11%) |
|||||||
|
1–4 |
1.72 (18%) |
0.39 (32%) |
0.06 (1%) |
2.27 (15%) |
0.11 (3%) |
0.05 (2%) |
0.04 (1%) |
0.21 (2%) |
|||||||
|
5–14 |
–0.02 (0%) |
0.17 (14%) |
–0.10 (–3%) |
0.05 (0%) |
0.07 (2%) |
0.04 (1%) |
0.04 (1%) |
0.16 (2%) |
|||||||
|
15–34 |
0.49 (5%) |
0.61 (51%) |
0.31 (8%) |
1.39 (9%) |
0.20 (5%) |
0.08 (3%) |
0.14 (5%) |
0.44 (4%) |
|||||||
|
35–54 |
2.61 (27%) |
–1.14 (–95%) |
0.66 (17%) |
2.50 (17%) |
0.70 (16%) |
0.40 (14%) |
0.22 (7%) |
1.43 (14%) |
|||||||
|
55–74 |
0.64 (5%) |
1.33 (110%) |
0.87 (22%) |
2.70 (18%) |
1.45 (34%) |
1.11 (39%) |
1.15 (39%) |
3.90 (39%) |
|||||||
|
≥ 75 |
–0.01 (0%) |
–0.19 (–16%) |
1.46 (37%) |
0.65 (4%) |
1.18 (27%) |
0.86 (30%) |
1.23 (42%) |
2.88 (29%) |
|||||||
|
Total life expectancy change, years (SE) |
|||||||||||||||
|
|
9.5 (0.4) |
1.2 (0.3) |
4.0 (0.4) |
14.7 (0.5) |
4.3 (0.0) |
2.9 (0.0) |
2.9 (0.0) |
10.1 (0.0) |
|||||||
|
|
|||||||||||||||
|
* Totals may not be the same as the sum of individual age group values because of rounding. |
|||||||||||||||
Box 3 – Deaths by age group in theoretical cohorts of 100 000 Northern Territory Aboriginal Australians and for all Australian people, 1967–1971 and 2008–2012, by sex*
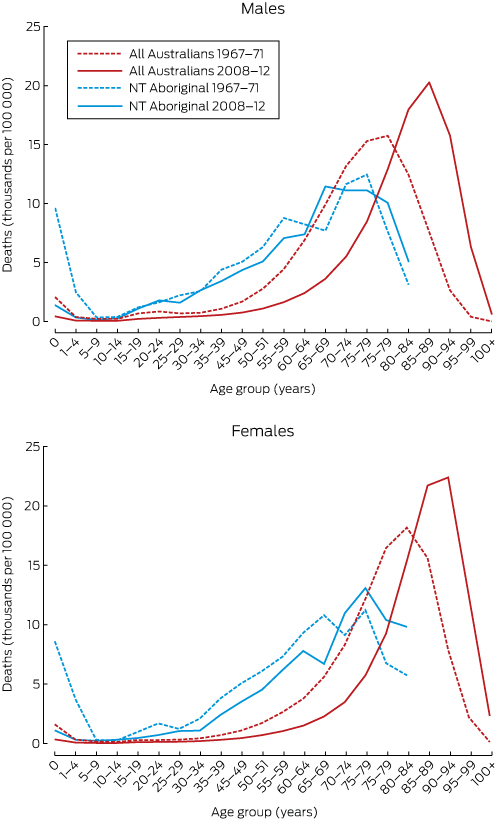
* Aboriginal male and female age-specific mortality rates could not be calculated for age groups beyond 80–84 years; consequently, the number of deaths of Aboriginal people does not sum to 100 000.
Box 4 – Age group-specific differences in estimates of life expectancy at birth for all Australians and Northern Territory Aboriginal people, 2008–2012, by sex
|
|
Males |
Females |
Total |
||||||||||||
|
|
|||||||||||||||
|
Life expectancy at birth, years (95% CI) |
|||||||||||||||
|
Northern Territory Aboriginal Australians |
63.6 (62.7–64.4) |
68.4 (67.7–69.1) |
66.0 (65.4–66.5) |
||||||||||||
|
All Australians |
80.0 (80.0–80.0) |
84.5 (84.5–84.5) |
82.3 (82.2–82.3) |
||||||||||||
|
Difference in life expectancy attributable to age group, years (proportion of total) |
|||||||||||||||
|
0 |
0.76 (5%) |
0.64 (4%) |
0.71 (4%) |
||||||||||||
|
1–4 |
0.20 (1%) |
0.21 (1%) |
0.21 (1%) |
||||||||||||
|
5–14 |
0.21 (1%) |
0.34 (2%) |
0.27 (2%) |
||||||||||||
|
15–34 |
3.16 (19%) |
1.59 (10%) |
2.42 (15%) |
||||||||||||
|
35–54 |
5.89 (36%) |
5.61 (35%) |
5.78 (35%) |
||||||||||||
|
55–74 |
5.79 (35%) |
6.53 (41%) |
6.14 (38%) |
||||||||||||
|
≥ 75 |
0.44 (3%) |
1.14 (7%) |
0.75 (5%) |
||||||||||||
|
Total difference, years (95% CI) |
16.5 (15.6–17.3) |
16.1 (15.4–16.8) |
16.3 (15.7–16.8) |
||||||||||||
|
|
|||||||||||||||
|
|
|||||||||||||||
Received 28 September 2016, accepted 21 March 2017
- Nick Georges1
- Steven L Guthridge1
- Shu Qin Li1
- John R Condon1,2
- Tony Barnes3
- Yuejen Zhao1
- 1 Department of Health, Northern Territory Government, Darwin, NT
- 2 Menzies School of Health Research, Charles Darwin University, Darwin, NT
- 3 Northern Institute, Charles Darwin University, Darwin, NT
No relevant disclosures.
- 1. Council of Australian Governments. COAG meeting, Darwin, 2 July 2009: communique. http://www.coag.gov.au/sites/default/files/communique/2009-07-02.pdf (accessed Jan 2017).
- 2. Close the Gap Campaign Steering Committee. Progress and priorities report 2015. Feb 2015. http://www.humanrights.gov.au/sites/default/files/document/publication/CTG_progress_and_priorities_report_2015.pdf (accessed June 2016).
- 3. Australian Health Ministers’ Advisory Council. Aboriginal and Torres Strait Islander Health Performance Framework. 2014 report. Canberra: AHMAC, 2015. http://www.dpmc.gov.au/sites/default/files/publications/Aboriginal_and_Torres_Strait_Islander_HPF_2014%20-%20edited%2016%20June2015.pdf (accessed June 2016).
- 4. Australian Government, Department of the Prime Minister and Cabinet. Closing the gap: Prime Minister’s report 2017. Canberra: Australian Government, 2017. http://closingthegap.pmc.gov.au/sites/default/files/ctg-report-2017.pdf (accessed Mar 2017).
- 5. Australian Institute of Health and Welfare. The health and welfare of Australia’s Aboriginal and Torres Strait Islander peoples 2015 (AIHW Cat. No. IHW 147). Canberra: AIHW, 2015.
- 6. Wilson T, Condon JR, Barnes T. Northern Territory Indigenous life expectancy improvements, 1967–2004. Aust N Z J Public Health 2007; 31: 184-188.
- 7. Wilson T. New population and life expectancy estimates for the Indigenous population of Australia’s Northern Territory, 1966-2011. PLoS One 2014; 9: e97576.
- 8. Hoy WE. “Closing the gap” by 2030: aspiration versus reality in Indigenous health. Med J Aust 2009; 190: 542-544. <MJA full text>
- 9. Pholi K, Black D, Richards C. Is ‘Close the Gap’ a useful approach to improving the health and wellbeing of Indigenous Australians? Aust Rev Public Affairs 2009; 9(2): 1-13.
- 10. Li SQ, Gray N, Guthridge S, Pircher S. Avoidable mortality trends in Aboriginal and non-Aboriginal populations in the Northern Territory, 1985-2004. Aust N Z J Public Health 2009; 33: 544-550.
- 11. Zhao Y, Dempsey K. Causes of inequality in life expectancy between Indigenous and non-Indigenous people in the Northern Territory, 1981-2000: a decomposition analysis. Med J Aust 2006; 184: 490-494. <MJA full text>
- 12. Donato R, Segal L. Does Australia have the appropriate health reform agenda to close the gap in Indigenous health? Aust Health Rev 2013; 37: 232-238.
- 13. Condon JR, Barnes T, Cunningham J, Smith L. Demographic characteristics and trends of the Northern Territory Indigenous population, 1966 to 2001. Darwin: Cooperative Research Centre for Aboriginal Health, 2004. http://www.lowitja.org.au/sites/default/files/docs/Demographic_Characteristics.pdf (accessed Jan 2016).
- 14. Australian Bureau of Statistics. Discussion paper. Assessment of methods for developing life tables for Aboriginal and Torres Strait Islander Australians. Australia 2006 (ABS Cat. No. 3302.0.55.002). Canberra: ABS, 2006. http://www.ausstats.abs.gov.au/ausstats/subscriber.nsf/0/E95571AD7E9E2A91CA257501000C403B/$File/3302055002_2006.pdf (accessed Jan 2016).
- 15. Australian Bureau of Statistics. 3105.0.65.001. Australian historical population statistics, 2014. Sept 2014. http://www.abs.gov.au/ausstats/abs@.nsf/mf/3105.0.65.001 (accessed Oct 2015).
- 16. Australian Bureau of Statistics. 3302.0.55.003. Life tables for Aboriginal and Torres Strait Islander Australians 2010–2012. Nov 2013. http://www.ausstats.abs.gov.au/ausstats/subscriber.nsf/0/BD51C922BFB7C6C1CA257C230011C97F/$File/3302055003_2010-2012.pdf (accessed Oct 2015).
- 17. Australian Bureau of Statistics. 3101.0. Australian demographic statistics. Table 59: Estimated resident population by single year of age, Australia. Mar 2015. http://www.abs.gov.au/AUSSTATS/abs@.nsf/DetailsPage/3101.0Mar%202015?OpenDocument (accessed Oct 2015).
- 18. Preston SH, Heuveline P, Guillot M. Demography: measuring and modeling population processes. Oxford: Blackwell, 2000.
- 19. Phillips B, Morrell S, Taylor R, Daniels J. A review of life expectancy and infant mortality estimations for Australian Aboriginal people. BMC Public Health 2014; 14: 1.
- 20. Griew R. The link between primary health care and health outcomes for Aboriginal and Torres Strait Islander Australians. A report for the Office for Aboriginal and Torres Strait Islander Health, Department of Health and Ageing. Sydney: Robert Griew Consulting, 2008. http://www.health.gov.au/internet/main/publishing.nsf/Content/EF81F462A8E8482BCA257BF0001ED788/$File/2008%20OATSIH%20Primary%20Health%20Care%20lit%20review%20FINAL%20ll.pdf (accessed Jan 2016).
- 21. Health Gains Planning, Northern Territory Department of Health. Northern Territory Aboriginal health: key performance indicators. Public release report, 2014. Darwin: NT Department of Health, 2016. http://hdl.handle.net/10137/1276 (accessed June 2017).
- 22. Scollo MM, Winstanley MH. Tobacco in Australia: facts and issues. Melbourne: Cancer Council Victoria, 2015. http://www.tobaccoinaustralia.org.au/ (accessed Sep 2016).
- 23. Gracey M, King M. Indigenous health. Part 1: determinants and disease patterns. Lancet 2009; 374: 65-75.
- 24. Zhao Y, Wright J, Begg S, Guthridge S. Decomposing Indigenous life expectancy gap by risk factors: a life table analysis. Popul Health Metr 2013; 11: 1.
- 25. Zhao Y, Thomas SL, Guthridge SL, Wakerman J. Better health outcomes at lower costs: the benefit of primary care utilisation for chronic disease management in remote Indigenous communities in Australia’s Northern Territory. BMC Health Serv Res 2014; 14: 463.
- 26. Malyon R, Zhao Y, Guthridge S. Medicare Benefits Schedule and Pharmaceutical Benefits Scheme utilisation in the Northern Territory, 1993–94 to 2008–09. Darwin: Department of Health and Families, 2010. http://digitallibrary.health.nt.gov.au/jspui/bitstream/10137/439/1/MBS%20PBS%20Draft8%20Final.pdf (accessed Sept 2016).
- 27. Zhao Y, Vemuri SR, Arya D. The economic benefits of eliminating Indigenous health inequality in the Northern Territory. Med J Aust 2016; 205: 266-269. <MJA full text>
Abstract
Objectives: To compare long term changes in mortality and life expectancy at birth (LE) of Aboriginal people in the Northern Territory and of the overall Australian population; to determine the contributions of changes in mortality in specific age groups to changes in LE for each population.
Design, setting, participants: Retrospective trend analysis of death and LE data for the NT Aboriginal and Australian populations, 1967–2012.
Main outcome measures: LE estimates based on abridged life tables; mortality estimates (deaths per 100 000 population); and age decomposition of LE changes by sex and time period.
Results: Between 1967 and 2012, LE increased for both NT Aboriginal and all Australians; the difference in LE between the two populations declined by 4.6 years for females, but increased by one year for males. Between 1967–1971 and 1980–1984, LE of NT Aboriginal people increased rapidly, particularly through reduced infant mortality; from 1980–1984 to 1994–1998, there was little change; from 1994–1998 to 2008–2012, there were modest gains in older age groups. Decomposition by age group identified the persistent and substantial contribution of the 35–74-year age groups to the difference in LE between NT Aboriginal people and all Australians.
Conclusions: Early gains in LE for NT Aboriginal people are consistent with improvements in nutrition, maternal and infant care, and infectious disease control. A rapid epidemiological transition followed, when LE gains in younger age groups plateaued and non-communicable diseases became more prevalent. Recent LE gains, across all adult age groups, are consistent with improved health service access and chronic disease management. If LE is to continue improving, socio-economic disadvantage and its associated risks must be reduced.