


The known: Observational studies have found that enrolling people with preferred general practitioners, longer GP appointments, and timely general practice follow‐up after emergency department or hospital care are associated with improved health outcomes and reduced health service use.
The new: A 12‐month intervention including these three elements did not improve self‐reported health, and was not cost‐effective in improving quality of life.
The implications: To provide evidence that would assist decisions about medical service reforms, our intervention should be further investigated in trials in a variety of general practice types and adequately powered for assessing changes in hospital use.
Our ageing population, rising rates of chronic and complex disease, and growing demand for more expensive services poses challenges for Australian health care. Primary health care must be efficient and adequately resourced if population health outcomes are to improve and health funding is to be sustainable.
Overseas observational studies have found that health outcomes can be improved and health service use reduced by enrolling people with a preferred general practitioner in order to promote continuity of care,1 providing longer GP consultations,2 and more timely general practice follow‐up after major health events, such as emergency department presentations and hospitalisations.3 In 2017, the Royal Australian College of General Practitioners, in collaboration with the Australian government, invited proposals from general practice research networks for two trials to assess the effects on health outcomes and health service use in Australia of interventions including these three components.
In this article, we describe one of those trials. The aim of the Flinders Quality Enhanced general practice Services Trial (Flinders QUEST) was to examine whether a multicomponent general practice intervention for people identified by their GPs as being at high risk of poor health outcomes — enrolling patients with a preferred GP, longer GP appointments, and timely general practice follow‐up after major health events — cost‐effectively improved health outcomes and reduced their use of health services.
Methods
Flinders QUEST was a two‐arm pragmatic cluster randomised controlled trial (RCT) in which general practices were randomised to the control (usual care) or intervention (enhanced care) groups; that is, all participating patients at a general practice were assigned to the same study group, thereby reducing the risk of contamination of the intervention effect. Intervention group practices applied the intervention for twelve months (1 November 2018 – 31 October 2019). Flinders QUEST was prospectively registered with the Australian New Zealand Clinical Trials Registry (ACTRN12617001589370; 28 November 2017).
Setting and participants
General practices in metropolitan Adelaide not participating in the Australian Health Care Home Program4 were recruited from the Flinders General Practice Teaching and Research Network. The network, at the time of the study, comprised 53 general practices in urban, outer metropolitan, and rural South Australia who participate as community partners in the teaching and research activities of the Flinders University general practice discipline. GPs in the recruited practices were eligible to participate if they worked there at least three days a week.
General practice managers and administrative staff used the Pen CS Clinical Auditing Tool (CAT4) to produce lists for participating GPs of potentially eligible, active patients (three or more consultations at the practice in the preceding two years) in three groups: children and young people (under 18 years of age), adults (aged 18–64 years) with two or more chronic diseases, and older people (aged 65 years or more). GPs were asked to select 18 patients likely to benefit from the intervention (assuming that twelve would consent to participation); that is, excluding patients they deemed to not be at high risk of poor health outcomes, but also those too seriously ill to benefit from the intervention (Supporting Information, part 1).
Intervention and usual care groups
Patients in intervention group practices were enrolled with a preferred GP (selected jointly by the practice and the patient), provided longer appointments, and followed up within seven days of any emergency department presentation or hospital stay. For children and young people with acute conditions, the intervention also provided same‐day general practice appointments. Patients in control group practices received usual care.
Intervention and control group practices received payments of $10 000 each to cover the administrative costs associated with patient recruitment, data collection, and meetings with the investigators. Intervention practices also received payments of $1000 per enrolled patient. Participating patients received $10 gift cards at each of the three assessments (further details: Supporting Information, part 2).
Procedure
GPs advised potentially eligible patients willing to participate in the study to contact the research team directly, who then posted them an information pack. Patients who did not respond to the information pack within two weeks were followed up by telephone.
A statistician outside the research team randomised practices (1:1) to the control and intervention groups after patient recruitment was complete using a covariate‐constrained technique5 implemented with the Stata package cvcrand.6 Included covariates were the number of participants at each practice (three groups) and the Socio‐Economic Indexes for Areas Index of Relative Socio‐Economic Disadvantage (IRSD) score7 for the practice postcode. Practices, GPs, participating patients, research staff, and the study statistician were not blinded to group allocation.
Primary outcome
The primary outcome was the difference between the control and intervention groups in change in self‐rated health, measured with the visual analogue scale (VAS) of the EQ‐5D questionnaire,8 between baseline and 12‐month follow‐up. At baseline and at six and twelve months, patients were asked to “indicate how your health is TODAY” by placing a cross on a 20 cm vertical VAS with endpoints labelled “best health you can imagine” (score, 100) and “worst health you can imagine” (score, 0), and to “write the number you marked on the scale in the box below”. Six‐month data are not reported in this article.
The originally planned primary outcome was EQ‐5D score. However, scores on the proxy or youth versions of the EQ‐5D questionnaire are not directly comparable with those on the adult version; further, the EQ‐5D VAS was deemed to provide a more sensitive measure of self‐rated health. This change and further, minor protocol changes were made before the practices were randomised (Supporting Information, part 3).
Secondary outcomes
Secondary outcomes were the numbers of emergency department presentations and hospital admissions (hospital use), Medicare specialist claims, and Pharmaceutical Benefits Scheme (PBS) items supplied, scores on five scales of the Health Literacy Questionnaire,9 and the cost‐effectiveness of the intervention. The Health Literacy Questionnaire was administered at baseline and at six and twelve months. Hospital service use and Medicare and PBS data at the patient level were obtained for the twelve months preceding the intervention, the 12‐month intervention period, and for the 24 months following the intervention. Our 24‐month follow‐up findings will be reported in a separate article.
Our cost‐effectiveness analysis followed Health Economic Evaluation Reporting Standards guidelines.10 The primary outcome for this analysis was the number of quality‐adjusted life‐years (QALYs) gained over twelve months, calculated using the trapezium method11 from EQ‐5D‐5L utility scores for the adult and older adult groups.12 Resource use and costs, estimated from the Australian public health provider perspective, included Medicare claims, PBS items supplied, and South Australian public hospital service use, as well as the payments to intervention group practices ($1000 per participant). A willingness‐to‐pay threshold of $50 000 per QALY gained was applied, consistent with the implicit criterion in Australia for the cost‐effectiveness of new pharmaceuticals and medical services.13
Process evaluation
For the 12‐month intervention period, we assessed continuity of care with the usual provider of care index,14 the proportions of longer GP consultations, and the proportions of patients followed up by GPs within seven days of emergency department presentations or hospitalisations, according to Medicare and SA Health hospital record data. For children and young people with acute problems, we assessed the proportion who received same‐day GP appointments, according to responses in the 12‐month participant questionnaire. We also undertook a retrospective case file audit at one large intervention group practice that was deemed to have implemented the intervention particularly well, to further understand the impact of the intervention on the process measures. A subset of participants took part in qualitative interviews at the end of the trial (findings to be reported in a separate article).
Statistical analysis
We performed intention‐to‐treat analyses. For the main analysis, we undertook a multilevel regression with random intercepts for practice and participant, using maximum likelihood estimation. The models included the two study groups, time (baseline or twelve months), and an intervention × time interaction. For health service count data (hospital service use, Medicare claims, PBS items), we used multilevel regression models based on Poisson or negative binomial distributions and report incidence rate ratios (IRRs) with 95% confidence intervals (CIs). Subgroup analyses were performed at the age group level. We did not adjust analyses for multiple comparisons. For the primary outcome, alternative methods for handling missing data and adjusting for baseline differences were examined in sensitivity analyses. Analyses were performed in Stata 16.1.
A 0.5 standard deviation (SD) change in outcome measure is typically deemed the minimum clinically important difference for health‐related quality of life interventions,15 but a standardised effect size of 0.3 SD could have policy implications at the population level. We estimated that a total of 1100 participants (allowing for 10% loss to follow‐up across the trial) were needed to detect a 0.3 SD change with 73% power, and a 0.5 SD change with 99% power (α = 0.05, two‐sided) in each of the three age groups (details: Supporting Information, part 4).
Ethics approval
The Southern Adelaide Clinical Human Research Ethics Committee approved the study (ID 313.17). All patients provided written informed consent to participation.
Results
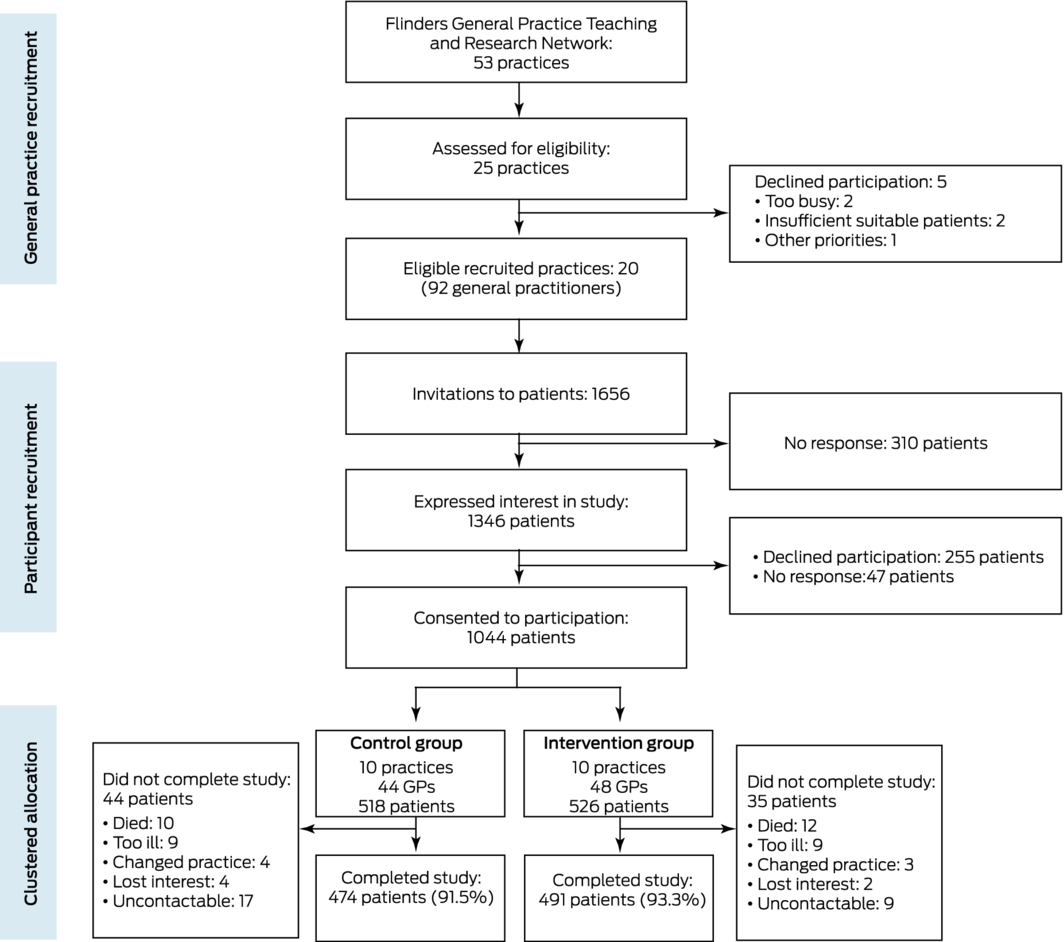
Twenty practices with a total of 92 GPs were recruited and their participation formalised by a memorandum of understanding during 23 January 2018 – 19 February 2018. The general practices invited 1656 patients to participate, of whom 1044 consented (63%) during 30 April 2018 – 10 October 2018. Intervention group practices implemented the intervention from 1 November 2018 to 31 October 2019. As the first recorded case of coronavirus disease 2019 (COVID‐19) in South Australia was reported on 1 February 2020, the pandemic did not affect the study. No practices withdrew during the intervention, and 12‐month follow‐up data were available for 965 patients (control group, 474 [92%]; intervention group, 491 [93%]) (Box 1).
Practice, general practitioner, and participant characteristics at baseline
The general practices ranged in size from one to ten full‐time equivalent GPs; all were privately owned, but two belonged to one practice group. Each practice had at least one practice nurse. The mean IRSD of practice suburbs was 5.5 (SD, 2.8). Fifty of the 92 GPs were men (54%), 76 had graduated in Australia (83%), and their mean duration of general practice experience was 17.7 years (SD, 11.3 years). General practice and GP characteristics were similar for the control and intervention groups (Supporting Information, table 1).
The 1044 recruited patients included 58 children or young people, 315 adults under 65 years with two or more chronic diseases, and 671 older adults. Their mean age was 64.6 (SD, 19.3) years, and 562 were girls or women (54%). Fourteen participants (1.3%) were Aboriginal or Torres Strait Islander people, and 69 (6.6%) reported speaking a language other than English at home. Of the 986 adults and older adults, 595 were married de jure or de facto (60.3%), and 613 were retired (62.3%); they reported a mean of 3.4 (SD, 1.5) chronic diseases, the most frequent types being cardiovascular (627 participants, 60.1%) and musculoskeletal disorders (616, 59.0%). The baseline demographic and clinical characteristics of patients in the control and intervention groups were similar (Box 2).
Primary outcome
The difference between the changes in self‐rated health (EQ‐5D VAS) for the control and intervention groups was not statistically significantly different (coefficient, –0.29; 95% CI, –2.32 to 1.73) (Box 3). The practice‐level VAS intra‐class correlation coefficient (one‐way analysis of variance) was 0.02 (standard error, 0.01). Sensitivity analyses applying alternative methods for handling missing data and adjusting for baseline differences yielded similar results (Supporting Information, part 5). The intervention effects for the adult and older adult groups were not statistically significant; the group of children and young people was too small to reliably estimate an effect (Supporting Information, tables 2 to 4).
Secondary outcomes
Differences between the control and intervention groups in the incidence of emergency department presentations (IRR, 0.90; 95% CI, 0.69–1.17) and hospital admissions (IRR, 0.90; 95% CI, 0.66–1.22), and, in a post hoc analysis, the number of nights in hospital (IRR, 0.65; 95% CI, 0.34–1.24) were not statistically significant (Box 4). Similarly, differences in Medicare specialist claims (IRR, 1.00; 95% CI, 0.91–1.09), PBS items supplied (IRR, 0.99; 95% CI, 0.96–1.03) (Box 4), and five domains of the Health Literacy Questionnaire (Box 3) were not statistically significant. In a post hoc analysis of Medicare specialist claims by category, intervention effects were not statistically significant (Supporting Information, table 5). In a further post hoc analysis, the intervention was associated with a 7% increase (95% CI, 2–14%) in the number of Medicare GP claims, a 21% increase (95% CI, 8–36%) in the number of long GP consultations, and a 17% increase (95% CI, 6–28%) in the number of Medicare GP chronic disease claims (Supporting Information, table 6).
Cost‐effectiveness analysis
Across the twelve months of the intervention, the mean total cost per participant (including the intervention payment of $1000 per intervention participant) was greater for the intervention than the control group ($3268 v $1067; difference, $2201; 95% CI, –$1765 to +$6166). The number of QALYs gained was higher for the intervention group (coefficient, 0.032; 95% CI, 0.001–0.063) (Box 5), and the estimated incremental cost‐effectiveness ratio (ICER) was $69 585 (95% CI, $22 968–$116 201) per QALY gained.
In a threshold analysis, it was estimated that the intervention cost would need to be reduced from $1000 to about $395 per participant for the intervention to be cost‐effective at the willingness to pay threshold of $50 000 per QALY gained. The intervention was associated with ICERs below $50 000 per QALY if it was assumed that its effectiveness was maintained at 100%, 75%, or 50% for up to 36 months after baseline (Supporting Information, part 6).
In subgroup analyses, the estimated ICER for the intervention was $841 202 (95% CI, –$170 447 to $1 852 850) per QALY gained for the adult group, and $15 709 (95% CI, –$19 780 to $51 199) per QALY gained for the older adult group (Supporting Information, part 6 and table 9).
Process evaluation
The intervention was associated with greater likelihood of GP appointments with the most frequently seen GP (v control: odds ratio [OR], 1.14; 95% CI, 1.01–1.28) and long appointments (OR, 1.24; 95% CI, 1.10–1.41), but not of timely follow‐up after emergency department or hospital care episodes (Box 6). For the adults group, the intervention was associated with improved continuity of care (OR, 1.32; 95% CI, 1.06–1.65), but did not influence appointment length (OR, 1.01; 95% CI, 0.81–1.27) or timely follow‐up (OR, 0.72; 95% CI, 0.29–1.81); for older adults, the intervention was associated with longer appointments (OR, 1.37; 95% CI, 1.17–1.59), but did not influence continuity of care (OR, 1.07; 95% CI, 0.93–1.24) or timely follow‐up (OR, 1.38; 95% CI, 0.74–2.58) (Supporting Information, part 7 and table 10).
At the 12‐month follow‐up, 15 of 26 children and young people in the intervention group (58%) and six of 20 in the control group (30%) said they were “always” able to receive an appointment with their preferred GP within two days.
The case file audit conducted in one large intervention group practice identified several barriers to achieving substantial improvements on the process indicators, including preferred GPs not working on days when appointments for acute or urgent problems were requested, people making appointments with GPs at other practices (invariably standard length appointments), and difficulties in providing follow‐up after hospital care episodes when the practice did not receive discharge information (Supporting Information, part 8).
Discussion
In our pragmatic RCT, a multicomponent general practice intervention had no significant effect on the primary outcome, self‐rated health, nor on the secondary outcomes, health literacy and health service use. The economic evaluation, on the other hand, found a significant intervention effect in terms of quality‐of‐life gain for the combined adult and older adult groups. But the intervention was not cost‐effective (except for patients over 65 years of age: $15 709 per QALY gained). The intervention payment would need to be reduced from $1000 to about $395 per participant for it to be cost‐effective overall.
Two factors underlie the discordant outcomes of our clinical and economic evaluations. The first is that the primary study outcome, the EQ‐5D VAS score, measures a respondent’s rating of their own health. In the economic evaluation, we estimated QALYs from the EQ‐5D data. EQ‐5D utility scores reflect the personal value of respondents’ health, whereas QALYs reflect the overall impact of an intervention on both the quantity and quality of life.
Second, economic evaluations focus on the likelihood of an intervention being cost‐effective, in contrast to the null hypothesis testing used to evaluate clinical interventions.10,16,17,18 Cost‐effectiveness analyses evaluate costs and effects together, rather than applying a stepwise approach predicated on a statistically significant intervention effect.10 The consequence is an apparent paradox: the likelihood of a clinically ineffective intervention being cost‐effective can be high.
Limitations
Our cluster RCT study design and the high standard of implementation of the intervention were its strengths. Its major limitations were the short intervention period (twelve months), which may not have allowed benefits that require longer intervention, and that the trial was not adequately powered to detect changes in hospital use. As subgroup analyses must be interpreted cautiously,19 the finding that the intervention was cost‐effective for people aged 65 years or more should be regarded as exploratory. Finally, the participating general practices were recruited from an academic practice research network willing to implement quality improvement initiatives, and may not be broadly representative of general practices in Australia.
Conclusion
Given our mixed findings, the benefit of adding the intervention components to usual general practice care and the level of payment that would be required to enable general practices to provide the intervention cost‐effectively are unclear. However, our findings warrant further investigations in a variety of general practice types, with study designs also powered for outcomes such as hospital use, intervention periods of at least two years, and focused on older people at risk of poor health outcomes.
Box 1 – Recruitment of practices and patients and allocation of practices to the control and intervention groups of the Flinders Quality Enhanced general practice Services Trial (Flinders QUEST)
Box 2 – Baseline demographic and clinical characteristics of patients in the control and intervention groups
|
Characteristics |
Control practices |
Intervention practices |
|||||||||||||
|
|
|||||||||||||||
|
Total number of patients |
518 |
526 |
|||||||||||||
|
Age group |
|
|
|||||||||||||
|
Children (under 18 years) |
28 (5.4%) |
30 (5.7%) |
|||||||||||||
|
Adults (18–64 years) |
171 (33.0%) |
144 (27.4%) |
|||||||||||||
|
Older adults (65 years or older) |
319 (61.6%) |
352 (66.9%) |
|||||||||||||
|
Age (years), mean (SD) |
64.3 (19.6) |
64.9 (19.0) |
|||||||||||||
|
Sex (females) |
298 (57.6%) |
264 (50.2%) |
|||||||||||||
|
Indigenous people* |
11 (2.1%) |
3 (1%) |
|||||||||||||
|
Language other than English spoken at home |
38 (7.3%) |
31 (5.9%) |
|||||||||||||
|
Marital status† |
|
|
|||||||||||||
|
Married |
273 (55.7%) |
322 (64.9%) |
|||||||||||||
|
Separated, divorced, widowed |
164 (33.5%) |
144 (29.0%) |
|||||||||||||
|
Never married |
53 (11%) |
30 (6.1%) |
|||||||||||||
|
Work status†,‡ |
|
|
|||||||||||||
|
Working |
86 (18%) |
72 (14%) |
|||||||||||||
|
Home duties |
31 (6.4%) |
38 (7.7%) |
|||||||||||||
|
Unemployed |
20 (4.1%) |
19 (3.8%) |
|||||||||||||
|
Retired |
294 (60.3%) |
319 (64.3%) |
|||||||||||||
|
Student |
4 (1%) |
6 (1%) |
|||||||||||||
|
Other |
53 (11%) |
42 (8.5%) |
|||||||||||||
|
Annual household income† |
|
|
|||||||||||||
|
< $20 000 |
95 (19%) |
74 (15%) |
|||||||||||||
|
$20 001–40 000 |
137 (28.0%) |
132 (26.6%) |
|||||||||||||
|
$40 001–80 000 |
86 (18%) |
120 (24.2%) |
|||||||||||||
|
≥ $80 001 |
46 (9.4%) |
52 (10%) |
|||||||||||||
|
Not stated |
126 (25.8%) |
118 (23.8%) |
|||||||||||||
|
Chronic diseases: total number, mean (SD) |
3.5 (1.5) |
3.4 (1.5) |
|||||||||||||
|
Cardiovascular |
312 (60.2%) |
315 (59.9%) |
|||||||||||||
|
Cerebrovascular |
45 (8.8%) |
39 (7.4%) |
|||||||||||||
|
Respiratory |
182 (35.2%) |
182 (34.6%) |
|||||||||||||
|
Musculoskeletal |
325 (62.8%) |
291 (55.3%) |
|||||||||||||
|
Psychological |
223 (43.2%) |
186 (35.4%) |
|||||||||||||
|
Digestive |
197 (38.0%) |
180 (34.2%) |
|||||||||||||
|
Diabetes |
167 (32.2%) |
186 (35.4%) |
|||||||||||||
|
Kidney |
41 (7.9%) |
52 (9.9%) |
|||||||||||||
|
Cancer |
120 (23.2%) |
145 (27.6%) |
|||||||||||||
|
Other |
188 (36.3%) |
218 (41.4%) |
|||||||||||||
|
|
|||||||||||||||
|
SD = standard deviation. * Missing data: seven control, five intervention participants. † Two adult groups only. ‡ Missing data: two control participants. |
|||||||||||||||
Box 3 – Primary and secondary outcomes for the control and intervention groups: multilevel linear regression models
|
Outcome |
Control |
Intervention |
Intervention effect: |
||||||||||||
|
Baseline |
12 months |
Baseline |
12 months |
||||||||||||
|
|
|||||||||||||||
|
Primary outcome |
|
|
|
|
|
||||||||||
|
Number of patients in analysis |
518 |
473 |
526 |
491 |
|
||||||||||
|
VAS score, mean (SD) |
69.3 (20.1) |
70.9 (20.1) |
71.2 (19.3) |
72.6 (19.3) |
–0.29 (–2.32 to 1.73) |
||||||||||
|
Secondary outcomes |
|
|
|
|
|
||||||||||
|
Number of patients in analysis |
485 |
445 |
489 |
464 |
|
||||||||||
|
Health Literacy Questionnaire,9 mean score (SD)* |
|
|
|
|
|
||||||||||
|
Feeling understood and supported by health care providers |
3.46 (0.50) |
3.44 (0.53) |
3.48 (0.53) |
3.52 (0.51) |
0.05 (–0.02 to 0.11) |
||||||||||
|
Have sufficient information to manage health |
3.15 (0.57) |
3.21 (0.57) |
3.16 (0.58) |
3.24 (0.55) |
0.00 (–0.07 to 0.07) |
||||||||||
|
Ability to actively engage with healthcare providers |
4.14 (0.64) |
4.16 (0.63) |
4.17 (0.64) |
4.21 (0.63) |
0.01 (–0.06 to 0.08) |
||||||||||
|
Navigating the health care system |
3.93 (0.64) |
3.98 (0.66) |
3.95 (0.66) |
4.03 (0.61) |
0.03 (–0.04 to 0.10) |
||||||||||
|
Understanding information well enough to know what to do |
4.13 (0.67) |
4.19 (0.64) |
4.11 (0.64) |
4.18 (0.60) |
0.02 (–0.05 to 0.08) |
||||||||||
|
|
|||||||||||||||
|
CI = confidence interval; SD = standard deviation; VAS = visual analogue scale of the EQ‐5D. * Adults and older adult groups; missing data for five control and seven intervention participants. Higher scores indicate better health literacy. Scales range from 1 to 4, except for “Feeling understood and supported by health care providers” (range, 1–4). |
|||||||||||||||
Box 4 – Secondary outcomes for the control and intervention groups: multilevel negative binomial models
|
|
Control |
Intervention |
Intervention effect:IRR (95% CI) |
||||||||||||
|
Outcome |
Baseline |
12 months |
Baseline |
12 months |
|||||||||||
|
|
|||||||||||||||
|
Number of patients in analysis |
509 |
509 |
519 |
519 |
|
||||||||||
|
Hospital service use* |
|
|
|
|
|
||||||||||
|
Emergency department presentations, mean (SD) |
0.67 (1.44) |
0.71 (1.57) |
0.70 (1.72) |
0.66 (1.64) |
0.90 (0.69–1.17) |
||||||||||
|
Admissions, mean (SD) |
0.47 (1.04) |
0.54 (1.21) |
0.44 (1.01) |
0.46 (1.08) |
0.90 (0.66–1.22) |
||||||||||
|
Total stay (nights),† mean (SD) |
1.73 (7.70) |
1.79 (5.97) |
1.27 (4.97) |
1.49 (8.55) |
0.65 (0.34–1.24) |
||||||||||
|
Number of patients in analysis |
501 |
501 |
514 |
514 |
|
||||||||||
|
Medicare specialist claims, mean (SD)‡ |
36.3 (37.2) |
35.4 (49.0) |
36.8 (31.8) |
35.70 (35.6) |
1.00 (0.91–1.09) |
||||||||||
|
PBS items supplied, mean (SD)‡ |
53.5 (37.4) |
53.4 (37.3) |
53.4 (37.2) |
53.10 (36.9) |
0.99 (0.96–1.03) |
||||||||||
|
|
|||||||||||||||
|
CI = confidence interval; IRR = incidence rate ratio; PBS = Pharmaceutical Benefits Scheme; SD = standard deviation. * The hospitalisation dataset comprises 1028 participants matched to the South Australia Health Patient Master Index. † Post hoc analysis. ‡ The Medicare/PBS dataset comprises 1015 participants matched to Services Australia records. The analysis dataset excluded claims for GP‐related items. |
|||||||||||||||
Box 5 – Cost‐effectiveness analysis for adult and older adult groups
|
|
Control |
Intervention |
Intervention effect:coefficient (95% CI) |
||||||||||||
|
Outcome |
Baseline* |
12 months |
Baseline* |
12 months |
|||||||||||
|
|
|||||||||||||||
|
Costs (dollars), mean (standard error) |
10 525 (444) |
11 592 (896) |
8739 (554) |
12 007 (1219) |
2201 (–1765 to 6166) |
||||||||||
|
Hospital use |
5127 (414) |
5925 (952) |
3255 (394) |
4781 (1030) |
728 (–3641 to 5095) |
||||||||||
|
Medicare |
3116 (146) |
3103 (125) |
3238 (120) |
3431 (122) |
206 (–430 to 843) |
||||||||||
|
Pharmaceutical Benefits Scheme |
2213 (134) |
2496 (137) |
2217 (292) |
2778 (220) |
277 (–453 to 1008) |
||||||||||
|
Intervention |
— |
— |
— |
1000 |
1000 (1000 to 1000) |
||||||||||
|
Outcomes, mean (standard error) |
|
|
|
|
|
||||||||||
|
EQ‐5D‐5L utility score |
0.607 (0.015) |
0.584 (0.015) |
0.635 (0.014) |
0.620 (0.014) |
0.008 (–0.033 to 0.049) |
||||||||||
|
Quality‐adjusted life‐years gain |
— |
0.595 (0.014) |
— |
0.627 (0.010) |
0.032 (0.001 to 0.063) |
||||||||||
|
|
|||||||||||||||
|
CI = confidence interval. * For outcomes, “baseline” is the start of the intervention; for costs, “baseline” refers to the twelve months preceding the intervention. The cost dataset comprised data for 932 participants, the EQ‐5D‐5L utility score dataset comprised data for 932 participants (Supporting Information, file 5). Quality‐adjusted life‐years (QALY) were calculated from the EQ‐5D‐5L utility score,12 and QALY gains were adjusted for differences in EQ‐5D‐5L scores between the two groups at baseline. |
|||||||||||||||
Box 6 – Process indicators for the adults and older adults groups: multilevel logistic linear regression model
|
Indicator |
Control |
Intervention |
Intervention effect:odds ratio (95% CI) |
||||||||||||
|
Baseline |
12 months |
Baseline |
12 months |
||||||||||||
|
|
|||||||||||||||
|
Participants in analysis* |
474 |
485 |
|
||||||||||||
|
Continuity of care (UPC)† |
|
|
|
|
1.14 (1.01–1.28) |
||||||||||
|
Yes |
4436 (71.3%) |
3957 (68.3%) |
4452 (71.9%) |
4171 (71.0%) |
|
||||||||||
|
No |
1786 (28.7%) |
1834 (31.7%) |
1740 (28.1%) |
1704 (29.0%) |
|
||||||||||
|
Appointment length |
|
|
|
|
1.24 (1.10–1.41) |
||||||||||
|
Brief and standard |
4569 (73.4%) |
4172 (72.0%) |
4304 (69.5%) |
3770 (64.2%) |
|
||||||||||
|
Long and prolonged |
1653 (26.6%) |
1619 (28.0%) |
1888 (30.5%) |
2105 (35.8%) |
|
||||||||||
|
Follow‐up‡ |
|
|
|
|
1.12 (0.67–1.89) |
||||||||||
|
Yes |
117 (52.7%) |
105 (47.4%) |
118 (53.4%) |
103 (46.6%) |
|
||||||||||
|
No |
138 (48.3%) |
148 (51.8%) |
173 (51.5%) |
163 (48.5%) |
|
||||||||||
|
|
|||||||||||||||
|
CI = confidence interval; UPC = usual provider of care index. * Adults and older adults groups, Medicare‐matched; data missing for three participants who had no GP appointments at baseline or 12‐month follow‐up. † Proportion of GP appointments with most frequently seen GP during time period. ‡ Proportion of GP appointments within seven days of an emergency department presentation or hospitalisation. |
|||||||||||||||
Received 2 June 2021, accepted 10 November 2021
- Richard L Reed1
- Leigh Roeger1
- Yuen H Kwok1
- Billingsley Kaambwa1
- Stephen Allison1
- Richard H Osborne2
- 1 College of Medicine and Public Health, Flinders University, Adelaide, SA
- 2 Swinburne University of Technology, Melbourne, VIC
We gratefully acknowledge funding for this project from the Royal Australian College of General Practitioners (RACGP) and the Australian Department of Health. We thank the patients and practice staff at the following general practices for their support: Adelaide City General Practice, Aldinga Medical Centre, Bayside Family Medical and Musculoskeletal Practice, Belair Medical, Chandlers Hill Surgery, Christies Beach Medical Centre, Flagstaff Hill Medical Centre, Flinders Clinic, Hackham Medical Centre, Hallett Cove Family Practice, Medical HQ GP Family Practice Glynde, PartridgeGP, Pasadena Medical Centre, Richmond Health Clinic, Russell Clinic, Seacombe Medical Centre, Torrens Clinic, Warradale Medical Centre, Wirreanda on Wheatsheaf Surgery, and Woodcroft Medical Centre. The Flinders QUEST team comprised Marnie Joyce, Rhea Wadhwani, Louise Armitage, Raelene Burnley (research support officers), Toni Chappel (research nurse), Lynsey Brown (website design and protocol development), Sara Javanparast (qualitative researcher), Heilie Kwok (study coordinator), and Leigh Roeger (trial manager). We also thank the following people who contributed to Flinders QUEST: Richard Woodman, Barbara Toson, Mary Barnes (Flinders University; biostatistical advice), Robert Keane (Flinders University; geospatial assistance), Simon Windsor, Petrina Kasperski, Paul Hakendorf, Chris Horwood, Caroline Temby (SA Health and the Southern Area Local Health Network Office of Research), Danny Byrne and Donna von Blanckensee (Flinders University; general practitioner advisors), the Royal Australian College of General Practitioners, and Services Australia.
No relevant disclosures.
- 1. Huntley A, Lasserson D, Wye L, et al. Which features of primary care affect unscheduled secondary care use? A systematic review. BMJ Open 2014; 4: e004746.
- 2. Wilson A, Childs S. The relationship between consultation length, process and outcomes in general practice: a systematic review. Br J Gen Pract 2002; 52: 1012–1020.
- 3. Bricard D, Or Z. Impact of early primary care follow‐up after discharge on hospital readmissions. Eur J Health Econ 2019; 20: 611–623.
- 4. Australian Department of Health. Evaluation of the Health Care Homes program. Interim evaluation report 2020. Volume 2: main report. 8 Dec 2020. https://www1.health.gov.au/internet/main/publishing.nsf/Content/C7F870EAD1883B57CA2585F40005AAC8/$File/HCH%20Interim%20eval%20report%202020%20Vol%202%20Main%20report%20(Final).pdf (viewed Mar 2022).
- 5. Moulton LH. Covariate‐based constrained randomization of group‐randomized trials. Clin Trials 2004; 1: 297–305.
- 6. Gallis J, Li F, Yu H, Turner EL. cvcrand and cptest: Efficient design and analysis of cluster randomized trials [conference presentation]. Stata conference, Baltimore, 28 July 2017. https://www.stata.com/meeting/baltimore17/slides/Baltimore17_Gallis.pdf (viewed Feb 2022).
- 7. Australian Bureau of Statistics. 2033.0.55.001. Census of Population and Housing: Socio‐Economic Indexes for Areas (SEIFA), Australia, 2016. IRSD. https://www.abs.gov.au/ausstats/abs@.nsf/Lookup/by%20Subject/2033.0.55.001~2016~Main%20Features~IRSD~19 (viewed Mar 2022).
- 8. Herdman M, Gudex C, Lloyd A, et al. Development and preliminary testing of the new five‐level version of EQ‐5D (EQ‐5D‐5L). Qual Life Res 2011; 20: 1727–1736.
- 9. Osborne RH, Batterham RW, Elsworth GR, et al. The grounded psychometric development and initial validation of the Health Literacy Questionnaire (HLQ). BMC Public Health 2013; 13: 658.
- 10. Husereau D, Drummond M, Petrou S, et al. Consolidated Health Economic Evaluation Reporting Standards (CHEERS): explanation and elaboration. A report of the ISPOR Health Economic Evaluation Publication Guidelines Good Reporting Practices Task Force. Value Health 2013; 16: 231–250.
- 11. Drummond M, Drummond M. Methods for the economic evaluation of health care programmes. 3rd ed. Oxford, New York: Oxford University Press, 2005.
- 12. Norman R, Cronin P, Viney R. A pilot discrete choice experiment to explore preferences for EQ‐5D‐5L health states. Appl Health Econ Health Policy 2013; 11: 287–298.
- 13. Harris AH, Hill SR, Chin G, et al. The role of value for money in public insurance coverage decisions for drugs in Australia: a retrospective analysis 1994–2004. Med Decis Making 2008; 28: 713–722.
- 14. Barker I, Steventon A, Deeny SR. Association between continuity of care in general practice and hospital admissions for ambulatory care sensitive conditions: cross sectional study of routinely collected, person level data. BMJ 2017; 356: j84.
- 15. Norman GR, Sloan JA, Wyrwich KW. Interpretation of changes in health‐related quality of life: the remarkable universality of half a standard deviation. Med Care 2003; 41: 582–592.
- 16. Raftery J, Williams HC, Clarke A, et al. “Not clinically effective but cost‐effective”: paradoxical conclusions in randomised controlled trials with “doubly null” results: a cross‐sectional study. BMJ Open 2020; 10: e029596.
- 17. O’Sullivan AK, Thompson D, Drummond MF. Collection of health‐economic data alongside clinical trials: is there a future for piggyback evaluations? Value Health 2005; 8: 67–79.
- 18. Petrou S, Gray A. Economic evaluation alongside randomised controlled trials: design, conduct, analysis, and reporting. BMJ 2011; 342: d1548.
- 19. Brookes ST, Whitley E, Peters TJ, et al. Subgroup analyses in randomised controlled trials: quantifying the risks of false‐positives and false‐negatives. Health Technol Assess 2001; 5: 1–56.
Abstract
Objective: To determine whether a multicomponent general practice intervention cost‐effectively improves health outcomes and reduces health service use for patients at high risk of poor health outcomes.
Design, setting: Clustered randomised controlled trial in general practices in metropolitan Adelaide.
Participants: Three age‐based groups of patients identified by their general practitioners as being at high risk of poor health outcomes: children and young people (under 18 years), adults (18–64 years) with two or more chronic diseases, and older people (65 years or more).
Intervention: Enrolment of patients with a preferred GP, longer general practice appointments, and general practice follow‐up within seven days of emergency department and hospital care episodes. Intervention practices received payment of $1000 per enrolled participant.
Main outcome measures: Primary outcome: change in self‐rated health between baseline and 12‐month follow‐up for control (usual care) and intervention groups. Secondary outcomes: numbers of emergency department presentations and hospital admissions, Medicare specialist claims and Pharmaceutical Benefits Scheme (PBS) items supplied, Health Literacy Questionnaire scores, and cost‐effectiveness of the intervention (based on the number of quality‐adjusted life‐years [QALYs] gained over 12 months, derived from EQ‐5D‐5L utility scores for the two adult groups).
Results: Twenty practices with a total of 92 GPs were recruited, and 1044 eligible patients participated. The intervention did not improve self‐rated health (coefficient, –0.29; 95% CI, –2.32 to 1.73), nor did it have significant effects on the numbers of emergency department presentations (incidence rate ratio [IRR], 0.90; 95% CI, 0.69–1.17), hospital admissions (IRR, 0.90; 95% CI, 0.66–1.22), Medicare specialist claims (IRR, 1.00; 95% CI, 0.91–1.09), or PBS items supplied (IRR, 0.99; 95% CI, 0.96–1.03), nor on Health Literacy Questionnaire scores. The intervention was effective in terms of QALYs gained (v usual care: difference, 0.032 QALYs; 95% CI, 0.001–0.063), but the incremental cost‐effectiveness ratio was $69 585 (95% CI, $22 968–$116 201) per QALY gained, beyond the willingness‐to‐pay threshold.
Conclusions: Our multicomponent intervention did not improve self‐rated health, health service use, or health literacy. It achieved greater improvement in quality of life than usual care, but not cost‐effectively.
Trial registration: Australian New Zealand Clinical Trials Registry, ACTRN12617001589370 (prospective).