


The known: Survival for people with acute leukaemia has improved over the past four decades. Differences in survival gains by socio‐economic status, ethnic background, remoteness, and age have been reported overseas, but have not been investigated in detail in Australia.
The new: Survival for people with acute lymphoblastic and acute myeloid leukaemia improved significantly in South Australia during 1980–2016, with greater gains for younger than older patients. Socio‐economic disadvantage, remoteness, and country of birth did not influence mortality or improvement in survival.
The implications: More effective therapies are needed acute leukaemia, particularly for people over 50 years of age at diagnosis.
Outcomes for people with acute lymphoblastic leukaemia (ALL) or acute myeloid leukaemia (AML) are poorer than those for people with many other cancers, but they have continually improved in recent decades for both children1,2,3 and adults.1,4 More intensive chemotherapy for adult patients, stem cell transplantation, and better supportive care have contributed to improved survival.5
When primary prevention options are limited, as is the case with leukaemia, changes in survival can indicate whether advances in clinical and supportive care are being translated into practice at the population level.6 Differences in survival gains can indicate disparities in access to improved care associated with remoteness, cultural or language barriers, or socio‐economic circumstances.7
National and regional changes in cancer survival (for all cancers and for selected solid tumours) suggest that differences linked with socio‐economic status, place of residence, and ethnic background are increasing in Australia.8,9,10 Persistent and possibly increasing differences in the survival of patients with acute leukaemia have also been reported overseas, particularly in the United States,4,11,12,13 but not in the United Kingdom.14 Changes in survival for people with acute leukaemia in Australia have not been described in detail.
We therefore examined population trends in 5‐year survival rates for people in South Australia diagnosed with acute leukaemia during 1980–2016. To assess disparities in access to and provision of care, we focused on changes in disease‐specific mortality in different socio‐demographic groups.
Methods
The South Australian Cancer Registry (SACR) supplied de‐identified data for our study. The SACR receives statutory notifications of all cancer diagnoses in South Australia (population, 2021: 1.8 million), and captures information on acute leukaemia diagnoses and incidence and survival data, but not detailed treatment information.
We included all primary cases of ALL (International Classification of Diseases for Oncology [ICD‐O‐3] codes M9826, M9835–9837, M9801, M9805, M9820, M9831, M9832, M9833, M9834) and AML (ICD‐O‐3 codes M9840, M9860, M9861, M9866–9874, M9891–9920, M9930–9931) diagnosed during 1 January 1980 – 31 December 2016, and follow‐up data to 31 December 2018. We excluded cases of acute undifferentiated leukaemia and mixed phenotype acute leukaemia, myelodysplastic/myeloproliferative neoplasms, and chronic myelomonocytic leukaemia.
We extracted information on date of diagnosis (year and month), age at diagnosis, sex, date and cause of death (ICD‐10 cancer codes or other record), country of birth (Australia, other English‐speaking country, non‐English‐speaking country, missing), residential postcode‐based socio‐economic status (Index of Relative Socio‐Economic Advantage and Disadvantage15 for 2011; by quintile), and remoteness of residence (Accessibility Remoteness Index of Australia Standard Classification16 for 2006; metropolitan, inner regional, and outer regional/remote areas). Cause and date of death information was collected by the SACR from state deaths records, the National Death Index (Australian Institute of Health and Welfare), and interstate deaths registries.
Statistical analysis
We analysed data in Stata 15.1. Case survival rates were calculated, with 31 December 2018 as the censoring date. We estimated Kaplan–Meier product‐limit disease‐specific survival, treating deaths from other causes as censored observations. Previous analyses based on relative survival or disease‐specific survival rates have yielded similar estimates for South Australia, and disease‐specific survival is consequently regarded as an acceptable proxy for relative survival rates at the population level.17
We assessed the influence of socio‐demographic and histological factors on disease‐specific mortality in multivariate Cox proportional hazards regression analyses, using the same censoring criteria as for the Kaplan–Meier analyses. Models were adjusted for all covariates (age, sex, diagnosis period, country of birth, socio‐economic status, remoteness, and histological type [ALL, AML] when applicable). Assumptions underlying the analysis, including proportionality and absence of collinearity, were satisfied.
To assess differences in the rate of change in disease‐specific mortality by socio‐demographic characteristic, further Cox regression models included interaction terms for diagnosis period (5‐year categories) and age group (under 15, 15–29, 30–49, 50–69, 70 or more years, when numbers for the category were adequate); diagnosis period and remoteness; and diagnosis period and socio‐economic status (quintiles). The statistical significance of interactions was assessed in likelihood ratio tests of nested Cox proportional hazards models with and without interaction terms. Rates of change in disease‐specific mortality by socio‐demographic group are presented as hazard ratios (HRs) with 95% confidence intervals (CIs) for 5‐year period increments (continuous variable), derived from stratified models.
The Australian Institute of Health and Welfare supplied national crude 5‐year disease‐specific survival data (estimated with the cohort method) for people with AML or ALL, by age group, socio‐economic status quintile, and remoteness of residence. As the data were provided in separate tables, multivariable analyses could not be undertaken. To assess changes in the provision of stem cell transplantation, we also obtained numbers of procedures undertaken at the Royal Adelaide Hospital (the only centre offering transplantation to adults in South Australia) since 1 January 1980, by age group.
Ethics approval
Our study was approved by the Human Research Ethics Committee of the South Australian Department of Health and Wellbeing (HREC/20/SAH/13).
Results
Our analyses included data for 1035 people diagnosed with ALL and 2814 diagnosed with AML. Most patients with ALL were under 30 years of age (562 of 1035, 54%), while most people with AML were at least 60 years old (2007 of 2814, 71%) (Box 1).
Acute lymphoblastic leukaemia
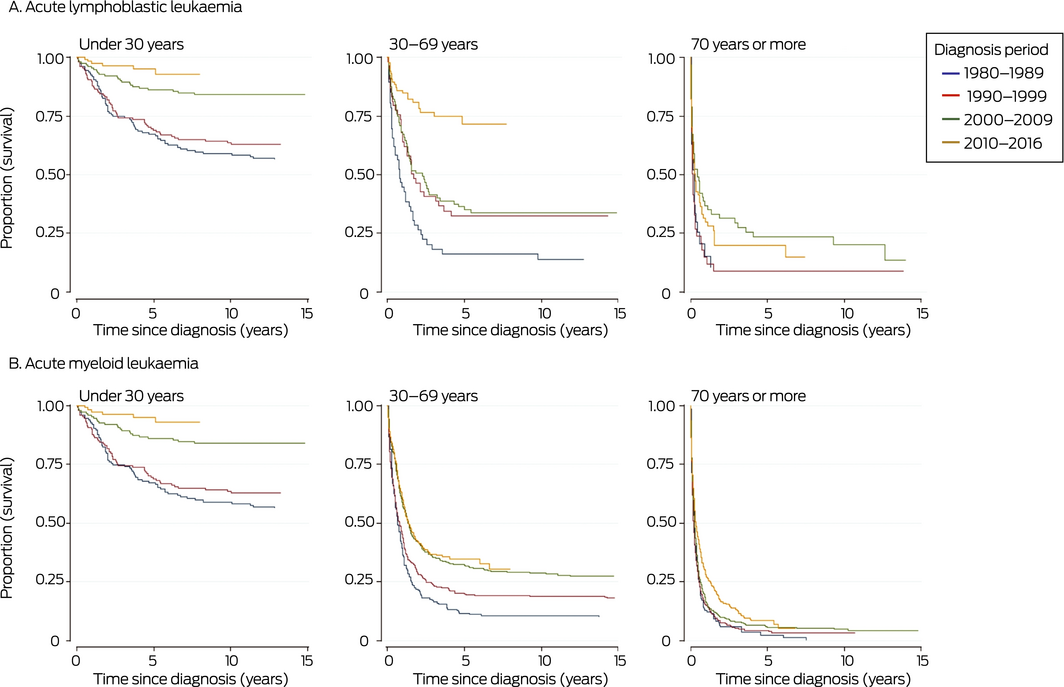
Overall 5‐year disease‐specific survival for people with ALL diagnosed during 1980–2016 was 58% (95% CI, 54–61%); disease‐specific survival at 20 years was 52% (95% CI, 49–55%). Five‐year survival increased from 44% (95% CI, 35–52%) for people diagnosed during 1980–1984 to 69% (95% CI, 63–75%) for those diagnosed during 2010–2016. It was highest for people diagnosed before the age of 15 years (82%; 95% CI, 78–86%) and declined with age of diagnosis, to 12% (95% CI, 6–19%) for those diagnosed aged 80 years or more. Socio‐economic status and remoteness did not influence survival. Five‐year survival was higher for people born in Australia than for those born overseas (Box 1); this reflects the difference in distribution of ages at diagnosis between patients born in Australia or overseas (data not shown). Five‐year survival improved most markedly among patients aged 30–69 years, and remained poor for those aged 70 years or more (Box 2, A).
Acute myeloid leukaemia
Overall 5‐year disease‐specific survival for people with AML diagnosed during 1980–2016 was 18% (95% CI, 17–20%); disease‐specific survival at 20 years was 15% (95% CI, 13–16%). Five‐year disease‐specific survival increased from 9% (95% CI, 5–15%) for people diagnosed during 1980–1984 to 23% (95% CI, 20–26%) for those diagnosed during 2010–2016. It was highest for people diagnosed before the age of 15 years (53%; 95% CI, 40–64%) and declined with age, to 4% (95% CI, 2–6%) for those diagnosed aged 80 years or more. Socio‐economic status and remoteness did not influence survival, and the influence of country of birth was small (Box 1). Five‐year survival improved most markedly among patients aged 30–69 years, and did not change for those aged 70 years or more (Box 2, B).
Acute leukaemia: national data
Analysis of national data indicated that improvement in 5‐year survival for people with ALL or AML was greatest for those aged 30–39 years (Supporting Information, figure 1). In contrast to our findings for South Australia, lower socio‐economic status was associated with poorer survival, as was regional residence for people with AML (Supporting Information, table 1).
Multivariable analyses
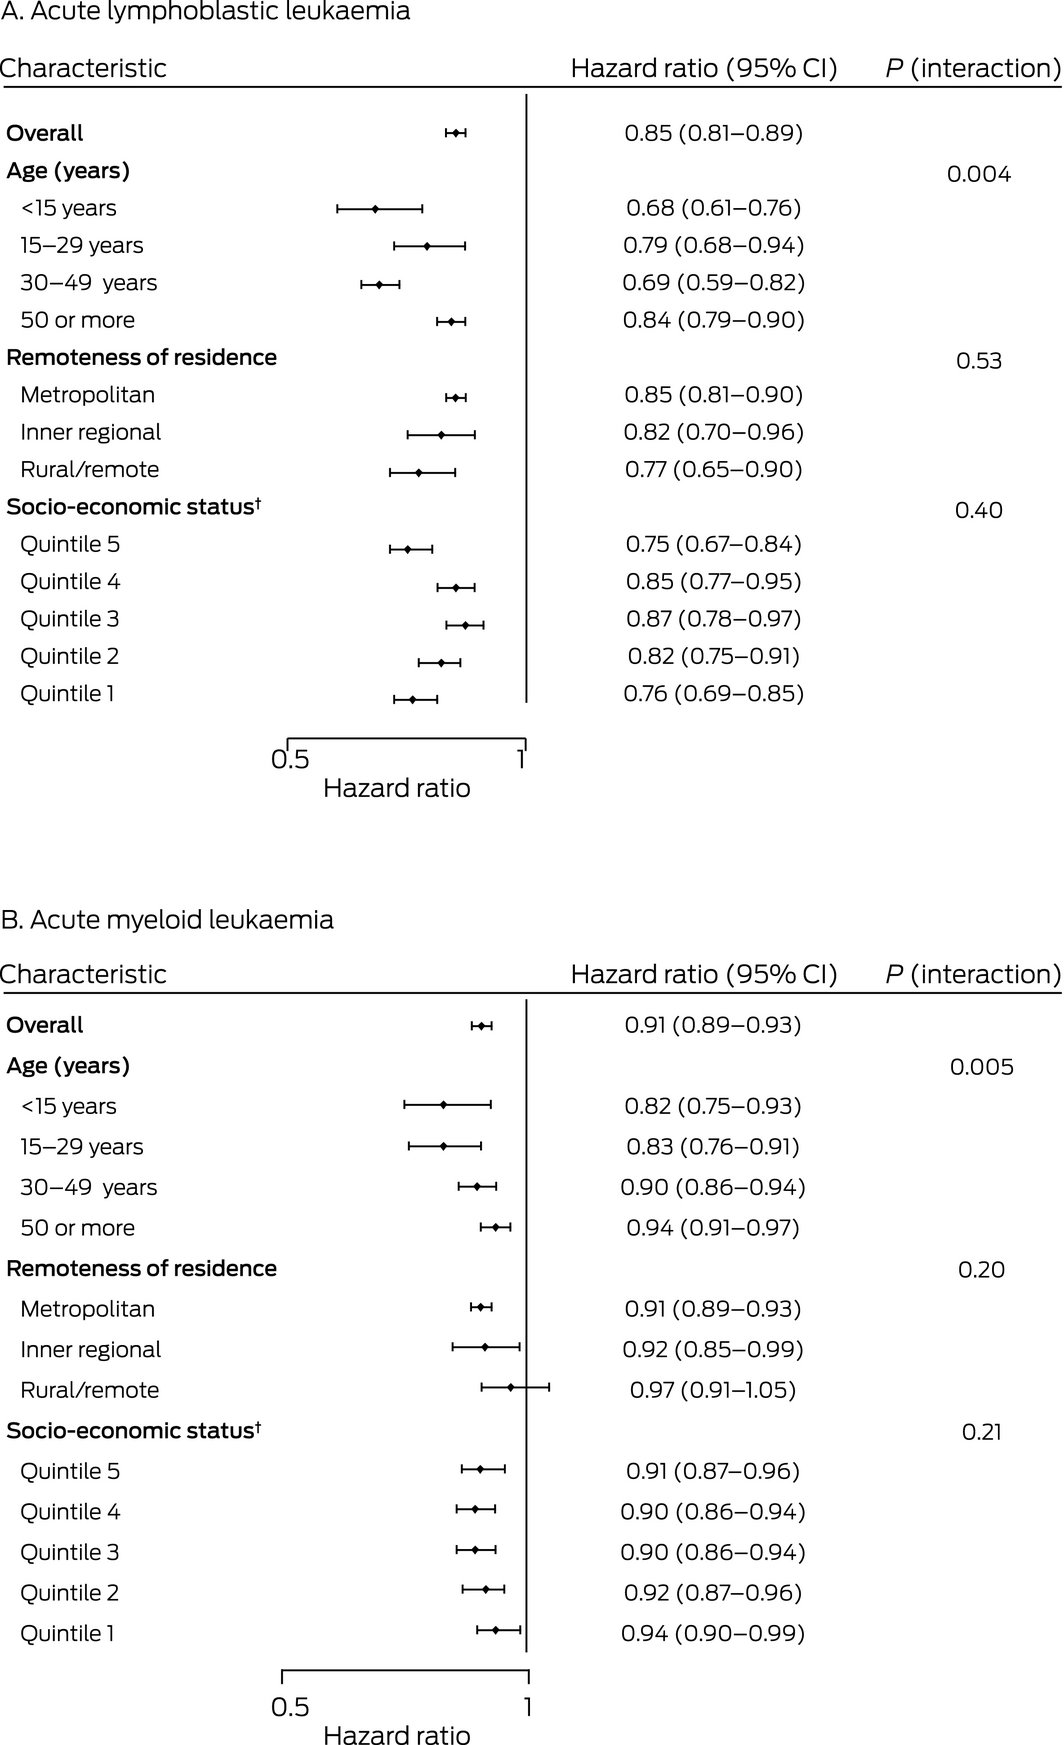
Type of leukaemia, age at diagnosis, and diagnosis period influenced the risk of death from acute leukaemia in South Australia. After adjusting for differences in other covariates, disease‐specific mortality was greater for people with AML than for those with ALL (HR, 1.42; 95% CI, 1.27–1.59). Risk of death increased with age both for people with ALL (70–79 years v 0–14 years: HR, 11.1; 95% CI, 8.15–15.2) and those with AML (HR, 4.72; 95% CI, 3.33–6.69). The risk was lower for people diagnosed during 2010–2016 than for those diagnosed during 1980–1984 (ALL: HR, 0.35; 95% CI, 0.25–0.48; AML: HR, 0.53; 95% CI, 0.45–0.64); the largest declines in risk were between 1995–1999 and 2000–2004. After adjusting for age and other factors, socio‐economic status, remoteness, and country of birth did not significantly influence risk of death (Box 3). Multivariable analyses of all‐cause mortality yielded similar results (Supporting Information, table 2).
Disease‐specific mortality for people with acute leukaemia declined in all socio‐demographic groups between 1980–1984 and 2010–2016. Significant improvements were noted for all age groups, but were generally larger for younger age groups. The influence of neither socio‐economic status nor remoteness of residence on change in disease‐specific mortality were statistically significant (Box 4).
Stem cell transplantation
A total of 108 adults with ALL and 299 with AML received allogeneic stem cell transplants in South Australia during 1980–2018. The annual number of transplantations has increased since the 1990s, particularly among people with acute leukaemia aged 50 years or more (Supporting Information, figure 2).
Discussion
We found that survival for people in South Australia with acute leukaemia has continually improved over the past four decades, with the largest gains in the early 2000s. Survival gains were greater (in both absolute and relative terms) for people with ALL than for those with AML, and for younger people. Neither survival nor improvement in survival were influenced by socio‐economic status or remoteness of residence.
Several factors may have contributed to sustained improvements in survival. For ALL, intensive chemotherapy protocols changed little during the study period, but have been extended to older patients as management of toxicity and support services for infection and graft versus host disease improved. Tyrosine kinase inhibitors have been available since 2000 for Philadelphia chromosome‐positive patients.18 Allogeneic stem cell transplantation has been possible since 1980, but the numbers of transplants remained small before gradually increasing from 2000. Newer treatments, such as blinatumomab and chimeric antigen receptor T (CAR‐T) cell therapies, were introduced too recently to have affected survival during the study period.
For people with AML, the major change to treatment protocols has been the introduction of high dose cytarabine therapy and the addition of all‐trans retinoic acid (tretinoin) and arsenic trioxide for treating some forms.5 Supportive measures for managing fungal infections, febrile neutropenia, and graft versus host disease have improved.19,20 The use of allogeneic stem cell transplantation has increased since the early 2000s, and at the Royal Adelaide Hospital eligibility was extended from 65 to 70 years of age in 2010. These factors may have contributed to improved survival since 2000.
Despite overall improvements, disease‐specific survival of older patients with acute leukaemia remains disappointingly low, particularly for people with AML, as also reported overseas.1 Further research, including clinical trials of new therapies tolerated by older patients, is vital to improving outcomes.
Our findings that remoteness, country of birth, and socio‐economic status did not influence survival suggests that access to and quality of care for acute leukaemia is reasonably equitable in South Australia. This contrasts with differences in outcomes linked with socio‐economic status that we identified in national Australian survival data, and with reports from some overseas studies (predominantly from the US) that survival is poorer for people living in socio‐economic disadvantage12,21 and patients from minority groups;4,11 one US study found that the differences had, in fact, grown.4 However, similar disparities were not found in one UK study.22 In Australia, socio‐economic status and region are reported to influence survival of people with any cancer and of those with various non‐haematological cancers, nationally,23,24 and in Victoria25,26 and New South Wales.10 The Victorian study, which combined all leukaemia types, found that mortality was higher among patients from the most socially disadvantaged than for those from the least disadvantaged areas,25 but found no difference in mortality for metropolitan and non‐metropolitan residents.26 Widening socio‐economic and regional disparities in survival for New South Wales people with cancer (all types) or several solid tumour types have been reported,10 but the study did not separately assess survival for people with haematological cancers.
As effective preventive and early detection measures for acute leukaemia are not available, any disparities in outcomes probably reflect health system factors, including differences in access to and quality of care.6 In South Australia, central haematology services are provided in a few tertiary centres in Adelaide, and transplantation is available only at the Royal Adelaide Hospital and (for children) at the Women’s and Children’s Hospital, supported by the Cellular Therapies Laboratory of SA Pathology. In most other Australian states, several regional centres provide care for patients with acute leukaemia. The centralised, single pathway of care in South Australia may be one explanation for the comparative equity of survival. In addition, several charities offer subsidised accommodation and transport services for rural patients with leukaemia in South Australia, perhaps mitigating the logistical and financial burdens of travelling to Adelaide for treatment.
Limitations
We had no data about the treatment of individual patients, so we cannot attribute improved survival to specific changes in treatment. Changes to histological classification and improved diagnostic methods during the study period are unlikely to have contributed significantly to improving survival for people with acute leukaemia. Subgroup analyses may have been limited by small numbers and consequently low statistical power; using broad categories for remoteness of residence may have missed differences in outcomes for patients from remote locations. Area‐based measures of socio‐economic status may be imprecise compared with individual‐based measures of deprivation. Conversely, population‐wide coverage and continued follow‐up of vital status in multiple data sources allowed us to assess improvements and differences in outcomes for people with acute leukaemia across South Australia, but our findings may not be generalisable to the rest of Australia.
Conclusion
Five‐year survival for people with ALL and AML in South Australia continuously improved between 1980–1984 and 2010–2016, and socio‐economic status and remoteness did not influence outcomes. However, survival is still relatively poor compared with many other cancer types, particularly for older people with acute leukaemia, and new therapies may be required to further improve survival.
Box 1 – Demographic characteristics and crude 5‐year disease‐specific survival for people with acute lymphoblastic leukaemia or acute myeloid leukaemia, South Australia, 1980–2016
|
Characteristic |
Acute lymphoblastic leukaemia |
Acute myeloid leukaemia |
|||||||||||||
|
Number |
5‐year survival (95% CI) |
P* |
Number |
5‐year survival (95% CI) |
P* |
||||||||||
|
|
|||||||||||||||
|
All patients |
1035 |
58% (54–61%) |
|
2814 |
18% (17–20%) |
|
|||||||||
|
Age group (years) |
|
|
< 0.001 |
|
|
< 0.001 |
|||||||||
|
0–14 |
450 (43%) |
82% (78–86%) |
|
75 (3%) |
53% (40–64%) |
|
|||||||||
|
15–29 |
112 (11%) |
60% (50–68%) |
|
120 (4%) |
50% (41–59%) |
|
|||||||||
|
30–39 |
52 (5%) |
40% (26–53%) |
|
115 (4%) |
44% (35–53%) |
|
|||||||||
|
40–49 |
54 (5%) |
51% (36–63%) |
|
181 (6%) |
38% (30–45%) |
|
|||||||||
|
50–59 |
73 (7%) |
45% (32–57%) |
|
316 (11%) |
31% (26–36%) |
|
|||||||||
|
60–69 |
99 (10%) |
35% (25–45%) |
|
565 (20%) |
15% (11–36%) |
|
|||||||||
|
70–79 |
102 (10%) |
21% (14–30%) |
|
795 (28%) |
7% (5–10%) |
|
|||||||||
|
80 or more |
93 (9%) |
12% (6–19%) |
|
647 (23%) |
4% (2–6%) |
|
|||||||||
|
Sex |
|
|
0.23 |
|
|
0.85 |
|||||||||
|
Male |
578 (56%) |
58% (54–61%) |
|
1625 (58%) |
18% (16–20%) |
|
|||||||||
|
Female |
457 (44%) |
58% (54–61%) |
|
1189 (42%) |
19% (16–21%) |
|
|||||||||
|
Diagnosis period |
|
|
< 0.001 |
|
|
< 0.001 |
|||||||||
|
1980–1984 |
121 (12%) |
44% (35–52%) |
|
213 (8%) |
9% (5–15%) |
|
|||||||||
|
1985–1989 |
114 (11%) |
55% (45–64%) |
|
264 (9%) |
9% (5–13%) |
|
|||||||||
|
1990–1994 |
112 (11%) |
56% (47–65%) |
|
314 (11%) |
14% (10–18%) |
|
|||||||||
|
1995–1999 |
126 (12%) |
48% (39–57%) |
|
393 (14%) |
16% (12–20%) |
|
|||||||||
|
2000–2004 |
156 (15%) |
58% (49–65%) |
|
472 (17%) |
20% (16–24%) |
|
|||||||||
|
2005–2009 |
137 (13%) |
63% (52–70%) |
|
376 (13%) |
22% (18–27%) |
|
|||||||||
|
2010–2014 |
184 (18%) |
69% (63–75%)† |
|
522 (18%) |
23% (20–26%)† |
|
|||||||||
|
2015–2016 |
85 (8%) |
— |
|
260 (9%) |
— |
|
|||||||||
|
Country of birth |
|
|
< 0.001 |
|
|
< 0.001 |
|||||||||
|
Australia |
815 (79%) |
61% (57–64%) |
|
1912 (68%) |
18% (16–20%) |
|
|||||||||
|
Other English‐speaking country |
79 (8%) |
30% (19–40%) |
|
406 (14%) |
16% (12–20%) |
|
|||||||||
|
Non‐English‐speaking country |
95 (9%) |
35% (25–45%) |
|
456 (16%) |
14% (11–18%) |
|
|||||||||
|
Missing data |
46 (4%) |
— |
|
40 (1%) |
— |
|
|||||||||
|
Socio‐economic status‡ |
|
|
0.14 |
|
|
0.17 |
|||||||||
|
Quintile 1 (most disadvantaged) |
230 (22%) |
62% (55–69%) |
|
558 (20%) |
18% (15–22%) |
|
|||||||||
|
Quintile 2 |
195 (19%) |
54% (46–61%) |
|
560 (20%) |
18% (15–21%) |
|
|||||||||
|
Quintile 3 |
203 (20%) |
56% (49–63%) |
|
596 (21%) |
18% (15–22%) |
|
|||||||||
|
Quintile 4 |
172 (17%) |
53% (45–60%) |
|
557 (20%) |
17% (14–20%) |
|
|||||||||
|
Quintile 5 (least disadvantaged) |
231 (22%) |
61% (54–67%) |
|
536 (19%) |
19% (16–23%) |
|
|||||||||
|
Remoteness of residence |
|
|
0.79 |
|
|
0.12 |
|||||||||
|
Metropolitan |
848 (82%) |
58% (55–62%) |
|
2292 (81%) |
17% (15–19%) |
|
|||||||||
|
Inner regional |
99 (10%) |
53% (52–71%) |
|
257 (9%) |
21% (16–27%) |
|
|||||||||
|
Outer regional/remote |
88 (8%) |
55% (43–64%) |
|
265 (9%) |
21% (17–27%) |
|
|||||||||
|
|
|||||||||||||||
|
CI = confidence interval. * Kaplan–Meier analysis (log‐rank test). † Five‐year survival for 2010–2016 reported. ‡ Index of Relative Socio‐Economic Advantage and Disadvantage for 2011.15 |
|||||||||||||||
Box 2 – Kaplan–Meier survival curves for people with acute lymphoblastic (A) or acute myeloid leukaemia (B), South Australia, 1980–2016, by diagnostic period and age group
Box 3 – Relative risk of death from acute leukaemia: multivariable Cox proportional hazard regression models, with mutual adjustment for all covariates
|
Characteristic |
Hazard ratio (95% confidence interval) |
||||||||||||||
|
Acute lymphoblastic leukaemia |
Acute myeloid leukaemia |
All acute leukaemia |
|||||||||||||
|
|
|||||||||||||||
|
Age group (years) |
|
|
|
||||||||||||
|
0–14 |
1 |
1 |
1 |
||||||||||||
|
15–29 |
2.41 (1.71–3.40) |
1.07 (0.70–1.63) |
2.01 (1.55–2.60) |
||||||||||||
|
30–39 |
3.64 (2.40–5.53) |
1.35 (0.89–2.04) |
2.66 (2.02–3.49) |
||||||||||||
|
40–49 |
3.90 (2.51–6.09) |
1.60 (1.09–2.36) |
2.97 (2.31–3.82) |
||||||||||||
|
50–59 |
4.38 (2.97–6.47) |
1.95 (1.36–2.80) |
3.57 (2.84–4.48) |
||||||||||||
|
60–69 |
7.17 (5.02–10.2) |
3.03 (2.13–4.31) |
5.53 (4.47–6.84) |
||||||||||||
|
70–79 |
11.1 (8.15–15.2) |
4.72 (3.33–6.69) |
8.69 (7.11–10.7) |
||||||||||||
|
80 or more |
21.2 (15.1–30.0) |
6.79 (4.78–9.64) |
12.8 (10.4–15.9) |
||||||||||||
|
Sex |
|
|
|
||||||||||||
|
Male |
1 |
1 |
1 |
||||||||||||
|
Female |
1.12 (0.92–1.35) |
1.05 (0.96–1.14) |
1.05 (0.97–1.13) |
||||||||||||
|
Diagnosis period |
|
|
|
||||||||||||
|
1980–1984 |
1 |
1 |
1 |
||||||||||||
|
1985–1989 |
1.12 (0.78–1.60) |
0.85 (0.69–1.05) |
0.88 (0.74–1.05) |
||||||||||||
|
1990–1994 |
0.77 (0.54–1.10) |
0.87 (0.71–1.06) |
0.83 (0.70–0.98) |
||||||||||||
|
1995–1999 |
0.88 (0.63–1.25) |
0.83 (0.68–1.01) |
0.81 (0.69–0.96) |
||||||||||||
|
2000–2004 |
0.48 (0.34–0.67) |
0.64 (0.53–0.77) |
0.59 (0.51–0.70) |
||||||||||||
|
2005–2009 |
0.41 (0.27–0.60) |
0.71 (0.58–0.86) |
0.63 (0.53–0.75) |
||||||||||||
|
2010–2016 |
0.35 (0.25–0.48) |
0.53 (0.45–0.64) |
0.49 (0.42–0.57) |
||||||||||||
|
Country of birth |
|
|
|
||||||||||||
|
Australia |
1 |
1 |
1 |
||||||||||||
|
Other English‐speaking country |
1.03 (0.75–1.40) |
1.00 (0.88–1.13) |
1.02 (0.91–1.15) |
||||||||||||
|
Non‐English‐speaking country |
1.21 (0.90–1.64) |
0.98 (0.87–1.10) |
1.01 (0.90–1.12) |
||||||||||||
|
Socio‐economic status* |
|
|
|
||||||||||||
|
Quintile 1 (most disadvantaged) |
1 |
1 |
1 |
||||||||||||
|
Quintile 2 |
1.49 (1.10–2.02) |
0.95 (0.83–1.09) |
1.02 (0.90–1.16) |
||||||||||||
|
Quintile 3 |
1.24 (0.92–1.68) |
0.95 (0.82–1.09) |
0.99 (0.87–1.13) |
||||||||||||
|
Quintile 4 |
1.26 (0.92–1.71) |
0.98 (0.85–1.12) |
1.02 (0.90–1.16) |
||||||||||||
|
Quintile 5 (least disadvantaged) |
1.24 (0.90–1.74) |
0.91 (0.79–1.06) |
0.96 (0.84–1.09) |
||||||||||||
|
Remoteness of residence |
|
|
|
||||||||||||
|
Metropolitan |
1 |
1 |
1 |
||||||||||||
|
Inner regional |
1.04 (0.74–1.47) |
0.89 (0.75–1.05) |
0.91 (0.77–1.06) |
||||||||||||
|
Outer regional/remote |
0.98 (0.69–1.39) |
0.89 (0.76–1.04) |
0.91 (0.79–1.05) |
||||||||||||
|
|
|||||||||||||||
|
CI = confidence interval. * Index of Relative Socio‐Economic Advantage and Disadvantage for 2011.15 |
|||||||||||||||
Box 4 – Change per 5‐year diagnosis period in risk of leukaemia‐related death for people diagnosed with acute lymphoblastic (A) or acute myeloid leukaemia (B), South Australia, 1980–2016, by socio‐demographic characteristic*
CI = confidence interval.
*Adjusted for age group, socio‐economic status (quintiles), remoteness, and country of birth. Interaction (characteristic * diagnosis period) P values were derived from likelihood ratio tests of nested Cox proportional hazards models with and without interaction terms.
†Index of Relative Socio‐Economic Advantage and Disadvantage for 2011.15
Received 12 July 2021, accepted 21 September 2021
- Kerri Beckmann1
- Brendon J Kearney2
- David Yeung2
- Devendra Hiwase2
- Ming Li1
- David M Roder1
- 1 The University of South Australia, Adelaide, SA
- 2 Royal Adelaide Hospital, Adelaide, SA
This study was funded by the Health Services Charitable Gifts Board. Kerri Beckmann is supported by a National Health and Medical Research Council Sidney Sax Early Career Researcher Fellowship (1124210). We thank Alia Cibich (Royal Adelaide Hospital, Adelaide, SA) for providing data on stem cell transplantation in South Australia.
No relevant disclosures.
- 1. Bertuccio P, Bosetti C, Malvezzi M, et al. Trends in mortality from leukemia in Europe: an update to 2009 and a projection to 2012. Int J Cancer 2013; 132: 427–436.
- 2. Bonaventure A, Harewood R, Stiller CA, et al; CONCORD Working Group. Worldwide comparison of survival from childhood leukaemia for 1995–2009, by subtype, age, and sex (CONCORD‐2): a population‐based study of individual data for 89 828 children from 198 registries in 53 countries. Lancet Haematol 2017; 4: e202–e217.
- 3. Petridou ET, Dimitrova N, Eser S, et al. Childhood leukemia and lymphoma: time trends and factors affecting survival in five Southern and Eastern European Cancer Registries. Cancer Causes Control 2013; 24: 1111–1118.
- 4. Pulte D, Redaniel MT, Jansen L, et al. Recent trends in survival of adult patients with acute leukemia: overall improvements, but persistent and partly increasing disparity in survival of patients from minority groups. Haematologica 2013; 98: 222–229.
- 5. Ferrara F, Schiffer CA. Acute myeloid leukaemia in adults. Lancet 2013; 381: 484–495.
- 6. Dickman PW, Adami HO. Interpreting trends in cancer patient survival. J Intern Med 2006; 260: 103–117.
- 7. Patel MI. Scientific achievements may not reach everyone: understanding disparities in acute leukemia. Curr Hematol Malig Rep 2016; 11: 265–270.
- 8. Bygrave A, Whittaker K, Aranda S. Inequalities in cancer outcomes by Indigenous status and socioeconomic quintile: an integrative review. Sydney: Cancer Council Australia, 2020. https://www.cancer.org.au/assets/pdf/inequalities‐in‐cancer‐outcomes (viewed Mar 2021).
- 9. Fox P, Boyce A. Cancer health inequality persists in regional and remote Australia. Med J Aust 2014; 201: 445–446. https://www.mja.com.au/journal/2014/201/8/cancer‐health‐inequality‐persists‐regional‐and‐remote‐australia
- 10. Tervonen HE, Aranda S, Roder D, et al. Cancer survival disparities worsening by socio‐economic disadvantage over the last 3 decades in New South Wales, Australia. BMC Public Health 2017; 17: 691.
- 11. Patel MI, Ma Y, Mitchell B, Rhoads KF. How do differences in treatment impact racial and ethnic disparities in acute myeloid leukemia? Cancer Epidemiol Biomarkers Prev 2015; 24: 344–349.
- 12. Brunner AM, Blonquist TM, Sadrzadeh H, et al. Population‐based disparities in survival among patients with core‐binding factor acute myeloid leukemia: a SEER database analysis. Leuk Res 2014; 38: 773–780.
- 13. Yung RL, Chen K, Abel GA, et al. Cancer disparities in the context of Medicaid insurance: a comparison of survival for acute myeloid leukemia and Hodgkin’s lymphoma by Medicaid enrollment. Oncologist 2011; 16: 1082–1091.
- 14. National Cancer Intelligence Network. Outcomes in leukaemia: trends in five year survival between 1995 and 2003. 2010. http://www.ncin.org.uk/publications/data_briefings/outcomes_in_leukaemia_trends_in_five_year_survival_between_1995_and_2003 (viewed Apr 2021).
- 15. Australian Bureau of Statistics. 2033.0.55.001. Census of Population and Housing: Socio‐Economic Indexes for Areas (SEIFA), Australia, 2011. IRSAD. 28 Mar 2013. https://www.abs.gov.au/ausstats/abs@.nsf/Lookup/by%20Subject/2033.0.55.001~2011~Main%20Features~IRSAD~10004 (viewed Feb 2021).
- 16. Australian Department of Health. Measuring remoteness: Accessibility/Remoteness Index of Australia (ARIA), revised edition (Occasional paper, new series number 14). Updated 29 Oct 2001. https://www1.health.gov.au/internet/main/publishing.nsf/Content/health‐historicpubs‐hfsocc‐ocpanew14a.htm (viewed Feb 2021).
- 17. South Australian Cancer Registry. Epidemiology of cancer in South Australia. Incidence, mortality and survival, 1977 to 1996. Incidence and mortality, 1996. Adelaide: SACR, 1997.
- 18. Piccaluga PP, Paolini S, Martinelli G. Tyrosine kinase inhibitors for the treatment of Philadelphia chromosome‐positive adult acute lymphoblastic leukemia. Cancer 2007; 110: 1178–1186.
- 19. Cancer Council Victoria; Victorian Department of Health. Optimal care pathway for people with acute myeloid leukaemia; 2nd edition. June 2021. https://www.cancervic.org.au/downloads/health‐professionals/ocp/CC%20OCP%20AML%202021%202nd%20Ed.pdf (viewed Jan 2022).
- 20. Baden LB, Swaminathan S, Angarone M, et al. Prevention and treatment of cancer‐related infections, version 2.2016, NCCN Clinical Practice Guidelines in Oncology. J Natl Compr Canc Netw 2016; 14: 882–913.
- 21. Petridou ET, Sergentanis TN, Perlepe C, et al. Socioeconomic disparities in survival from childhood leukemia in the United States and globally: a meta‐analysis. Ann Oncol 2015; 26: 589–597.
- 22. National Cancer Intelligence Network. Deprivation and blood cancer survival in England: analysis of cancer registration data 2000–2007. 2013. http://www.ncin.org.uk/publications/data_briefings/deprivation_and_blood_cancer_survival_in_england (viewed Mar 2021).
- 23. Australian Institute of Health and Welfare. Cancer in Australia 2019 (Cat. no. CAN 123; Cancer series no.119). Canberra: AIHW, 2019. https://www.aihw.gov.au/getmedia/8c9fcf52‐0055‐41a0‐96d9‐f81b0feb98cf/aihw‐can‐123.pdf.aspx?inline=true (viewed Apr 2021).
- 24. Coory MD, Ho T, Jordan SJ. Australia is continuing to make progress against cancer, but the regional and remote disadvantage remains. Med J Aust 2013; 199: 605–608. https://www.mja.com.au/journal/2013/199/9/australia‐continuing‐make‐progress‐against‐cancer‐regional‐and‐remote
- 25. Afshar N, English DR, Blakely T, et al. Differences in cancer survival by area‐level socio‐economic disadvantage: a population‐based study using cancer registry data. PLoS One 2020; 15: e0228551.
- 26. Afshar N, English DR, Chamberlain JA, et al. Differences in cancer survival by remoteness of residence: an analysis of data from a population‐based cancer registry. Cancer Causes Control 2020; 31: 617–629.
Abstract
Objectives: To examine population changes in 5‐year survival for people in South Australia diagnosed with acute leukaemia during 1980–2016, by socio‐demographic characteristics.
Design, setting: Retrospective analysis of South Australian Cancer Registry data for the period 1980–2016.
Participants: All South Australian residents diagnosed with primary acute lymphoblastic leukaemia (ALL) or acute myeloid leukaemia (AML) during 1980–2016.
Main outcome measures: 5‐year disease‐specific survival and disease‐specific mortality.
Results: Crude 5‐year disease‐specific survival was 58% (95% CI, 54–61%) for the 1035 people diagnosed with ALL during 1980–2016, and 18% (95% CI, 17–20%) for the 2814 people diagnosed with AML. Survival improved steadily across the study period: from 44% (95% CI, 35–52%) for people with ALL diagnosed during 1980–1984 to 69% (95% CI, 63–75%) for those diagnosed during 2010–2016; and from 9% (95% CI, 5–15%) to 23% (95% CI, 20–26%) for people diagnosed with AML. Disease‐specific mortality increased with age, but was not influenced by socio‐economic status or remoteness of residence. After adjusting for other factors, rates of change in risk of leukaemia‐related death were greater for younger than older patients with ALL (for interaction: P = 0.004) or AML (P = 0.005), but were not significantly influenced by socio‐economic status or remoteness.
Conclusion: Five‐year survival for people with acute leukaemia in South Australia continuously improved during 1980–2016, and socio‐economic status and remoteness did not influence survival. It improved markedly for younger patients (under 50 years of age). However, survival is still relatively poor, especially for people over 50 years with AML.