


In Australia, as in other high-income countries, mortality rates from cancer have been decreasing since the 1990s.1 This is largely the result of declining smoking rates in men, combined with earlier diagnosis and better treatment across a range of cancer types for both men and women.2
Despite overall progress, disparities for defined groups can persist or even increase.3 Historically, a well known disparity in Australia has been the higher cancer death rates among the 6 million people (27% of the Australian population) who live in regional and remote areas (non-metropolitan cities and towns plus rural and remote localities).4 Our aim was to assess whether the disadvantage in cancer deaths rates among regional and remote Australians has reduced over the past decade (from 1 January 2001 to 31 December 2010).
The Australian Bureau of Statistics (ABS) provided data on cancer deaths and estimated resident populations by 5-year age groups and sex. The death data comprised numbers for all cancers combined, as well as for seven common causes of cancer death: lung cancer, colorectal cancer, breast cancer, prostate cancer, melanoma, oesophageal cancer and pancreatic cancer. A cancer death was defined as one for which the underlying cause of death was documented on the death certificate as cancer. Usual residence was classified as “metropolitan” or “regional and remote” based on the ABS Australian Standard Geographic Classification (ASGC).5 More specifically, “metropolitan” residence was defined as residence in one of the following cities: Sydney or Newcastle, New South Wales; Melbourne or Geelong, Victoria; Brisbane or Gold Coast, Queensland; Perth, Western Australia; Adelaide, South Australia; Hobart, Tasmania; Canberra, Australian Capital Territory and Darwin, Northern Territory. All remaining areas were categorised as “regional and remote”.
For men, the SMRs (comparing regional and remote areas with metropolitan areas) showed no evidence of improvement, from 1.08 in 1997–2000 to 1.11 in 2006–2010. For women, they increased from 1.01 in 1997–2000 to 1.07 in 2006–2010 (Box 1).
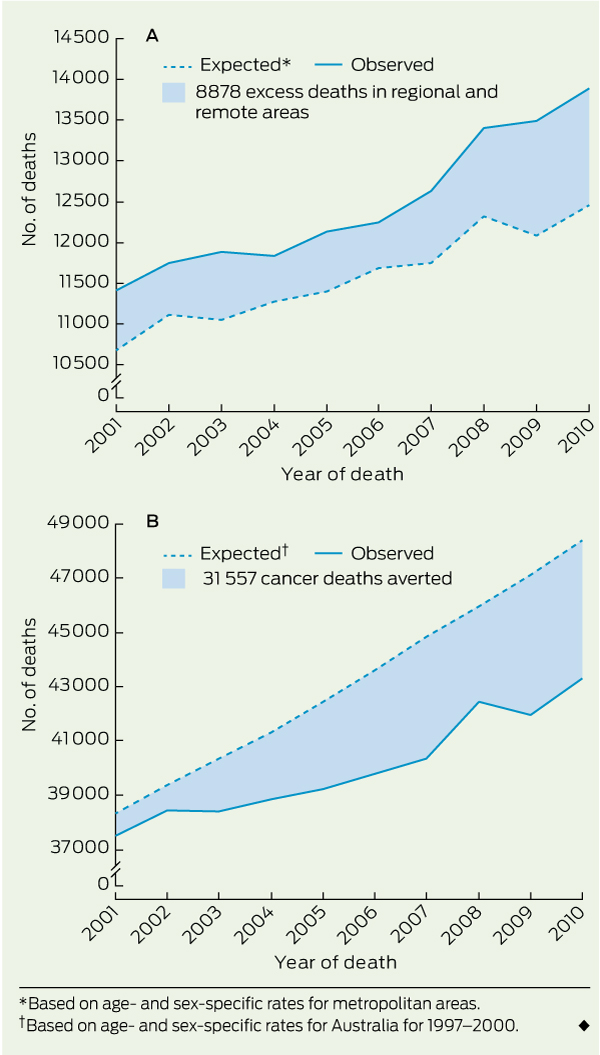
The number of excess cancer deaths in regional and remote areas between 2001 and 2010 was 6092 for men (95% CI, 5564–6622) and 2786 for women (95% CI, 2340–3234), giving a total of 8878 excess cancer deaths (95% CI, 8187–9572) (Box 2 A). The largest numbers of excess deaths were for cancers of the lung, prostate, oesophagus and colorectum, and melanoma (Box 1).
In the face of the continuing excess of deaths in regional and remote areas, progress against cancer is continuing across all of Australia, as a whole. The number of cancer deaths averted in Australia in the 10 years from 2001 to 2010 (based on age- and sex-specific death rates for 1997–2000), was 31 557 (95% CI, 30 315–32 796) (Box 2 B). More deaths were averted in men than in women because the number of lung cancer deaths among women actually increased over the 10 years (Box 3). This mainly reflects the later peak and later subsequent decline in smoking rates among women. Between 2001 and 2010, the APC in cancer deaths across all of Australia was − 1.0% (95% CI, 1.1% to − 0.9%), but the decrease was larger in metropolitan areas (− 1.1%; 95% CI, − 1.3% to − 1.0%) than in regional and remote areas (− 0.6%; 95% CI, − 0.8% to − 0.4%).
These can be divided into upstream and downstream factors.6-8 Upstream factors include higher proportions of Indigenous people and greater economic disadvantage associated with some regional and remote locations. Downstream factors include a higher prevalence of cancer risk factors, such as smoking, sun exposure and obesity, less cancer screening, delays in seeking medical attention or delays in diagnosis, higher prevalence of co-morbid conditions, and treatment disparities. Upstream factors mainly exert their effect on mortality through downstream factors, although they can also exert an independent effect; for example, Indigenous cancer patients might have specific difficulties in navigating the health system or in coming to terms with the risks and benefits of cancer treatment.9
Our analyses showed that there were 750 excess deaths due to colorectal cancer. Contributing factors could include less screening with faecal occult blood tests or colonoscopies, resulting in later diagnosis, or higher prevalence of risk factors such as obesity. A further factor could be that metropolitan patients are more likely to be treated in high-volume specialist centres, which have been shown both in Australia10 and overseas11,12 to reduce short-term and long-term mortality after complex cancer surgery. Differential rates of chemotherapy use might also play a role.13 Volume–outcome associations might also be contributing to the 842 excess deaths for oesophageal cancer.
We posit that at least part of the reason for the lack of progress is the lack of investment in research about the clinical effectiveness and cost-effectiveness of possible solutions to diagnosis and treatment disparities (health systems and policy research).14
Some will argue that before evaluating possible solutions, an understanding of all the interacting causes is needed. We disagree — enough is already known about the causes of the regional and remote excess to start evaluating possible solutions. More specifically, it is clear that an important proportion of the excess is the result of disparities in diagnosis and treatment.6-8 Further, if choices have to be made about how to allocate finite research funds, then research to evaluate possible solutions should be given priority over research to further unpack putative causes.
Possible solutions include more support for regional and remote patients to travel to metropolitan centres (and more funding for associated accommodation), managed referral pathways, various forms of specialist outreach (eg, telehealth, virtual multidisciplinary teams, shared care, “fly-in, fly-out” services) and building capacity in regional cancer centres.14
More investment in health systems and policy research is needed, because the currently available evidence that these possible solutions can produce health gains is thin.14 For example, the only evidence about the effectiveness of regional cancer centres shows that if capacity is increased, patients (who would have otherwise had to travel for treatment) receive treatment locally.7 This surrogate outcome does not provide convincing evidence about the effect of regional cancer centres on quality of life or survival, and we do not know whether regional cancer centres are a more cost-effective way of achieving health gains than, for example, increasing funding for patient travel and accommodation.
More generally, there is no evidence to guide public investment in solutions to diagnosis and treatment disparities, because we have underinvested in health systems and policy research15 (as have other countries16). Evidence synthesis and economic decision analysis are not possible because there is no evidence to synthetise. In 2010, the federal government announced an investment of $560 million over 5 years in regional cancer centres.17 This will hopefully result in significant health gains. However, an important contrast is that, for a new cancer pharmaceutical, convincing evidence is required of both comparative clinical effectiveness and comparative cost-effectiveness, before the pharmaceutical can be subsidised with taxpayer dollars. Hence, investment is needed, not only in actual evaluations of health systems and policy interventions, but also in the development of appropriate methods of evaluation.18
The regional and remote excess of cancer deaths has been recognised as a problem for at least two decades.19 Yet we have made little progress. Research to guide service planning and budget decisions is not as prestigious as laboratory and clinical research to identify and test innovative diagnostic tests and treatments for cancer. However, such research is needed if all of the Australian community are to benefit from laboratory and clinical advances.
1 Age-standardised mortality ratios (SMRs)* and excess number of cancer deaths† in regional and remote areas compared with metropolitan areas
2 Excess deaths in regional and remote areas, and cancer deaths averted in Australia overall, from 2001 to 2010
Received 12 January 2013, accepted 19 June 2013
- Michael D Coory1
- Tsun Ho2
- Susan J Jordan3
- 1 Health Services Research, Murdoch Childrens Research Institute, Melbourne, VIC.
- 2 Department of Health, Melbourne, VIC.
- 3 Population Health Department, Queensland Institute of Medical Research, Brisbane, QLD.
No relevant disclosures.
- 1. Australian Institute of Health and Welfare. Cancer in Australia 2010: an overview. Canberra: AIHW, 2010. (AIHW Cat. No. CAN 56; Cancer Series No. 60.) http://www.aihw.gov.au/publication-detail/?id=6442472459 (accessed Jun 2013).
- 2. Siegel R, Naishadham D, Jemal A. Cancer statistics, 2012. CA Cancer J Clin 2012; 62: 10-29.
- 3. King NB, Harper S, Young ME. Use of relative and absolute effect measures in reporting health inequalities: structured review. BMJ 2012; 345: e5774.
- 4. Australian Institute of Health and Welfare. Rural, regional and remote health: indicators of health system performance. Canberra: AIHW, 2008. (AIHW Cat. No. PHE 103.) http://www.aihw.gov.au/publication-detail/?id=6442468150 (accessed Jun 2013).
- 5. Australian Bureau of Statistics. Statistical geography volume 1. Australian Standard Geographic Classification (ASCG), Jul 2006. Canberra: ABS, 2006. (ABS Cat. No. 1216.0.) http://www.abs.gov.au/AUSSTATS/abs@.nsf/allprimarymainfeatures/BD1B52D132D130E7CA 2573630012F67B?opendocument (accessed Jun 2013).
- 6. Jong KE, Vale PJ, Armstrong BK. Rural inequalities in cancer care and outcome [editorial]. Med J Aust 2005; 182: 13-14. <MJA full text>
- 7. Underhill CR, Goldstein D, Grogan PB. Inequity in rural cancer survival in Australia is not an insurmountable problem [editorial]. Med J Aust 2006; 185: 479-480. <MJA full text>
- 8. Heathcote K, Armstrong B. Disparities in cancer outcomes in regional and rural Australia. Cancer Forum 2007; 31: 70-74. http://cancerforum.org. au/Issues/2007/July/Forum/Disparities_cancer_outcomes_regional_rural_Australia.htm (accessed Jun 2013).
- 9. Moore SP, O’Rourke PK, Mallitt KA, et al. Cancer incidence and mortality in Indigenous Australians in Queensland, 1997-2006. Med J Aust 2010; 193: 590-593. <MJA full text>
- 10. Cancer Institute New South Wales. New evidence reveals inexperience in complex cancer surgeries costs lives [media release]. 10 Sep 2012. http://www.cancerinstitute.org.au/news/i/new-evidence-reveals-inexperience-in-complex-cancer-surgeries-costs-lives (accessed Dec 2012).
- 11. Archampong D, Borowski D, Wille-Jørgensen P, Iversen LH. Workload and surgeon’s specialty for outcome after colorectal cancer surgery. Cochrane Database Syst Rev 2012; (3): CD005391.
- 12. Wouters MW, Gooiker GA, van Sandick JW, Tollenaar RA. The volume-outcome relation in the surgical treatment of esophageal cancer: a systematic review and meta-analysis. Cancer 2012; 118: 1754-1763.
- 13. Morris M, Platell C, Fritschi L, Iacopetta B. Failure to complete adjuvant chemotherapy is associated with adverse survival in stage III colon cancer patients. Br J Cancer 2007; 96: 701-707.
- 14. Adams P, Hardwick J, Embree V, et al. Literature review: models of cancer services for rural and remote communities. Sydney: Cancer Institute NSW, 2009. http://www.cancerinstitute.org.au/publications/i/literature-review-models-of-cancer-services-for-rural-and-remote-communities (accessed Jun 2013).
- 15. Smith-Merry J, Gillespie J, Leeder SR. A pathway to a stronger research culture in health policy. Aust New Zealand Health Policy 2007; 4: 19.
- 16. Pickstone JV. The rule of ignorance: a polemic on medicine, English health service policy, and history. BMJ 2011; 342: d997.
- 17. Department of Health and Ageing. Deliverying regional cancer centres [media release]. 7 Apr 2010. http://www.health.gov.au/internet/ministers/publishing.nsf/Content/mr-yr10-nr-nr059.htm (accessed Dec 2012).
- 18. Cartwright N. A philosopher’s view of the long road from RCTs to effectiveness. Lancet 2011; 377: 1400-1401.
- 19. Australian Institute of Health and Welfare, Australasian Association of Cancer Registries. Cancer survival in Australia 1992–1997: geographic categories and socioeconomic status. Canberra: AIHW, 2003. (AIHW Cat. No. CAN 17; Cancer Series No. 22.) http://www.aihw.gov.au/publication-detail/?id=6442467451 (accessed Jun 2013).
Abstract
Objective: To measure progress, over the past decade, in reducing the disadvantage in cancer death rates among people living in regional and remote areas of Australia.
Design: Analysis of routinely collected death certificate and corresponding population data from the Australian Bureau of Statistics.
Setting: Population-based, Australia-wide comparison of mortality rates in regional and remote areas compared with metropolitan areas from 1 January 2001 to 31 December 2010.
Main outcome measures: Absolute and relative excess of cancer deaths in regional and remote areas.
Results: The number of excess cancer deaths in regional and remote areas from 2001 to 2010 was 8878 (95% CI, 8187–9572). For men, the age-standardised mortality ratios (comparing regional and remote areas with metropolitan areas) showed no evidence of improvement, from 1.08 in 1997–2000 to 1.11 in 2006–2010. For women, they increased from 1.01 in 1997–2000 to 1.07 in 2006–2010. The age-standardised cancer death rate in regional and remote areas (annual percentage change [APC], − 0.6%; 95% CI, − 0.8% to − 0.4%) is decreasing more slowly than in metropolitan areas (APC, − 1.1%; 95% CI, − 1.3% to − 1.0%).
Conclusions: The regional and remote disadvantage for cancer deaths has been recognised as a problem for more than two decades, yet we have made little progress. This is not surprising — we have not invested in research into solutions. The benefits of laboratory and clinical research to identify innovative cancer treatments will not be fully realised across the entire Australian population unless we also invest in health systems and policy research.