


Within the space of just over a year Australia has experienced its worst bushfires in living memory, extensive and unprecedented flooding in the east, and an unprecedented tropical cyclone in the south‐west of the country. The impact of each of these on physical and mental health has been substantial and the full burden of disease is yet to be revealed.1,2,3 Despite Australia’s advanced health systems and services, and significant steps forward in its management of such natural disasters,4 it remains increasingly vulnerable to these climate extremes.5,6,7
At the climate summit hosted by United States President Joe Biden in April 2021, leaders of around 40 other countries showed that the rest of the world is ready to take action on mitigating climate change, setting targets for the coming decade as the pathway towards significantly reducing emissions. Yet, failing to keep step with the world’s other leading economies,8,9 Australia’s paltry emissions reduction commitment to reduce greenhouse gas emissions by 26–28% below 2005 levels by 2030 remains unchanged.10 Even if global emissions are rapidly reduced to try to stay below the Paris Agreement threshold of 2°C, the world is already well on the way to exceeding the lower target of 1.5°C. Australians, like the rest of the world, will be faced with a hotter and increasingly hostile climate in which to live and work. This report series examines how we are tracking in being prepared for the coming years and decades.
The 2021 MJA–Lancet Countdown report represents the work of seven Australian institutions in collaboration with University College London, brought together by an evolving partnership between The Lancet and The Medical Journal of Australia. The collaboration tracks the links between public health and climate change across five domains: climate change impacts, exposures and vulnerability; adaptation, planning and resilience for health; mitigation actions and health co‐benefits; economics and finance; and public and political engagement.
Following the devastating bushfires in Australia over the 2019–20 summer, our 2020 report7 focused on the relationship between health, climate change and bushfires, highlighting indicators that explored these linkages. For 2021, we return to reporting on the full suite of indicators across each of the five domains, as well as adding some new indicators.
Methods
We tracked progress on health and climate change in Australia across 37 indicators within the five broad domains. Where possible, we adopted the methods used by the Lancet Countdown, including those used in its 2021 report.11 Where more appropriate for an Australia‐focused assessment, or where it was possible to refine or improve on the original method as more precise and comprehensive data or methods were available at the national level, the method for the Australian indicators was modified or an alternative method was employed.
Consistent with developments in the Lancet Countdown reports of 2020 and 2021,11,12 four new indicators are introduced this year: Heat impact on physical and sporting activities (indicator 1.4); Urban green space (indicator 2.6); Diet and health co‐benefits (indicator 3.9); and Net value of fossil fuel subsidies and carbon prices (indicator 4.6). A further three new indicators are introduced this year that are unique to the MJA–Lancet Countdown and have been developed to address health and climate change issues of importance to Australia: Indigenous health and climate change (indicator 1.2); Bushfire adaptation (indicator 2.7); and Health and climate change research funding (indicator 5.4).
Full details of our methods, data and caveats are provided for each indicator in the Supporting Information and are numbered accordingly. We also provide a brief summary of the method within the text for each indicator here.
Section 1: Climate change impacts, exposures and vulnerability
We begin our assessment of health and climate change in Australia with an analysis of trends in climate‐related impacts on health, exposures to extremes of climate, and the vulnerability of Australians to these exposures and associated adverse impacts on their health.
We explore various facets of increasing heat including, for the first time, its impact on physical and sporting activities. We also examine indirect impacts such as mosquito‐borne diseases and population displacement due to weather‐related disaster. Importantly, we also introduce a new indicator on Indigenous health and climate change.
1.1 Vulnerability to extremes of heat
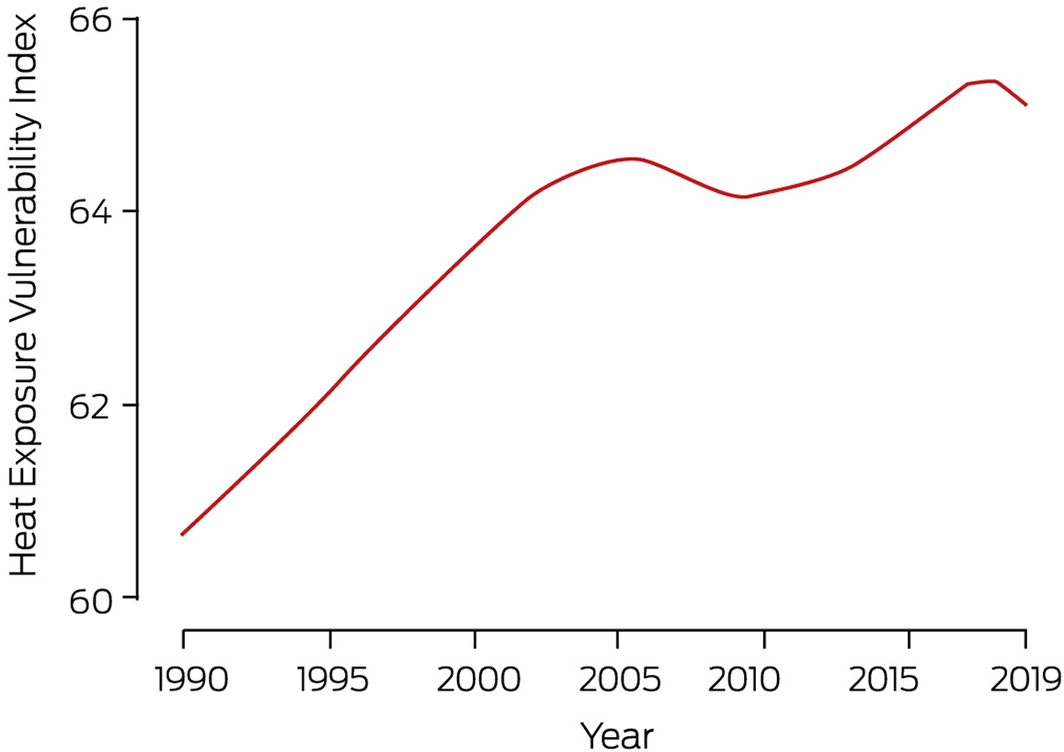
This indicator reports the Heat Exposure Vulnerability Index (HEVI) for Australia. The HEVI is a measure of potential vulnerability of a country to heat exposure and is based on the proportion of the population aged over 65 years, the prevalence of underlying diseases in this subpopulation, and the proportion of the population living in urban areas (Supporting Information 1.1). People older than 65 years and those with pre‐existing medical conditions are particularly vulnerable to the negative health impacts of exposure to extremes of heat, and those living in urban areas are particularly vulnerable because of the inherently higher temperatures in urban areas compared with adjacent areas, as a result of the urban heat island effect. This composite index ranges from 0 to 100, with higher scores representing greater vulnerability.
Although there was a slight decline in 2019, the HEVI for Australia over the period 1990–2019 is high and shows an upward trend (Box 1). In comparison to elsewhere, Australia’s HEVI far surpasses the global average and also the average for all World Health Organization (WHO) regions of the world.13
1.2 Indigenous health and climate change
Climate change is disproportionately harmful to Indigenous Australians.14 However, this can be difficult to quantify, being frequently constrained by many factors. The approach taken for this new indicator has been to extract the most climate‐relevant and sensitive indicators from each of three tiers (health status and outcomes; determinants of health; and health system performance) from the Australian Institute of Health and Welfare’s Aboriginal and Torres Strait Islander Health Performance Framework report15 (Box 2).
From tier 1, rates of cardiovascular and respiratory disease were chosen as they are linked to heat stress11 and indicative of physical stress from a changing climate. In 2018–19, the proportions of Indigenous Australians with a self‐reported cardiovascular or a long term respiratory condition were 16% and 29%, respectively.15 From tier 2 of the report,15 employment and housing were chosen as indicators of social determinants of health and resilience to climate change. In 2018–19, the employment rate for Indigenous Australians aged 15–64 years was 49% and, at this time, 18% of all Indigenous Australians were living in overcrowded households.15 From tier 3, the indicator of barriers to accessing health services was chosen because seeing a general practitioner is a preventive adaptive health strategy. In 2018–19, 30% of Indigenous Australians did not see a health care provider despite needing to do so (Supporting Information 1.2).15 These elevated levels of disease, unemployment and overcrowded housing, and lack of access to health care increase the vulnerability and decrease the adaptive capacity of Indigenous Australians to climate change health impacts.
1.3 Health effects of heatwaves
Multiple recent studies have demonstrated that heatwaves result in excess ambulance demand, hospital admissions and mortality in Australia.16,17 This indicator tracks change in a measure of heatwave intensity, the excess heat factor, as it applies to human health.18,19,20 The excess heat factor is based on unusually high 3‐day‐averaged daily mean temperatures in relation to the local long term climate and the recent past (Supporting Information 1.3). Box 3 shows the Australian average excess heat factor over the past 20 heatwave seasons (November–March). The data from each season were accumulated (ie, summed) over the season.
Calculating the trend through the 20 years presented (2001–2002 to 2020–2021), and a longer 50‐year trend (1971–1972 to 2020–2021), allows an assessment of medium and long term change, respectively (Box 3). The long term trend demonstrates a 36% increase in excess heat factor over the most recent 20‐year period, whereas the medium term trend shows a 103% rise over this period. This result reveals an accelerated rate of increase over the past 20 years. Weighting the accumulated excess heat factor according to the population density has a similar result, with the 50‐year and 20‐year heatwave season accumulated excess heat factor rises being 30% and 83%, respectively. These percentage changes are smaller than those reported in the 2020 MJA–Lancet Countdown report,7 in part because the 2020–21 summer was cooler than the 2019–20 summer. Impacts will continue to rise because of the general increase in ambient temperatures and will be especially large during and shortly after heatwave events.
1.4 Heat impact on physical and sporting activities
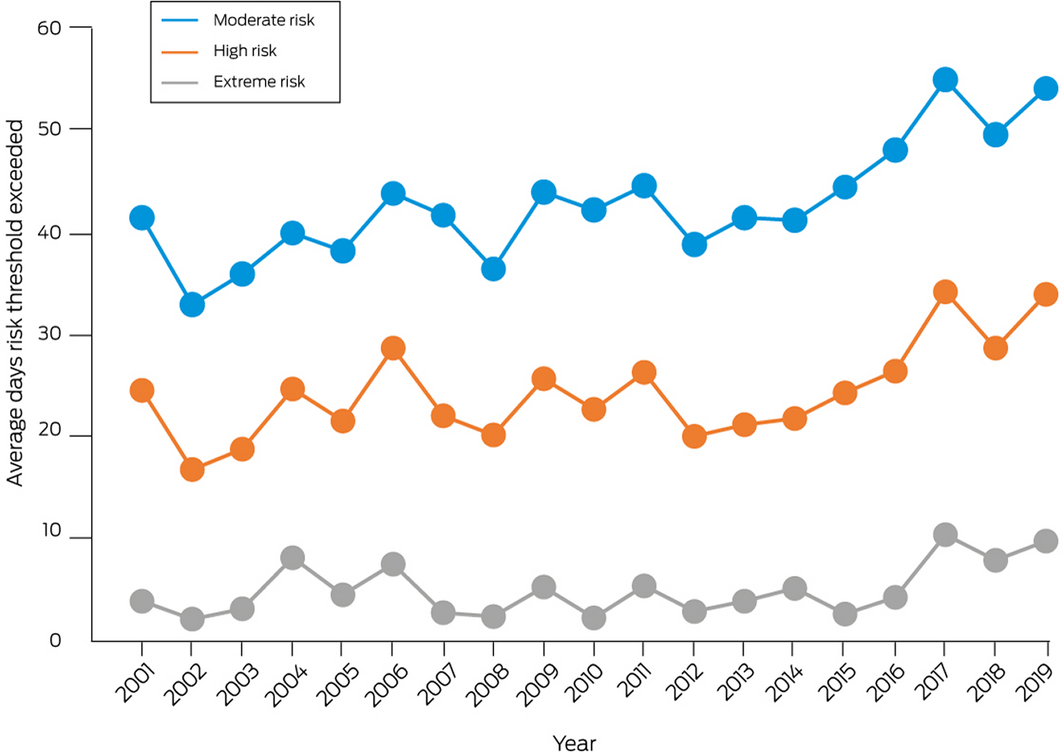
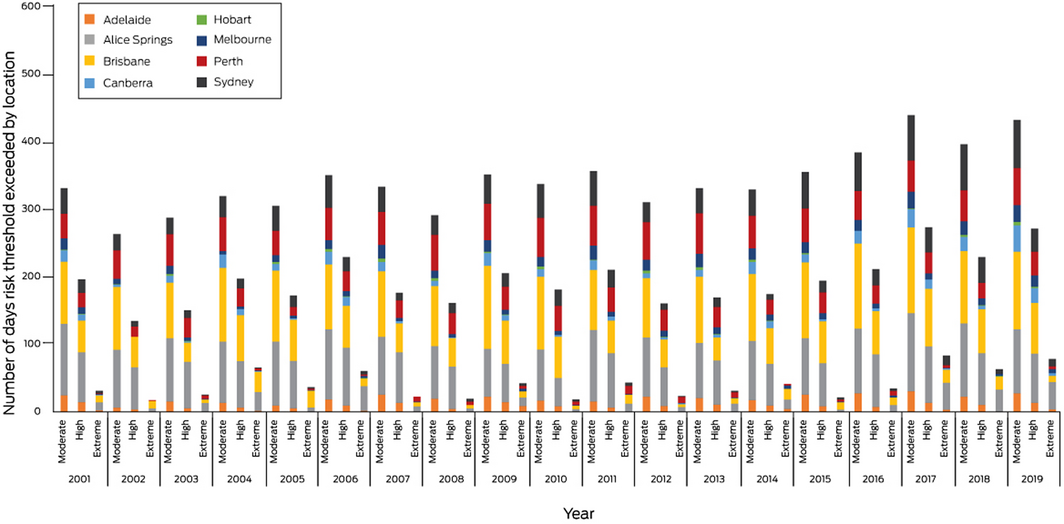
This indicator follows the estimated heat stress risk of people participating in physical and sporting activities across Australia and in large cities within each state and territory. As detailed in the Sports Medicine Australia Extreme Heat Policy, moderate risk indicates that additional rest breaks should be undertaken, a high risk requires the additional implementation of active cooling strategies (eg, water dousing), and an extreme risk indicates that activities should be suspended.21 The policy splits sports into five risk classification groups according to the combined effects of exercise intensity and clothing/equipment worn.21 This indicator focuses on the fourth risk group, which includes cricket, bushwalking, rugby and several other sports.
On average across Australia, weather conditions in 2019 led to the second greatest number of days that all three risk thresholds were exceeded since 2001 (Box 4). Relative to a 5‐year average (2001–2005), the number of days that activities would have been suspended due to extreme heat risk more than doubled in 2019, while activities became about 1.5 times more likely to have been interrupted due to moderate or high heat stress risk.
Brisbane (115 days) and Alice Springs (95 days) had the greatest number of days in 2019 that would have been disrupted due to moderate heat stress risk. Of the eight cities analysed, six had a greater number of days with activities likely suspended due to extreme heat in 2019 relative to the 5‐year average, with Alice Springs (41 v 13 days) and Sydney (11 v 2 days) showing the greatest relative increase (Box 5; Supporting Information 1.4).
1.5 Change in labour capacity
This indicator follows the impact of heat exposure on work productivity across the main industry sectors in Australia (service, construction, manufacturing and agriculture), expressed as the estimated work hours lost due to heat stress. Data are provided for these four industry sectors for where work is carried out in the shade, and for two of these sectors (agriculture and construction) for where work is carried out both in shade and in direct sunlight.
For work in the shade, 58 673 potential hours of work were lost due to heat stress across Australia in 2019, compared with a 10‐year average of 31 227 hours between 1991 and 2000. Work in the service sector represented the greatest share of these lost hours (41.0%), followed by construction (35.6%), manufacturing (13.1%) and agriculture (10.3%). For work in direct sunlight, the construction sector lost the most hours (67 565) in 2019 compared with a 1991–2000 average of 25 240 hours (Box 6). Shaded work hours lost in 2019 were greatest in New South Wales (18 239), followed by Queensland (17 521), Victoria (7552) and the Northern Territory (6931) (Supporting Information 1.5, Figure A1).
1.6 Cold‐ and heat‐related mortality
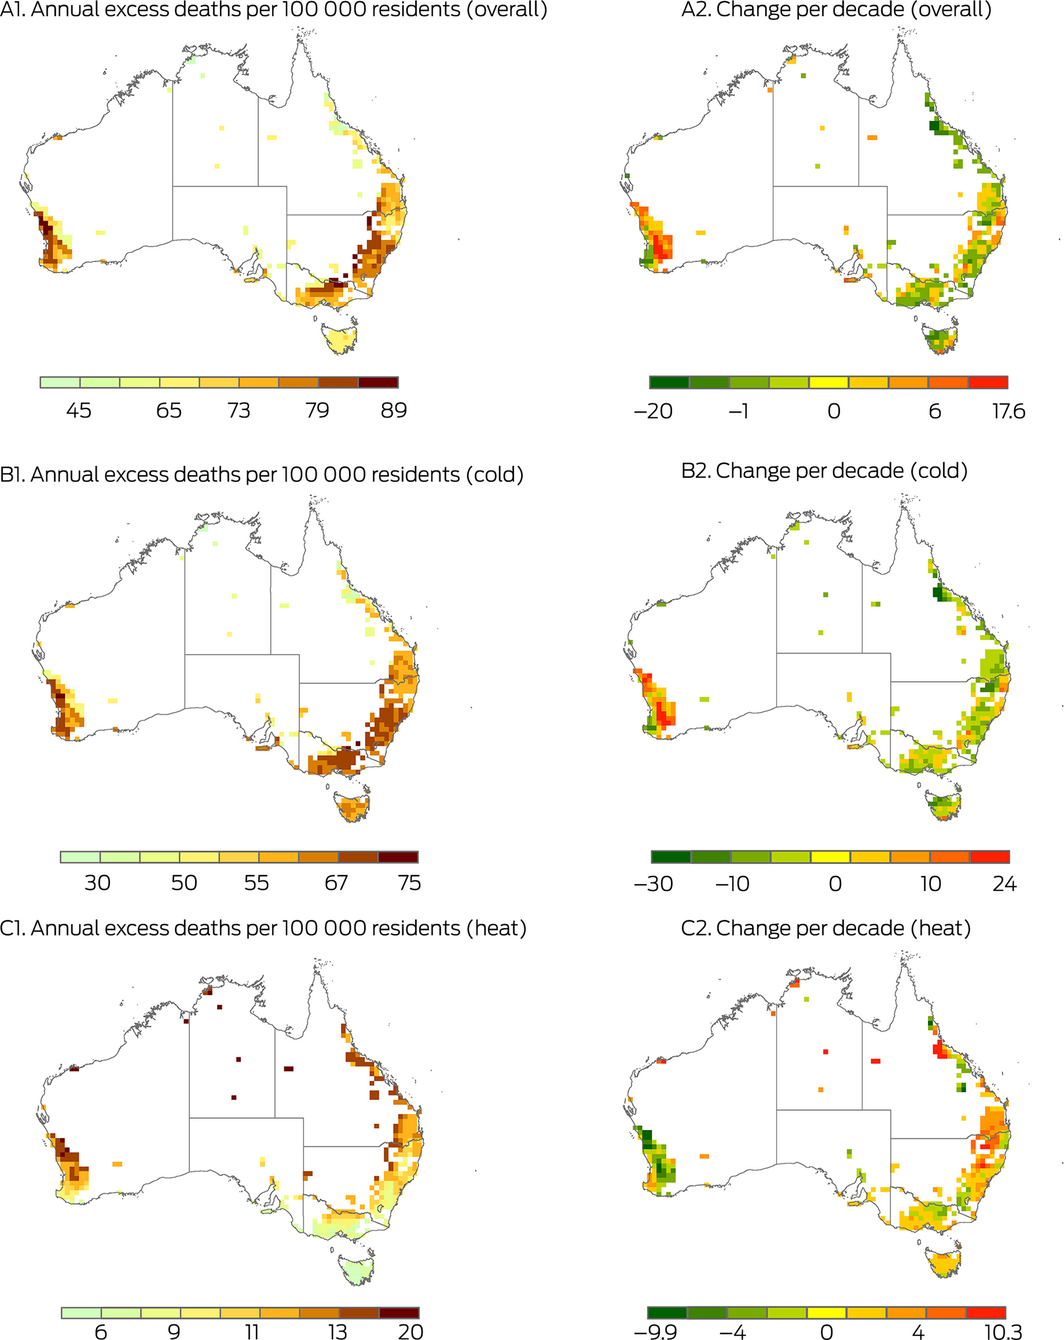
The association between non‐optimal temperatures and premature deaths has been frequently reported, with the strength of the relationship varying in different populations.22 However, the mortality burden attributable to non‐optimal temperatures across Australia has not been well quantified at the national level. This indicator shows that 11.40% (95% confidence interval [CI], 6.99–16.50%) of Australian deaths are associated with non‐optimal temperatures, equating to 74 excess deaths per 100 000 residents annually (Supporting Information, Table A1). There is great spatiotemporal variation of the mortality burden due to non‐optimal temperatures (Box 7; Supporting Information 1.6). Most excess deaths are currently explained by cold exposure (9.81%; 95% CI, 6.38–13.74%), but as shown in Box 7 (B2 and C2), in large parts of eastern Australia excess deaths due to cold are decreasing over time, and excess deaths due to heat are increasing over time.
1.7 Bushfires
Bushfires affect population health through the risks associated with firefighting and accidents, the mental trauma associated with proximity to a fire front and threats to life and property, and the widespread harm done by degraded air quality.23 While there is considerable inter‐annual variation in landscape fire activity in Australia,24 the widespread occurrence of extreme bushfire activity in the 2019–20 season was associated with many climate‐driven environmental conditions.25
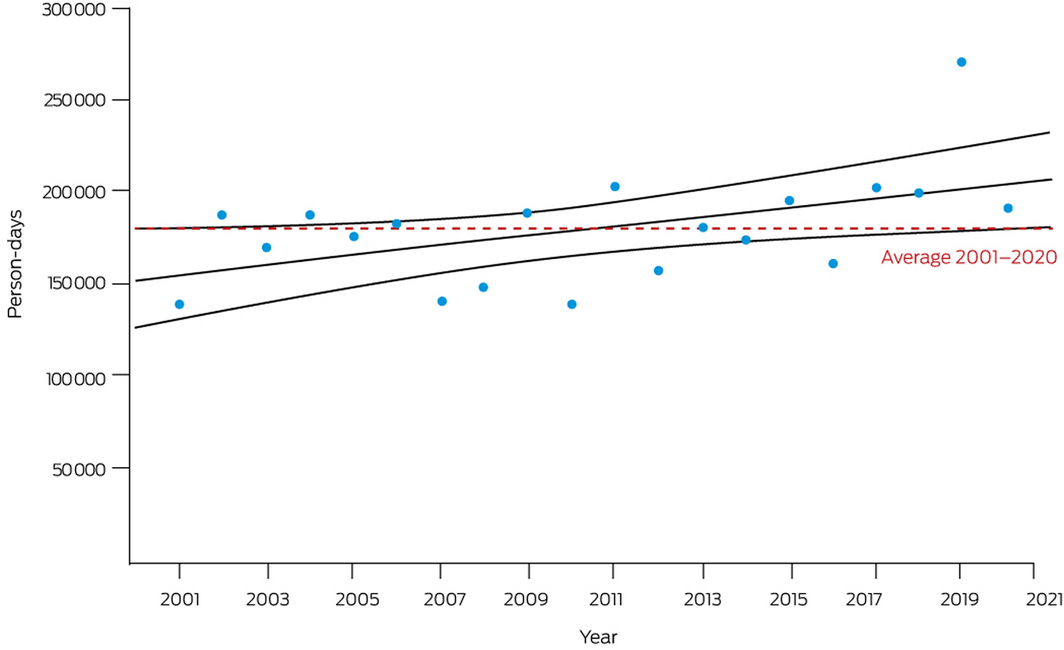
Estimated person‐days of exposure to landscape fire for 2020 were calculated from satellite‐observed active fire spots and population density data on a 10 km × 10 km grid. The 2020 calculation of 190 774 person‐days of exposure was lower than the 2019 peak of 270 997 but in keeping with a steady upward trend since 2001 (Box 8; Supporting Information, Table A2). Many factors likely contribute to this trend, including an increasing frequency of conditions favourable to bushfires, increasing use of planned burning to mitigate bushfire hazards (which is also captured in the satellite‐observed landscape fire data), and trends in population size and settlement patterns (Supporting Information 1.7).26
1.8 Health effects of drought
Droughts are periods of extreme dryness across entire landscapes with implications for wildfire, ground water, fresh water, agriculture and some large scale societal impacts such as desertification and rural exodus. The historical record shows that droughts have significantly threatened the resilience of communities in Australia.27,28 For this indicator of extent of meteorological drought, we use the standardised precipitation evapotranspiration index, based on precipitation and temperature. This indicator is also designed to measure excess occurrence of drought compared with a baseline climate (1950–2005). The indicator reports on annual average drought. A full explanation of the methodology and additional analysis are provided in Supporting Information 1.8. In 2019, 78% of Australian land surface experienced excess severe drought (Supporting Information, Figure A2). Such levels of excess drought were more than tenfold that of the historical baseline. Regions with particularly high excess severe drought levels in 2019 included large swathes of NSW, Victoria, Western Australia, central and northern Australia and southern Queensland (Supporting Information 1.8, Figure A3).
1.9 Migration, displacement and environmental change
While some populations can adapt in situ to climate change‐related drivers of migration and displacement, such as sea level rise (eg, through policy responses and building coastal barriers), some populations have to move from sites of risk. This indicator tracks: population exposure to sea level rise of 1 m and 5 m; and population displacement due to weather‐related disaster. In Australia, based on current population data, more than 160 000 people would be directly affected by a sea level rise of 1 m, and 1.7 million people by a sea level rise of 5 m.
In 2019, there were 25 000 people displaced by weather‐related disasters in Australia, primarily bushfires.29 In early 2020, bushfires triggered around 47 000 displacements in Australia,30 continuing an upward trajectory since 2008 (Box 9). Health outcomes of climate‐related mobility will depend on context; health threats may result from disruptions to food access, housing, social networks, attachment to place, and health service access (Supporting Information 1.9).31,32
1.10 Mosquito‐borne diseases
Mosquito‐borne diseases are strongly related to climate due to the sensitivity of mosquito vectors and disease pathogens to climate variables such as temperature, rainfall and humidity, which affect the transmission dynamics and geographic spread of these diseases. The two main mosquito‐borne illnesses in Australia are caused by dengue virus and Ross River virus. These respectively average 730 and 4650 cases annually, but there is considerable interannual variation in both (Box 10; Supporting Information, Figure A4). Figure A5 in the Supporting Information shows the seasonality of dengue and Ross River virus infection, each being higher following the warmer months.
There is an upward trend apparent in national annual dengue incidence (Supporting Information, Figure A6). This may arise from more frequent infections acquired overseas, from either increased passenger arrivals or more intense transmission overseas, or from a combination of both. This hypothesis is supported by the decline to near zero incidence in dengue virus and Ross River virus since international borders closed as a coronavirus disease 2019 (COVID‐19) response, while the climate remains suitable for transmission. Trends in Queensland suggest that although climate conditions are highly suitable for dengue, public health measures largely determine transmission, preventing dengue from becoming endemic. The climate in northern Australia, already suitable for high mosquito vector density and dengue transmission much of the year,33 may become even more favourable with climate change (increased temperature, humidity, rainfall), rendering future control potentially more difficult.
There has been a slight decline in Ross River virus cases over the past three decades (Supporting Information, Figure A7), although recent research suggests this is not a significant trend (Supporting Information 1.10).34
In conclusion, while most deaths from non‐optimal temperatures arise due to cold, increasing heat exposure remains a leading health risk in Australia. Heatwave intensity is growing exponentially, reducing productivity across all sectors of the economy and hampering sporting participation. Despite a cool summer and flooding rains in 2020–2021, the frequency and severity of bushfires and droughts have continued their upward trend.
Our indicators this year underscore the unpredictability of the effects of a warming climate and the increasingly critical importance of policy responses. First, governments must address temperature extremes, not just heat. Second, while the risk of disease vector spread continues to rise, policy interventions (especially in Queensland) have controlled it and we must learn from this. Third, climate change disproportionately threatens Indigenous Australians’ wellbeing due to substantial ongoing health inequities: this is a policy failure that must be addressed urgently.
Section 2: Adaptation, planning and resilience for health
A fundamental metric of a country’s preparedness for avoiding the worst of climate change would be a comprehensive assessment of the nation’s vulnerability and the likely impacts on the health and wellbeing of the population. Alongside this should be a detailed plan to manage the negative health consequences. Integral to such a plan are services and assets such as weather information, disaster and emergency response capacity, the quality of the built environment, and firefighting capacity; however, these can contribute to health protection even in the absence of an overall adaptation plan or strategy. This section monitors the extent to which Australia’s governments have incorporated such plans and measures to protect health from a changing climate.
2.1 Australian adaptation plans for health
There remains no national climate change adaptation plan for health for Australia. The framework for a national strategy on climate, health and wellbeing for Australia, produced by the non‐government organisation Climate and Health Alliance,35 that sets out a recommended approach to health adaptation, has not been adopted by the federal government.
Queensland and Victoria remain the only jurisdictions to have a specific health adaptation plan, as noted previously in the 2020 MJA–Lancet Countdown report.7 The Australian Capital Territory has health included in detail as part of its comprehensive adaptation strategy.36 Similarly, South Australia has climate change adaptation as part of its state public health plan.37 Following the Climate Health WA Inquiry, WA now has a blueprint for the next decade of its health system’s response to adapt to climate change to protect the health of the community and how health services can reduce emissions and waste.38 Tasmania held an expert roundtable in 2019 as a step towards developing its health adaptation plan.39 Based on our searches of public‐facing websites, NSW and the NT do not have climate change and health adaptation plans (Supporting Information 2.1).
2.2 National assessments of climate change impacts, vulnerability and adaptation for health
Non‐government organisations continue to do the bulk of the work in assessing the impacts of climate change on population health, vulnerability to these impacts, and associated adaptation strategies in Australia, particularly the Climate Council, a community‐funded, non‐profit organisation which provides information and advice to the Australian public on climate change (https://www.climatecouncil.org.au/about/). The Climate Council includes several of Australia’s leading climate change scholars and researchers, including those with health and medical expertise, making their reports scientifically credible and important contributions in this field.
New reports published by the Climate Council that have a substantial health component and were published since this indicator was last reported on in 2019 focus on sport participation in increasing temperatures,40 and health impacts from gas under a maladaptive “gas‐led recovery” which has been promoted by the federal government following COVID‐19.41
There is still no government report approaching a national climate change vulnerability and impacts assessment since the 2008 Garnaut Climate Change Review,42 which included a section on health. Climate data that can be used for such assessments have recently been updated via the release of the 2020 State of the Climate report by the Commonwealth Scientific and Industrial Research Organisation (CSIRO) and the Bureau of Meteorology (BOM) (Supporting Information 2.2).43
2.3 City‐level climate change risk assessments
In the 2018 MJA–Lancet Countdown report,5 it was noted that each capital city in Australia had some form of climate risk assessment or adaptation plan, at least as a mention in a state plan if not from the city councils themselves. In 2019, the City of Sydney declared a climate emergency and produced a new, brief report.44 Their Sustainable Sydney 2030: community strategic plan 2017–2021 is due for an update.45 Melbourne “refreshed” its previously noted 2009 Climate Change Adaptation Strategy in 2017.46 Hobart has updated its strategy,47 as has the ACT (which prominently mentions Canberra).36 Adelaide has no specific risk‐assessment, but climate change is mentioned in their 30‐year plan.48
There has been no update of plans for Darwin,49 Brisbane50 or Perth,51 with Perth still only having a basic strategy focused on “energy resilience”. These strategies were noted in our 2018 Countdown report.5
Local city councils continue to increase their engagement with climate change action through the Cities Power Partnership (Box 11), with a 15% increase in the number of participating councils nationally (from 120 in 2019 to 138 in 2020). Participation in the NT remains unchanged at 25% (two of eight) of councils, although this proportion remains higher than that of councils in Queensland, SA, Tasmania and WA (Supporting Information 2.3).
2.4 Climate information services for health
The BOM routine heatwave and ultraviolet radiation information services are available to the public and health sector on its website, mobile app, and other channels. Web traffic to the heatwave website (http://www.bom.gov.au/australia/heatwave) from 11 October 2019 to 30 March 2020, measured using Google Analytics, showed 188 531 unique views (an average of 1096 views/day), a reduction of 9% from the 2018–19 heatwave season (1201 views/day). This is consistent with the intensity of the 2019–20 heatwave season which, while extremely high, was slightly lower than the 20‐year peak that occurred in 2018–19 (see indicator 1.3 Health effects of heatwaves). Web traffic to the heatwave website during the 2020–21 heatwave season was much lower than the previous two seasons (133 770 unique views, 778 views/day), again reflective of the much cooler temperatures that season. Web visits peaked on days with record temperatures or heatwaves.
National smoke forecasts to assist Australian fire agencies with their planned burn decisions are being developed in collaboration with the CSIRO and fire agencies. These were used by state health authorities to help inform air quality advice to the community during the 2019–20 Black Summer bushfires.
The BOM, together with the Victorian Department of Health, the University of Melbourne and Deakin University, provides thunderstorm asthma forecasts in Victoria during its grass pollen season, October–December (Supporting Information 2.4).52
2.5 Detection, preparedness and response to health emergencies
The International Health Regulations (2005)53 (IHRs) are an instrument of international law to prevent, protect against, control and provide a public health response to potential public health emergencies and the international spread of infectious disease. With weather and climate causing or contributing to many public health emergencies and the spread of many infectious diseases, the IHRs serve as an important indicator of national climate change and health adaptive capacity. Countries report to the World Health Assembly on the implementation of the IHRs across 13 capacities. For this indicator, we track Australia’s reported implementation of the national health emergency framework capacity. We found that Australia achieved the top score of 100% for this capacity since it was introduced by the WHO in 2018 (Box 12). Limitations of the IHRs in ensuring an effective response to the COVID‐19 pandemic have been identified and continue to be evaluated and reviewed. However, countries with higher capacity scores were found to have lower incidence and mortality per 100 000 population within 30 days from first COVID‐19 diagnosis, stressing the relevance of the IHRs.54 For continuity with previous reports,6 we also report here Australia’s surveillance and public health human resources capacities. While the latter continues at 100%, the former has dropped below this level. We also highlight that Australia’s zoonotic events and the human–animal interface, and health service provision capacities have been below 100% over this period (Supporting Information 2.5).
2.6 Urban green space
Urban green space is an important component of climate change and health adaptation, acting to cool urban areas through shading and evapo‐transpiration. This indicator presents calculated levels of the Normalised Difference Vegetation Index (NDVI), reflecting the levels of greenness for all 27 Australian urban centres for the year 2020 (Box 13; Supporting Information, Table A3). The NDVI is a commonly used remote‐sensing derived vegetation index to measure vegetation quantity and health using the different amounts of light reflected and absorbed in the red and near‐infrared spectrum bands by chlorophyll. This ratio is normalised to – 1.0 to 1.0, with larger values indicating increasing quantities of denser and more robust vegetation.55 The NDVI varies across the year, generally reaching peak values in spring and summer, but this is dependent on local climate conditions and local vegetation types. Here, levels of NDVI below 0.40 were categorised as low, below 0.50 as moderate, and above 0.50 and 0.60 as high and very high, respectively. During peak seasons, most urban areas in Australia have moderate to high levels of greenness and somewhat reduced values of low to high greenness when using a four‐season average. However, these levels of greenness are not evenly distributed through the urban areas and the results suggest disproportionate access to greenspace in all the cities, reflecting a global trend often seen of lower levels of greenspace in less privileged areas.56 When using population‐weighted peak averages, measures of greenness in Australia decline to low to moderate levels across most areas and decline to very low in some areas when using a four‐season population‐weighted average.
In Table A4 in the Supporting Information, levels of greenness for the four metrics are broken down by percentage of population. Only 3% of Australians live in an area with very high peak greenness and 1% in very high average four‐season greenness; 82% live in areas with a high peak greenness and 66% in high average greenness. Weighted by population, this drops to 16% and 3% for peak and average greenness. For levels of moderate greenness, the percentages for the four metrics are 15%, 21%, 80% and 16%, respectively. When weighted by population, 78% of Australians live in areas of low greenness across four seasons, while 12% live with low greenness across an unweighted four‐seasons average (Supporting Information 2.6). In addition to the localised urban cooling that vegetation can provide, urban greenspace can provide areas to facilitate increased physical activity and social interactions, and help to reduce stress levels and exposure to air and noise pollution.57,58 This means that these benefits are not shared equally with those in less privileged areas.
2.7 Bushfire adaptation
As highlighted elsewhere in this report (eg, indicator 1.7 Bushfires) and in our 2020 report which focused on Australia’s 2019–20 Black Summer,7 bushfires are a major climate‐related extreme event with direct and indirect consequences for human health in Australia. Central to Australia’s bushfire adaptation will be the implementation of all of the recommendations in the Royal Commission into National Natural Disaster Arrangements report,4 some as a matter of urgency. For example, Australian federal, state and territory governments should: prioritise the implementation of harmonised data governance and national data standards; adopt nationally consistent terminology and functions for the different sheltering facilities, including evacuation centres, Neighbourhood Safer Places, places of last resort and natural disaster shelters; and urgently deliver and implement the all‐hazard Australian Warning System.4
To track progress on bushfire adaptation in Australia, our 2021 report introduces a new indicator that analyses aerial and terrestrial firefighting capacity (Box 14). Although National Aerial Firefighting Centre aircraft services have increased since 2007–08, from just over 30 to the current 160 or so, the number of volunteer firefighters and support staff has decreased in the most recent 3 years for which data are available (2016–17 to 2018–19) (Supporting Information 2.7).
In conclusion, adaptation planning in Australia continues to be piecemeal and delivered solely by (some) state, territory and local governments, with a marked leadership vacuum at federal level. Some state and territory plans are overdue for an update. Some government agencies (eg, the BOM) do provide useful monitoring of climate information, and Australia has a globally recognised high capacity to respond to acute disasters and emergencies yet lacks long term health adaptation planning to avoid or minimise events related to climate change. Few Australians are currently afforded the maximum possible protection from extreme heat offered by living in areas with very high greenness. While the number of firefighting aircraft has increased recently, volunteer firefighting capacity has diminished.
Section 3: Mitigation actions and health co‐benefits
While many world leaders are now planning on rapid decarbonisation and achieving net zero targets by the middle of the century, and despite every state and territory having a net zero target in place, Australia continues to lag in terms of policy targets and long term initiatives. Prime Minister Scott Morrison has signalled that the government would invest an additional $540 million into hydrogen and carbon capture and storage projects during the April 2021 climate summit hosted by US President Joe Biden.59 However, funding for these initiatives is limited compared with international efforts, and Australia’s focus continues to rest on support for fossil fuels (including gas), rather than a clean energy transition. While some positive signs of a transition to a cleaner energy future are emerging, progress is limited and occurring at a slow pace. This section monitors this progress across key sectors: energy, transport, agriculture, and health care. Linking mitigation back to health, it also reports on associated health co‐benefits related to air pollution and diet.
3.1 Carbon intensity of the energy system
As in our 2019 report, we define the carbon intensity of the energy system as “the tonnes of CO2 emitted for each unit of primary energy supplied”.6 Data used in our 2019 report were only available up to 2016.6 In 2021, new data have become available60 — up to 2019 for Australia, Brazil, Germany and the US, and up to 2018 for the People’s Republic of China and for India (Box 15). The new data for most countries show relatively little change from data we previously reported, except for a substantial reduction in the carbon intensity in Germany, which decreased from 55 to 52.3 tonnes of CO2 per terajoule of the total primary energy supply. As evident from Box 15, the carbon intensity of Australia’s total primary energy supply continues to be among the highest of the countries included in analysis, noting that China has only in recent years (2010 onwards) started to report values slightly higher than Australia. Global CO2 emissions saw a 5.8% decrease in 2020 due to the impacts of COVID‐19, which is not yet fully reflected in the available data for this indicator. However, emissions are projected to rebound with a 4.8% rise in 2021 (Supporting Information 3.1).61
3.2 Coal phase‐out
According to new data from the International Energy Agency (IEA),62 world coal production increased by 1.5% worldwide in 2019, continuing from earlier increases in 2017 and 2018 which we reported in the 2019 Countdown.6 Coal accounted for 27% of the world total energy supply in 2018, second behind oil, which accounted for 32%.63 These figures are largely unchanged from previous years. In terms of electricity production, the share of coal was higher (38%), while renewables and natural gas both accounted for 23% — again, largely unchanged from previous years.63
However, IEA data for 2020 show a sharp decline in coal demand (5% from 2019 levels).64 This drop can be attributed to decreased demand by power generation and various industrial sectors due to the impacts of COVID‐19. Whether or not the COVID‐19 impacts will have longer term impacts on coal phase‐out will have to be seen in future years; however, the disruptions in the Asia–Pacific market significantly impacted Indonesian and Australian producers, also due to lower imports of Australian coal by China.64
While full updated data are not yet available, data up to 2019 show that Australia has retained its position as one of the world’s largest net exporters of coal. Together, Australia and Indonesia accounted for 57% of world coal exports in 2019, with Australia’s share alone being 29% of world coal exports.63 Leading countries for production of coal are China (48% of global production), the US (11%), followed by Australia, Indonesia and India. Together, these five countries account for 80% of production of coal (Box 16).63
Domestically, coal and coal products continued to be used primarily for power generation. In 2018, 88% of Australia’s coal consumption was devoted to power generation, while the average was 81.5% for Organisation for Economic Co‐operation and Development countries (Supporting Information 3.2).65
3.3 Zero carbon emission electricity
In line with our 2019 report, renewable energy sources are defined as those that “produce energy from renewable sources in a sustainable manner (including bioenergy, geothermal energy, hydropower, ocean energy, solar energy and wind energy, but excluding nuclear power)”.6 Low carbon sources are defined as those that “have zero carbon or low carbon emissions at the point of energy production (ie, this excludes biomass, but includes nuclear and hydro)”.6 Data for this indicator are now available for 2018.66
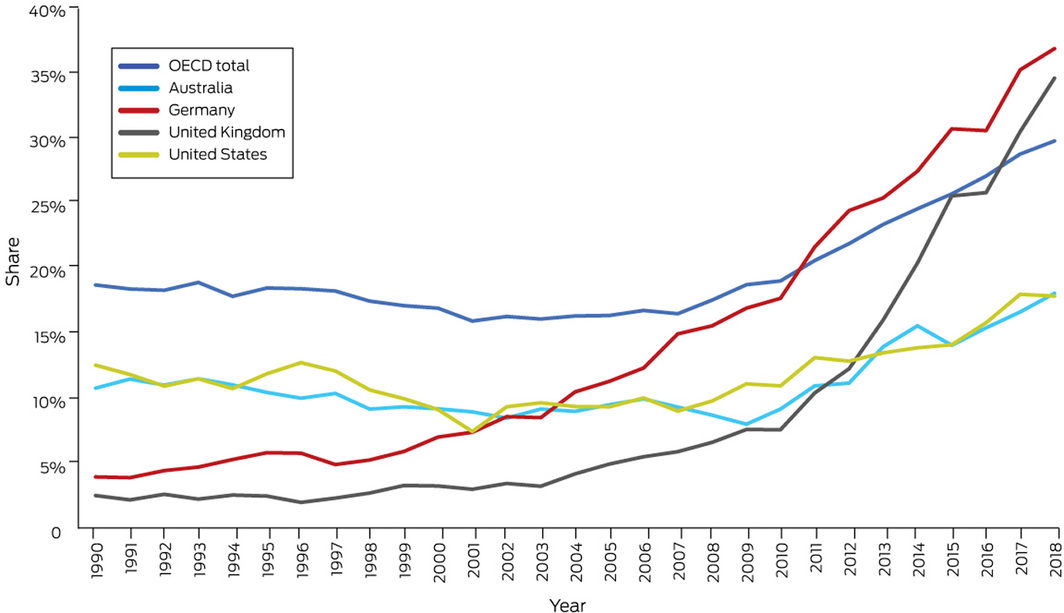
As can be seen from Box 17 and Box 18, countries such as Germany and the United Kingdom continue to be leading the adoption of renewable and low carbon energy sources. The recent German data show that the upward trend has continued in recent years, with renewables contributing to 37% of energy production in Germany.66 From 1990 to 2018, the share of electricity generation from renewable sources increased from 8% to 18%, and from 7% to 17% from low carbon sources in Australia.66 While some reports indicate renewable electricity generation might have been as high as 21–24% in 2019,67,68 Australia continues to have a much smaller proportion of electricity from low carbon sources compared with leading countries.
In 2020, about 36% of the renewable energy generated in Australia was powered by wind, while hydroelectric power contributed 23% (the figure was lower than previous years due to the ongoing impact of the drought in eastern Australia and substantial growth of wind and solar).68 We previously reported on Australia’s renewable energy target regulation (33 000 GWh for large scale generation by 2020 from wind and solar farms or hydroelectric power stations). The target was achieved in September 2019, a year ahead of schedule.69 There is no updated policy plan until the scheme ends in 2030 (Supporting Information 3.3).
3.4 Clean household energy
It was previously reported that Australia had 220 000 solar rooftop systems installed in 2018, a 26% increase on 2017.70 New data provided by the Clean Energy Council71 show that the number rose to 287 504 solar rooftop installations in 2019, and recent industry reports72 suggest that capacity installed between January and July 2020 surpassed the total capacity added in 2018.
However, despite such promising developments, Australia continues to lag behind other countries such as Germany and the UK (as reported in indicator 3.3 Zero carbon emission electricity). Evidence regarding improvements of access to renewable and low carbon sources for Australia’s remote and Indigenous communities continues to be sparse. Nevertheless, the Australian Government has pledged up to $50.4 million over 5 years from 2019–20 to 2023–24 to invest in regional and remote communities. This includes funds for microgrid technologies aimed at replacing, upgrading or supplementing existing energy supply infrastructures for off‐grid and fringe‐of‐grid communities, which might lead to improved energy solutions in remote areas (Supporting Information 3.4).73
3.5 Exposure to air pollution in cities
This indicator uses information on annual average background concentrations of fine particulate matter < 2.5 µm (PM2.5) air pollution in typical urban settings. Population‐weighted averages of PM2.5 modelled data for all major Australian cities were calculated. The major cities are defined as urban areas with greater than 100 000 population in 2016. In all major Australian cities, the annual average PM2.5 concentrations were generally below the WHO annual guideline of 10 mg/m3 and the Australian advisory reporting standard of 8 mg/m3 (Supporting Information, Table A5).
However, increasing evidence suggests there is no lower threshold of PM2.5 which eliminates impact on human health.74 PM2.5 pollution concentrations in these cities have varied over the years due to bushfires and dust storms. In the NT, ACT and Tasmania there is substantial seasonal variation due to the dry season in the NT75 and wood heaters in the cooler southern regions76 (Supporting Information 3.5, Figure A8).
3.6 Premature mortality from ambient air pollution by sector
Ambient PM2.5 air pollution causes premature mortality, lost life expectancy and substantial public health impacts. In a comprehensive study of Australian air pollution and mortality data for the years 2006–2016, it was estimated that 2616 (95% CI, 1712–3455) deaths were attributable to anthropogenic PM2.5 (equivalent to 2% of all deaths).77 There was a corresponding 0.2‐year (95% CI, 0.14–0.28) reduction in life expectancy for children aged 0–4 years and 38 962 (95% CI, 25 391–51 669) years of life lost.77 Another recent study, on the mortality effect of PM2.5 sources in the Greater Metropolitan Region of Sydney,78 found that ambient PM2.5 from wood heaters has a large mortality burden and that some sources with lower emissions (eg, motor vehicles) can have proportionally higher population exposures and associated mortality burden, due primarily to the proximity of the source to larger populations and the inclusion of secondary PM2.5 formed via atmospheric processes (Supporting Information 3.6).
3.7 Sustainable and healthy transport
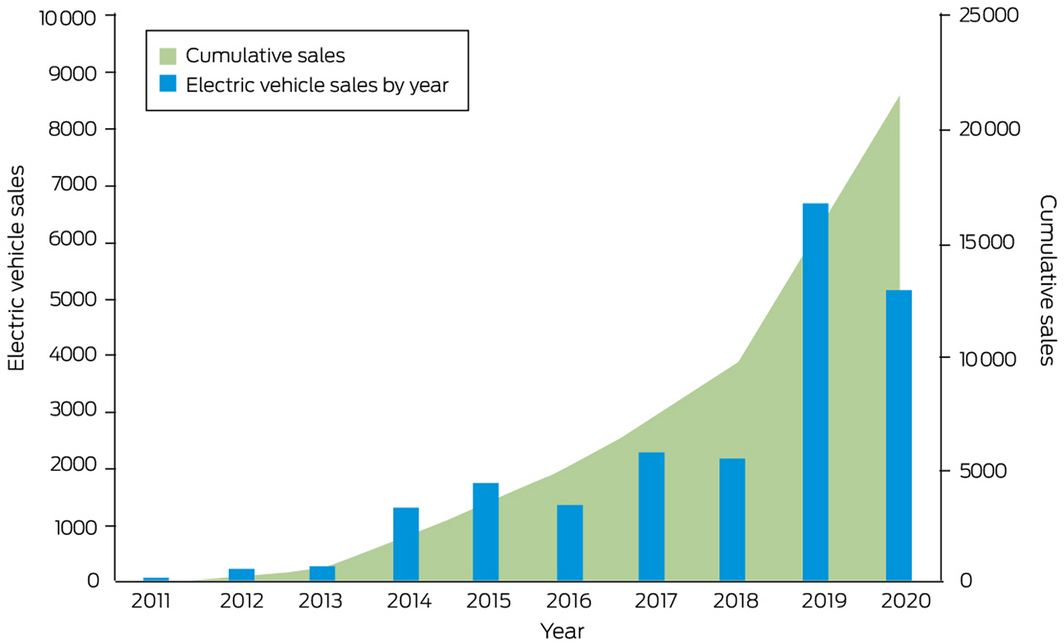
The transport system is the largest user of energy and the third largest source of greenhouse gas emissions in Australia.79,80 The transition to low and zero emission vehicles is an important priority to achieving a sustainable transport system and also delivering environmental and health co‐benefits. In recent years, Australia has presided over significant growth in transport fuel consumption, mostly in diesel use (Box 19), with fossil fuels continuing to hold the major share in the primary energy consumption.81 On a positive note, the use of electricity as a fuel increased steadily during the period 2010–2019 (Box 20), despite few policies or incentives supporting the uptake of electric vehicles, the higher upfront purchase price for electric vehicles, and the limited choice of vehicles.82 As can be seen from Box 20, the sale of electric vehicles in Australia peaked in 2019 with sales tripling from 2216 in 2018 to 6718 in 2019.83 Despite the current reliance on fossil‐fuelled transport in Australia, there are positive signs that with policies that promote clean fuels it is likely we will continue to see the upwards (not yet exponential) trend in electric vehicles in Australia. In addition to this transition to electric vehicles, decarbonisation of road transport will require increased walking, cycling and public transport use, and reduced travel such as by working from home (Supporting Information 3.7).84 Furthermore, increased walking and cycling for short trips would produce substantial health benefits from the increase in physical activity.85 Representing only 1.8% of all trips in urban areas, cycling rates in Australia are much lower than those in the Netherlands (26.8%), Japan (11.5%) and Germany (9.3%), so Australians have a lot to gain from the promotion of this mode of transport.86
3.8 Emissions from agricultural production and consumption
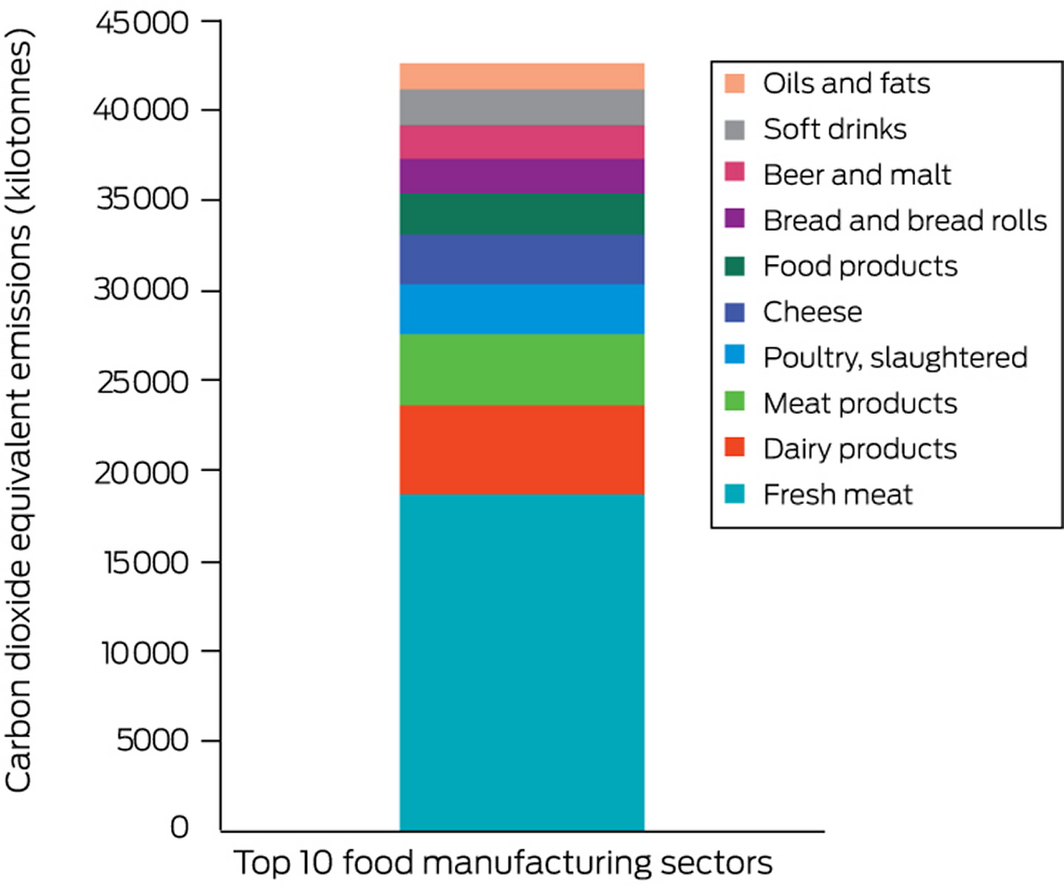
According to the National Greenhouse Gas Inventory,87 the production‐based emissions for agriculture in Australia were 75 588 kilotonnes in 2018. Using a consumption‐based approach, based on input–output analysis, the entire supply chain of primary agriculture and food consumption sectors was analysed. The assessment found that consumption‐based emissions in 2018 were 17 021 kilotonnes for primary agriculture sectors and 53 448 kilotonnes for food consumption. Primary agricultural sectors include sectors such as beef cattle, vegetables, fruits, dairy cattle, sheep and lambs. Food manufacturing sectors primarily encompass sectors that use primary agricultural products and transform those into products that are often consumed by humans; for example, fresh meat, dairy products, food and other meat products. Sectors that contribute to most of the footprint of the aggregated agricultural and food sectors are shown in Box 21 and Figure A9 in the Supporting Information, with beef cattle and fresh meat, respectively, being by far the largest contributors (Supporting Information 3.8).
3.9 Diet and health co‐benefits
New to the 2021 report, this indicator presents the change in deaths attributable to dietary risks and the consumption of excess red meat. Methods, data and results were provided by the Lancet Countdown.11 Between 2000 and 2017, all diet‐related deaths in Australia increased by 19%, from 30 771 to 36 606. Compared with other high income countries such as Germany (increased by 3%), the UK (dropped by 16%) and the US (increased by 17%), there is room for Australia to improve policies and practices to prevent mortality from unhealthy diet (Box 22). During the same time period, the number of deaths due to excess red meat consumption in Australia decreased by 8%, from 6742 deaths in 2000 to 6194 deaths in 2017, but there was a 13% increase from 5488 deaths in 2010 (Supporting Information 3.9, Figure A10). Decreases in the production of beef cattle (see indicator 3.8) and consumption of excess red meat would have the co‐benefits of reducing Australia’s greenhouse gas emissions and diet‐related deaths.
3.10 Mitigation in the health care sector
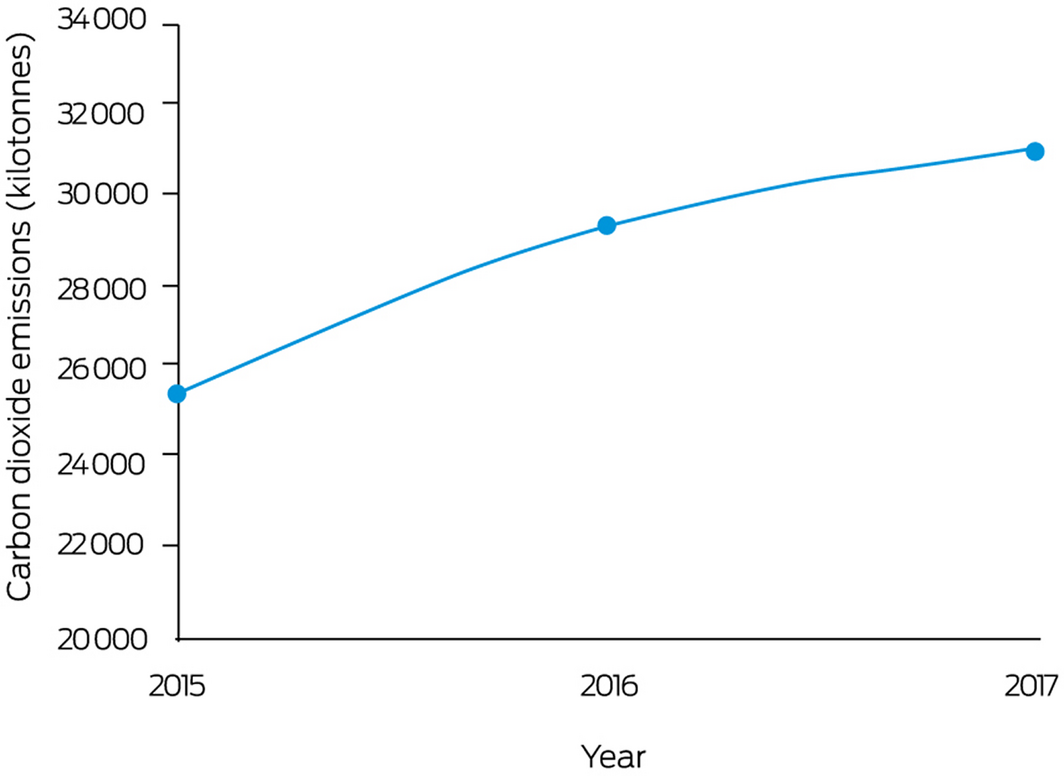
This indicator provides a quantitative assessment of the total (direct plus indirect) CO2‐equivalent emissions embodied in Australia’s health system. This indicator builds on previous work88,89 by constructing a time series of subnational multiregional tables from 2015 to 2017, featuring all Australian jurisdictions. As such, the findings presented in this indicator are based on different input–output databases from the ones used by previous studies in this space. The subnational tables are then integrated with data on health expenditure for about 15 unique health sectors, and the hybridised model is subjected to Leontief input–output calculations for assessing supply chain impacts of Australia’s health system over time. We observe that, over time, Australia’s health sector emissions have increased (Box 23). This rise in emissions is consistent with trends observed for the global health sector,90 due to rising expenditures. Australia’s health system accounts for about 5.5% of the country’s greenhouse gas emissions.89 Multiple studies assessing the environmental impacts of health systems identify hospitals, pharmaceuticals and medicinal goods as key contributors for the bulk of the emissions of the health system90,91 (Supporting Information 3.10).
In conclusion, updated data available in 2021 show that Australia has again slightly lowered the carbon intensity of its energy system through gradually shifting from coal towards lower carbon and renewable sources. However, Australia continues to lag behind other developed countries in its shift towards renewable energy. It should be noted that many nations have undertaken substantial investment into a green COVID‐19 recovery, which is likely to widen the gap between Australia’s carbon intensity and that of other countries in the future.92
Section 4: Economics and finance
This section focuses on the economic cost of climate change and examines financial mechanisms that have been implemented to protect human health from the impacts of climate change. We consider the cost of mortality related to heat. We also report recent economic efforts to decarbonise the electricity sector and mitigate carbon emissions for the Australian economy. In particular, we report on indicators that measure investment in renewable generation and energy efficiency, employment in low carbon and high carbon industries, funds divested from fossil fuels, as well as recent developments on fossil fuel subsidies and carbon pricing.
4.1 Costs of heat‐related mortality
This indicator tracks the economic cost of heat‐related mortality for Australia. As illustrated in indicator 1.6 (Supporting Information 1.6), the annual heat‐related mortality burden in Australia for the 2000–2019 period is estimated to be about 2300 excess deaths. People over the age of 65 years exhibit disproportionately larger increases in mortality during heatwaves than younger individuals.93 Semenza and colleagues94 found that the median age of people suffering from heat‐related death was 76 years during the 1995 heatwave in Chicago, while Herbst and colleagues95 suggested a mean age of about 70 years for heat‐related deaths in Adelaide during the 2009 heatwave. In the following discussion, we assume an average age of 73 years for people suffering from heat‐related mortality in Australia. Based on medium mortality rates used by the Australian Bureau of Statistics,96 the average remaining number of years expected before death for a person aged 73 is about 15 years. Applying an economic value of a statistical life‐year of $197 000 for 2020,97 the annual cost from heat‐related mortality for Australia is estimated to be around $6.8 billion or about 0.5% of Australia’s 2020 nominal gross domestic product (Supporting Information 4.1).
4.2 Investment in new coal capacity
This indicator reports the investment in new coal generation capacity. According to the latest report of the Australian Energy Regulator (AER)98 and the Australian Energy Market Operator (AEMO),99 currently there is no planned investment in new coal‐fired generation, while since 2012–13, over 4000 MW of black and brown coal generation assets have been removed from the market (Box 24). Further major retirements of coal‐fired generation have been scheduled. The closure of these plants has significantly reduced the capacity of dispatchable generation in the Australian National Electricity Market (NEM), and the AEMO has emphasised the risk of potential power outages during the summer months (Supporting Information 4.2). Indicator 4.3 illustrates the significant investment in renewable generation since 2017 that has helped to replace coal‐fired generation, while indicator 4.5 provides further information on the additional divestment from coal‐fired generation in the future.
4.3 Investments in zero carbon energy and energy efficiency
This indicator reports investment in renewable zero carbon energy based on generation capacity in the NEM. According to the most recent report by the AER,98 between June 2017 and March 2020, 6650 MW of new wind (47%) and solar (53%) generation capacity were added to the NEM. For the same period also over 200 MW of battery storage were added to the market, further increasing the efficiency of the NEM. Box 24 illustrates that most of this investment in renewable generation capacity and efficiency occurred between 2017 and 2020. In April 2020, there were also over 3300 MW of additional capacity from renewable energy committed to come online by the end of 2021, mainly in the two major markets in NSW (1300 MW, 39%) and Victoria (1734 MW, 52%). Moreover, there have been over 50 000 MW of additional capacity from solar, wind, hydroelectric and battery sources proposed but not yet formally committed (Supporting Information 4.3).98
4.4 Employment in low carbon and high carbon industries
This indicator suggests that direct full‐time equivalent (FTE) employment in renewable energy activities in Australia has increased by 27% for the 2018–19 financial year and is now estimated at 26 850.100 Box 25 illustrates that employment in the sector has risen by over 130% since 2015–16. The highest growth rates in FTE employment for 2018–19 are reported for Victoria (72%), followed by SA (41%) and NSW (25%). The rise in employment was driven by an increase in construction activity for rooftop solar photovoltaic systems (+ 2880 FTE jobs), large scale solar photovoltaic systems (+ 1600 FTE jobs) and wind farms (+ 1220 FTE jobs).100
Employment in the mining sector was chosen as a key representative for employment in high carbon industries. FTE employment in mining operations has increased by 6.2% to 179 000 for the 2018–19 financial year.101 The figures also indicate that FTE employment in the mining sector in Australia is still more than six times higher than FTE employment in renewable energy activities (Supporting Information 4.4).
4.5 Funds divested from fossil fuels
Fossil fuel divestment aims to encourage institutions and investors to divest themselves of assets involved in the extraction of fossil fuels and generation of energy from fossil fuels. We provide two measures tracking Australia’s divestment from fossil fuels.
The first measure relates to the number of companies and government organisations which have partially or entirely committed to divest themselves of assets involved in the extraction of fossil fuels and generation of energy from fossil fuels. Based on recent data from Fossil Free,102 the number of divesting institutions in Australia has further increased by almost 40% since 2018 and is now greater than 200, including over 100 pension funds.
The second measure tracks the withdrawal of generation capacity from coal‐fired power plants for electricity generation. Indicator 4.2 illustrates that a significant share of fossil fuel‐fired generation assets has been removed from the market. Recent reports by the AER98 and AEMO99 also point towards the shutdown of additional coal‐fired power plants. AGL plans to progressively retire its Liddell power station (2000 MW) starting from 2022, while around two‐thirds of total coal‐fired generating capacity has been announced for closure until 2035 (Supporting Information 4.5).
4.6 Net value of fossil fuel subsidies and carbon prices
Australia does not currently have an explicit carbon price, although it does have a range of subsidies on fossil fuel production and consumption.103,104,105 This new indicator calculates the subsidy per tonne of CO2 and the carbon price per tonne of CO2 (and the net carbon price). Using the standard data sources for the most recent available year of 2018, Australia’s total fossil fuel subsidies were reported to be $8650 million,106 and total carbon price revenues were reported to be zero.107 The total emissions of CO2 were reported to be 376 megatonnes of CO2.87 The calculation of the subsidy per tonne of CO2 (subsidy/emissions) therefore equals $23 per tonne of CO2, with a carbon price per tonne of CO2 of zero. The net carbon price (the carbon price less the subsidy) equals $–23 per tonne of CO2.
The above reported subsidy is likely to be conservative. A compilation of national tax‐based subsidies of fossil fuel production and consumption from Treasury data by Market Forces suggests a subsidy of around $11 billion for the 2017–18 financial year (Supporting Information 4.6).108
In conclusion, this section has highlighted the economic cost of climate change based on heat‐related mortality, as well as efforts aimed at reducing carbon emissions for the Australian economy to limit the impacts of climatic change on human health. The indicators evidence the continuing transition of the electricity sector towards a higher share of renewable energy generation. They also suggest a substantial increase of employment in renewable energy activities and significant growth in the number of institutions divesting from fossil fuels. However, Australia has still not introduced a price on carbon, although it does have a range of subsidies on fossil fuel production and consumption.
Section 5: Public and political engagement
This section tracks engagement in health and climate change across multiple parts of society, including governments, media, researchers and research funders. Some of the methods used for these indicators in previous reports have been enhanced this year, increasing the sensitivity and specificity of measures of health and climate change engagement. In 2020, media and scientific publications were awash with reports about the COVID‐19 pandemic and efforts to control its spread. The pandemic also dominated the work of Australian parliaments and government departments.
5.1 Media coverage of health and climate change
This indicator continues to track the national media coverage of health and climate change in Australia. We used the same methods as we did in our 2020 report,7 including searches of 13 national and regional high circulation English language newspapers, as well as Australian Broadcasting Corporation (ABC) online news and programs. We found that the total number of newspaper articles on health and climate change in 2020 (124) was similar to that in 2019 (127) (Supporting Information, Figure A11). However, the ABC online contents on health and climate change in 2020 has decreased 36% compared with the previous year (Supporting Information, Figure A12). Bushfire (21%) and extreme heat (14%) were the top discussed climate‐related health risks. Coverage peaked in the 2019–20 Black Summer. The number of articles that mentioned mitigation measures (eg, renewable energies) was almost four times higher than the number of articles that mentioned adaptation strategies (Supporting Information 5.1).
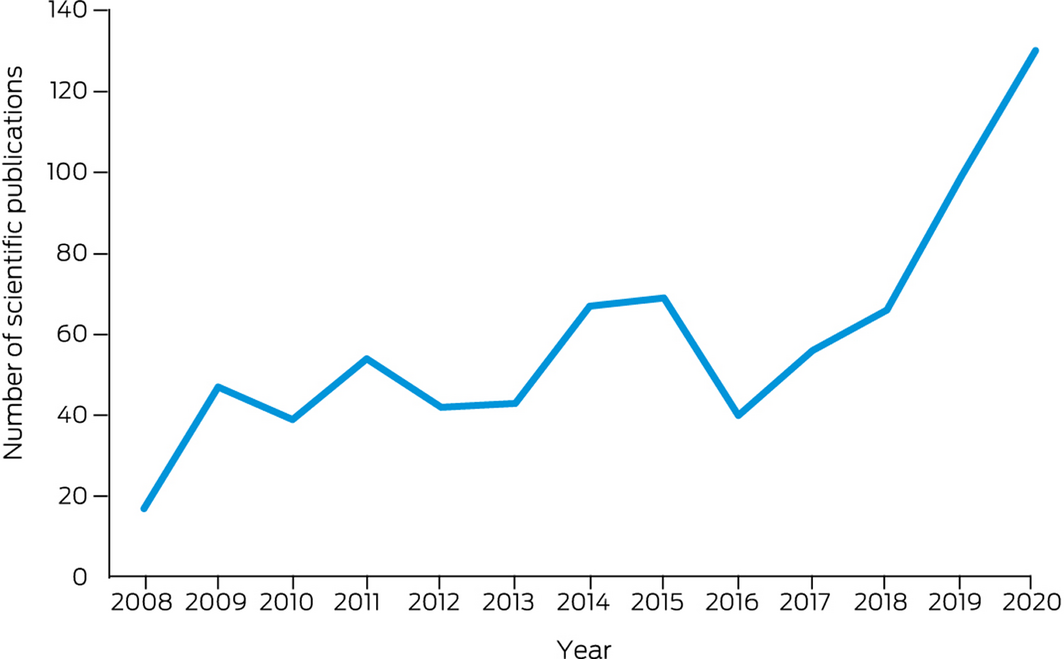
5.2 Coverage of health and climate change in scientific journals
This indicator continues to track scientific publications on health and climate change in Australia. We adopted the same methods as we did in our 2020 report, using Scopus databases.7 We identified 130 new scientific publications in 2020, a 31% increase from 2019 (99). This is largely due to the significant increase in the studies on bushfires/smoke and health. Original research articles accounted for 58% of the total publications in 2020 (76 of 130 publications). The number of publications on health and climate change has increased 6.6 times between 2008 and 2020 (Box 26; Supporting Information 5.2).
5.3 Government engagement in health and climate change in Australia
Parliamentary and government websites were searched for bills, legislation, enquiries, committees, strategies and reports to identify whether and how Australian governments were responding to climate change as a health issue, and/or whether health was identified as an issue affected by climate change. The searched websites included those of the Parliament of Australia, the Australian Government Department of Health, as well as the Parliamentary websites and government pages of all eight states and territories. This is the first time that state and territory governments have been included as part of this indicator.
At the national Parliament level, six bills included some reference to climate change and health. One health‐related bill — the Recycling and Waste Reduction Bill 2020 — explicitly referred to reducing greenhouse gases within the objects of the legislation. Two climate‐related bills — the Climate Change (National Framework for Adaptation and Mitigation) Bill 2020 and the Climate Emergency Declaration Bill 2020 — explicitly referenced health within the legislation. Another three — the Climate Change (National Framework for Adaptation and Mitigation) (Consequential and Transitional Provisions) Bill 2020, the Coronavirus Economic Support and Recovery (No‐one Left Behind) Bill 2020, and the Farm Household Support Amendment (Relief Measures) Bill (No. 1) 2020 — referenced health within their respective explanatory memoranda in the context of health as a human right and as a justification for the bill. Of these six bills, two were passed, one was not passed and three remained before Parliament (Supporting Information, Tables A6 and A7).
In 2020, there was minimal engagement with climate change as a health issue by the Australian Government Department of Health. In the two relevant environmental health documents identified (disaster and emergency management report, and bushfire smoke and health evidence summary),109,110 only the former mentioned (briefly in the introduction) that climate change contributed to disasters such as bushfires, floods and cyclones.
There was, however, significantly greater engagement with climate change as a health issue by state and territory governments (Supporting Information, Table A8). For example, SA had seven regional plans referring to climate and health, one summer cooling guide, one set of guidelines for urban development, and one public health review. WA had two bills, one inquiry report, one policy, and one issue paper; Tasmania had two reports (with one round table on climate health). NSW had one inquiry and one bushfire awareness guide, and Queensland released an action plan on climate change and health (Supporting Information 5.3).
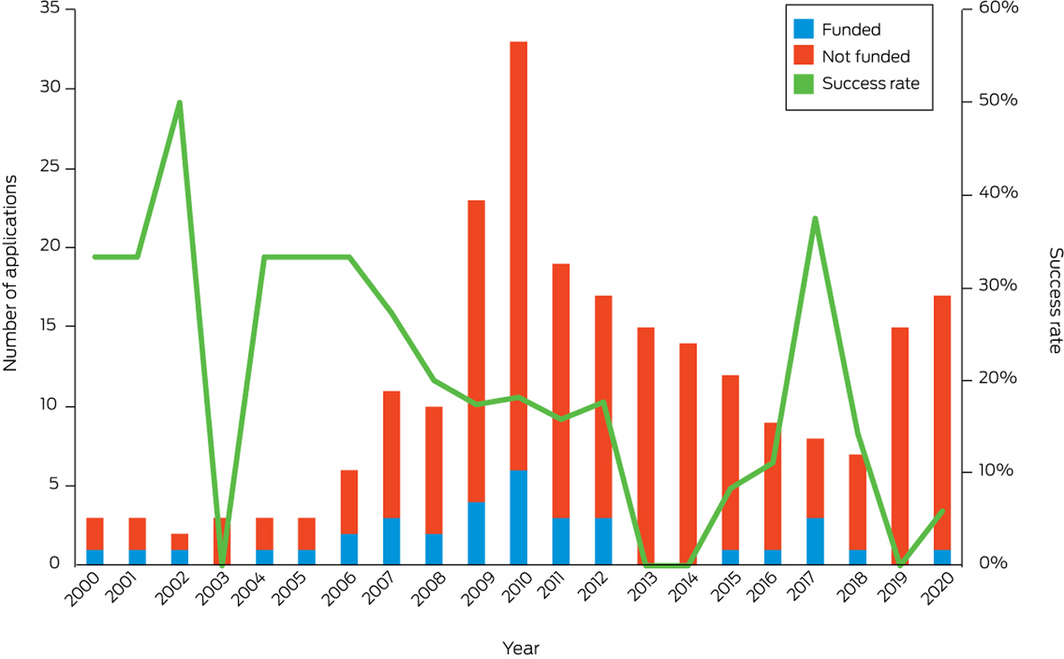
5.4 Health and climate change research funding
Research into health and climate change in Australia is fundamental to Australia’s understanding of and response to this critical issue. In our previous report7 we presented, for the first time, data on National Health and Medical Research Council (NHMRC) health and climate change grant applications from 2000 to 2018. This year we introduce this as an independent indicator and report on the two most recent years, 2019 and 2020, for which data are now available (Box 27). These two years saw a reversal of the downward trend in health and climate change grant applications, with 15 in 2019 and 17 in 2020. However, the success rate was very poor, with none of the applications being funded in 2019 and only one of the 17 funded in 2020. The 5‐year, $10 million NHMRC Special Initiative in Human Health and Environmental Change,111 for which applications opened in November 2020, is a landmark in research funding in this field and is expected to boost research capacity and capability across the country in the coming years (Supporting Information 5.4).
In conclusion, public and political engagement is essential for action to curb carbon emissions and limit global warming. The indicators tracked in this section show that Australian media attention to health and climate change in 2020 was sustained at a comparable level to 2019 despite the strong media focus on the COVID‐19 pandemic during 2020. While the states and territories are engaging with health and climate change, the Australian Government has paid minimal attention. The NHMRC Special Initiative on Human Health and Environmental Change is a notable positive exception at the national level.
Conclusion: the MJA–Lancet Countdown in 2021
The continued absence of a national health and climate change adaptation plan is a glaring gap in Australia’s preparedness, and continues to put the health and lives of Australians at risk. There is a stark contrast between Australia’s world‐leading COVID‐19 response and its world‐lagging climate change response.
With a change in the US Government, and countries such as Japan and South Korea and major trading partners enacting climate change strategies, Australia is becoming isolated due to its inaction.
As the rest of the world moves ahead, the relative advantages Australia has now will be lost with stranded assets like coal and poor preparedness for the worsening health impacts.
Australia now stands at a crossroads and has an opportunity to set a course redirection in both its continued COVID‐19 economic recovery and its climate change response. The 26th UN Climate Change Conference of the Parties (COP26) in early November 2021 should be the moment to showcase a much stronger emissions reduction commitment and clear transition away from fossil fuels towards renewable energy — the strategies for which could support the COVID‐19 economic recovery through government support of the renewable energy sector.
Box 2 – Proportion of Indigenous Australians with a self‐reported cardiovascular* or long term respiratory condition, aged 15–64 years and employed, living in housing considered overcrowded, and not seeing a health care provider despite needing to do so, 2002–03 to 2018–19
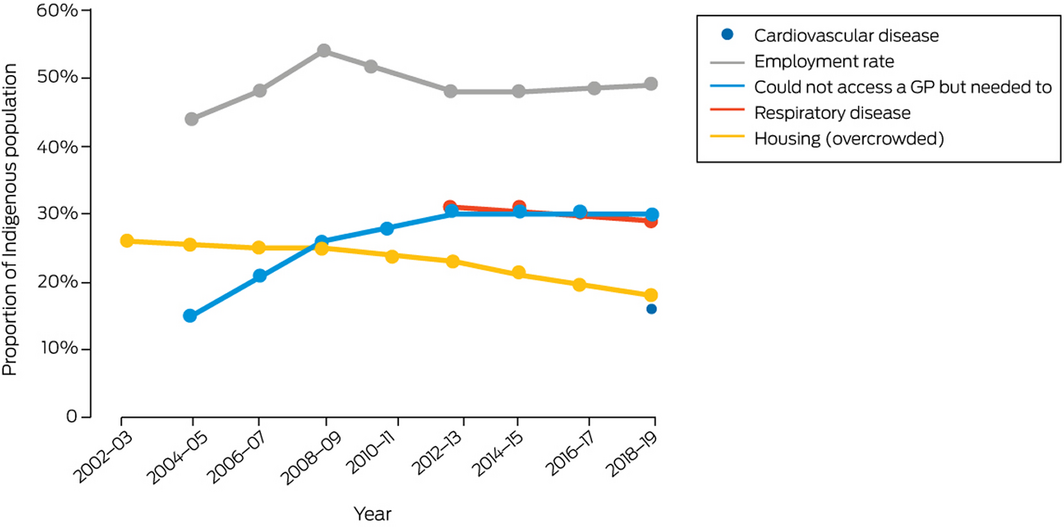
*The Australian Institute of Health and Welfare (AIHW) only introduced the cardiovascular indicator in 2018–19. Data source: AIHW.
Box 3 – Nationally averaged Australian heatwave season (November–March) accumulated excess heat factor (EHF) for the past 20 heatwave seasons (2001–2002 to 2020–2021)*
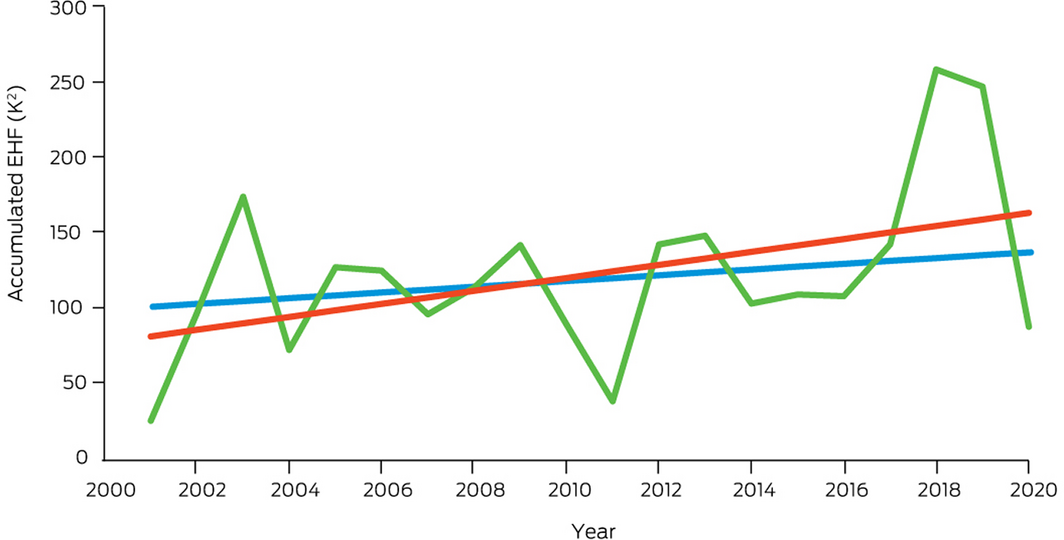
* The blue trend line is calculated over the past 50 heatwave seasons (1971–1972 to 2020–2021), while the red trend line is calculated over the past 20 heatwave seasons. Data source: Bureau of Meteorology.
Box 4 – Average number of days annually, 2001–2019, across eight Australian cities analysed (Sydney, Melbourne, Brisbane, Canberra, Perth, Alice Springs, Adelaide, Hobart) that exceeded the moderate, high and extreme Heat Stress Risk threshold as defined by the 2021 Sports Medicine Australia Extreme Heat Policy21
Box 5 – Total number of days annually, 2001–2019, for each of the eight Australian cities analysed (Sydney, Melbourne, Brisbane, Canberra, Perth, Alice Springs, Adelaide, Hobart) that exceeded the moderate, high and extreme Heat Stress Risk threshold as defined by the 2021 Sports Medicine Australia Extreme Heat Policy21
Box 6 – Estimated potential work hours lost in Australia due to heat, stratified by industry sector, shaded and in direct sunlight, 1990–2019
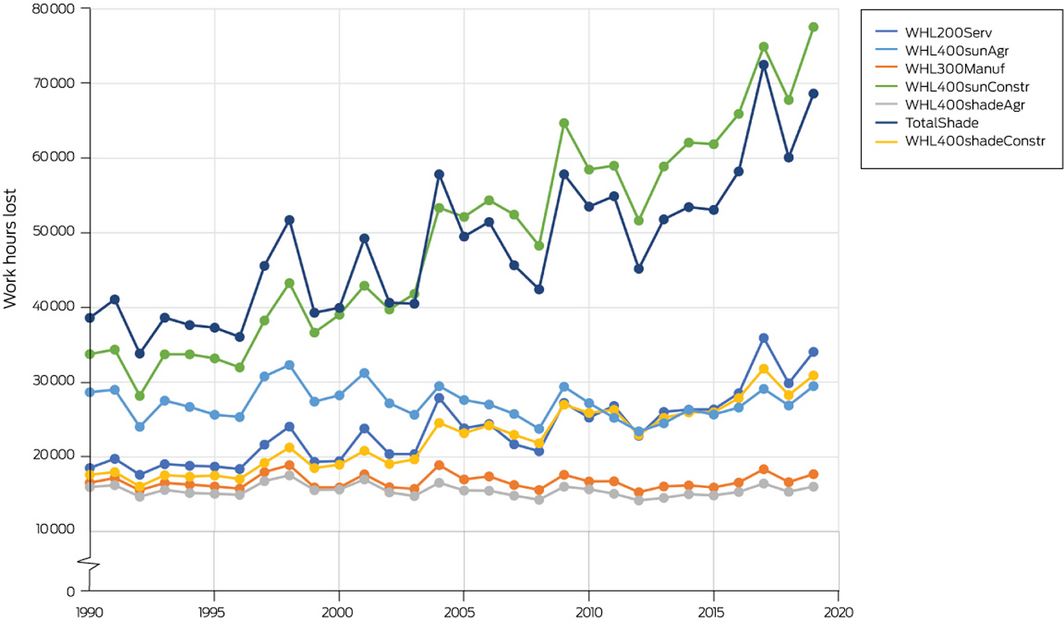
200 = 200 W, the assumed metabolic rate in the service sector; 300 = 300 W, the assumed metabolic rate in the manufacturing sector; 400 = 400 W, the assumed metabolic rate in the agriculture and construction sectors; Agr = agriculture sector; Constr = construction sector; Manuf = manufacturing sector; Serv = service sector; shade = shaded work; sun = work in the sun; WHL = work hours lost.
Box 7 – Spatial and temporal variation in mortality burden due to non‐optimal temperatures in Australia, 2000–2019
Box 8 – Annual person‐days exposed to landscape fire in Australia, 2001–2020, showing the trend with 95% confidence intervals and the average for the entire period
Box 9 – Number of people in Australia displaced by weather‐related disasters, 2008–2020
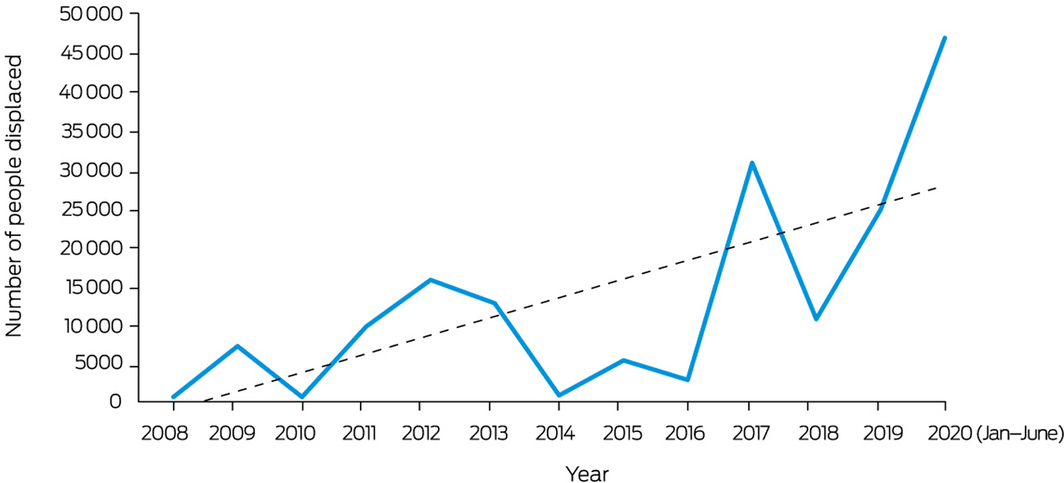
Dashed line shows the associated linear trend. Data source: Internal Displacement Monitoring Centre.
Box 10 – Annual dengue notifications per 100 000 population, 1991–2020, by Australian state and territory

Data source: National Notifiable Diseases Surveillance System.
Box 11 – Proportion of local councils in each Australian state and territory participating in the Cities Power Partnership in 2018, 2019 and 2020
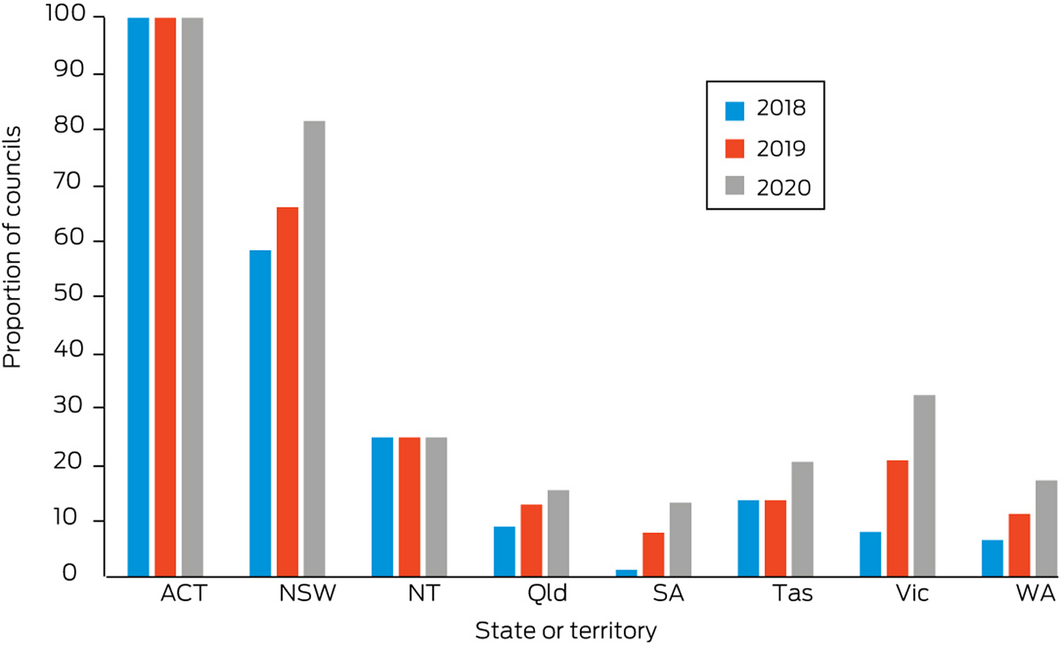
Note the Australian Capital Territory has only one local government area.
Box 12 – International Health Regulations (2005) monitoring framework average capacity scores for Australia, the WHO Western Pacific Region and the globe, for zoonotic events and the human–animal interface, surveillance, human resources, national health emergency framework, and health service provision, 2018–2020
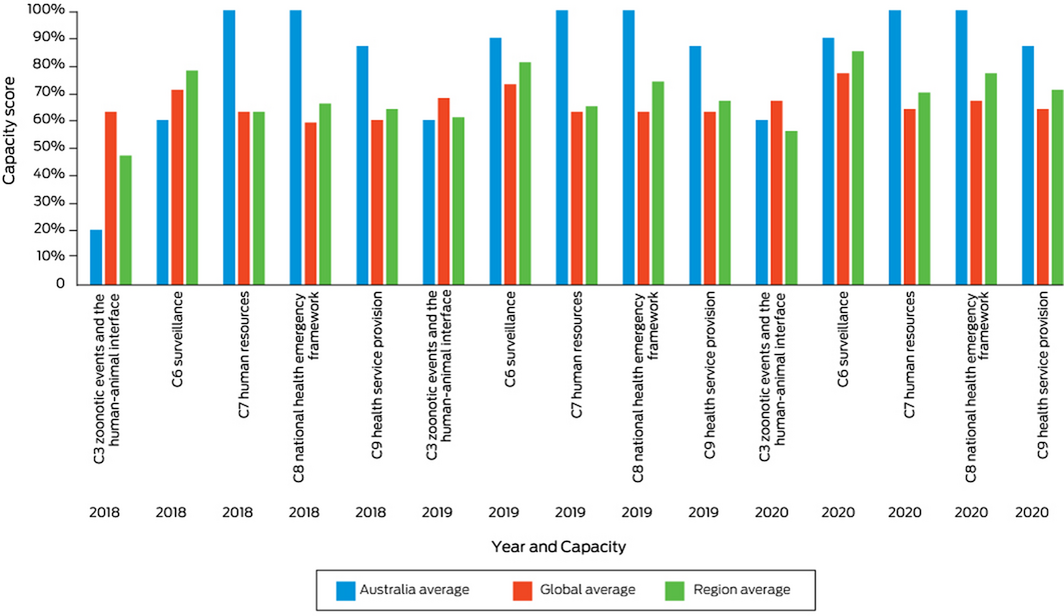
Data source: World Health Organization.
Box 13 – The amount of urban green space in all 27 Australian urban centres over 2020, as measured by the satellite remotely sensed Normalised Difference Vegetation Index (NDVI)*
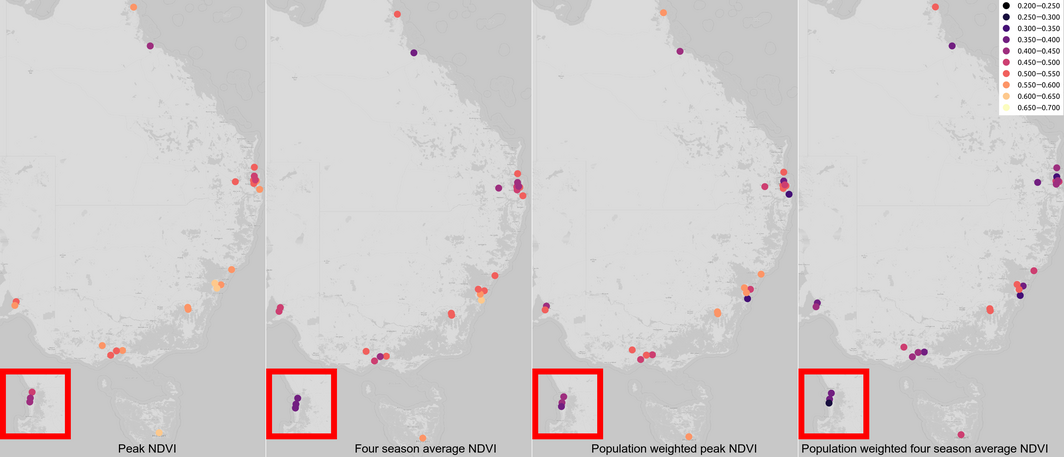
* Perth inset highlighted in red.
Box 14 – Annual number of National Aerial Firefighting Centre (NAFC) aircraft services and volunteer firefighters and support staff in Australia from 2007–08 to 2020–21
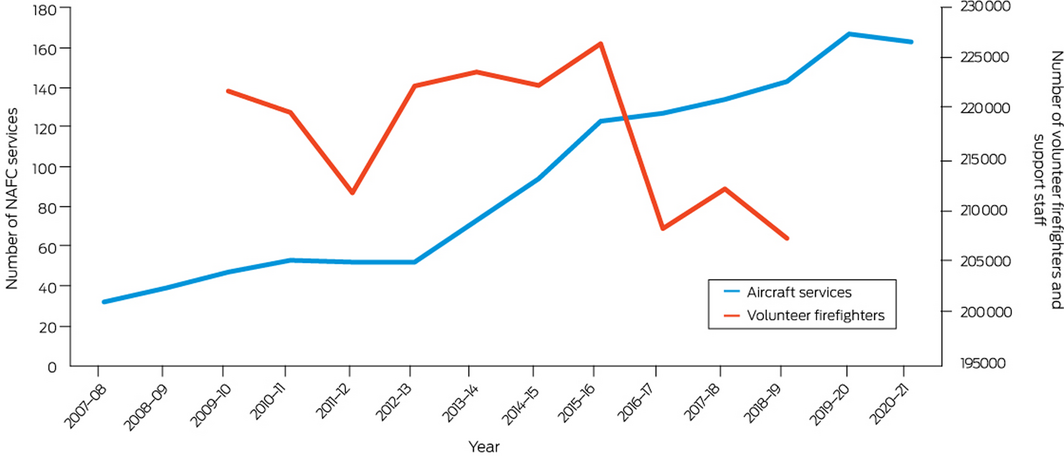
NAFC aircraft services represent the number of aircraft in Australia available to fight bushfires. It should be noted that some aircraft double up for the north and south of the country; for example, an aircraft may run in Queensland then move to Tasmania as a separate Service. A service is usually exclusive to NAFC use, mostly for 84 or 96 days each summer (some services run longer). Data sources: NAFC and Australian Government Productivity Commission.
Box 15 – Carbon intensity of total primary energy supply for Australia, selected countries and the world, and corresponding total carbon dioxide (CO2) emissions, 1971–2019
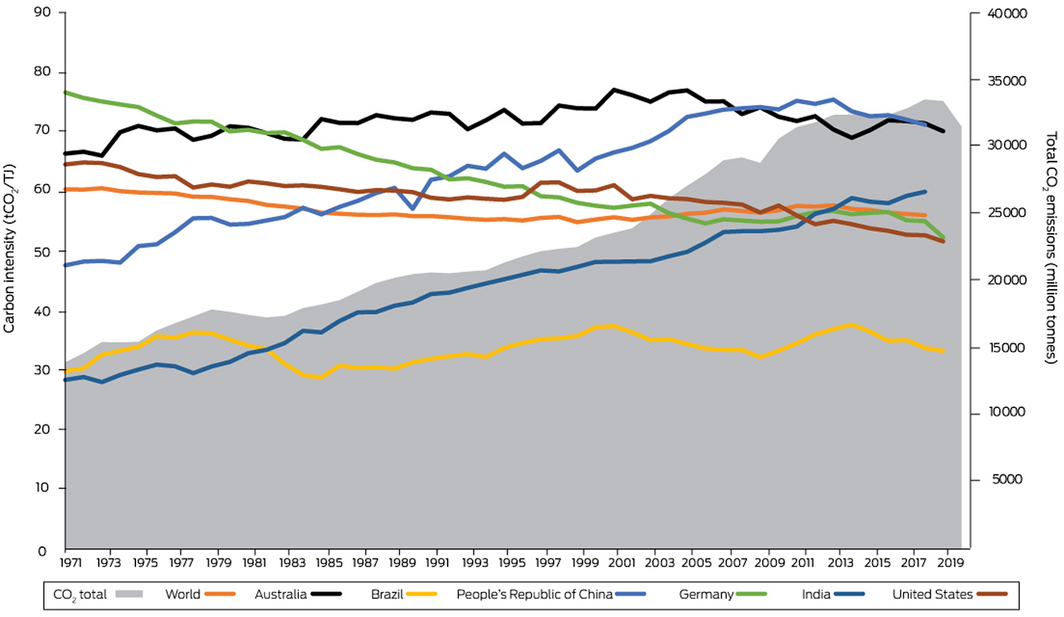
Data source: International Energy Agency.
Box 16 – Total primary coal supply in Australia, China, India, Indonesia and the US, 1990–2019
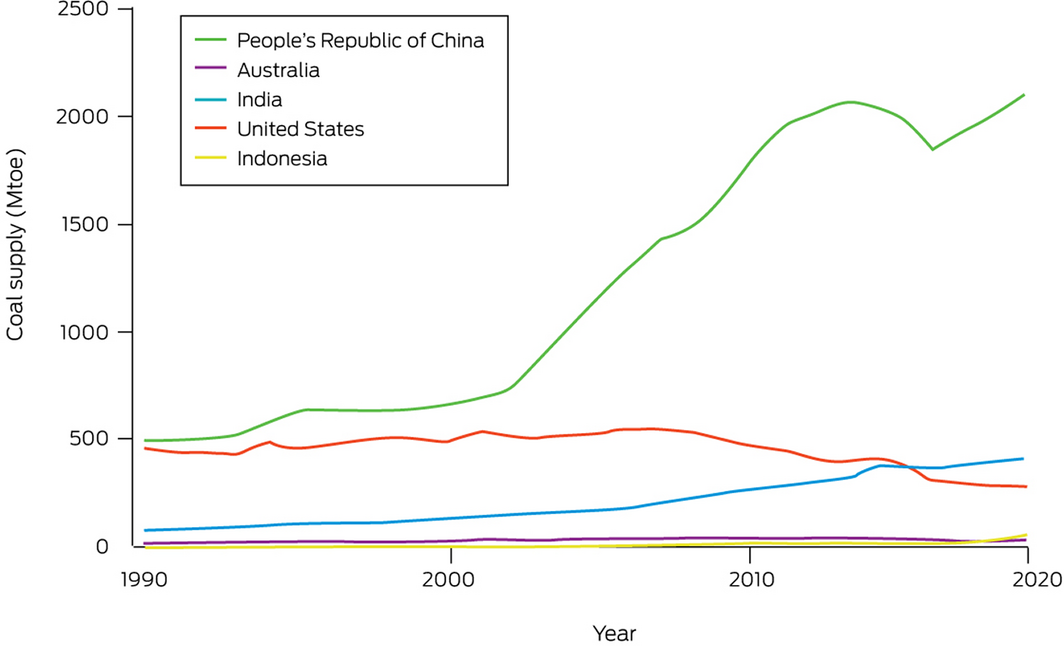
Mtoe = millions tonnes of oil equivalent. Data source: International Energy Agency.
Box 17 – Share of electricity generation from low carbon sources in Australia, Germany, the United Kingdom and the United States, and the Organisation for Economic Co‐operation and Development (OECD) total, 1990–2018
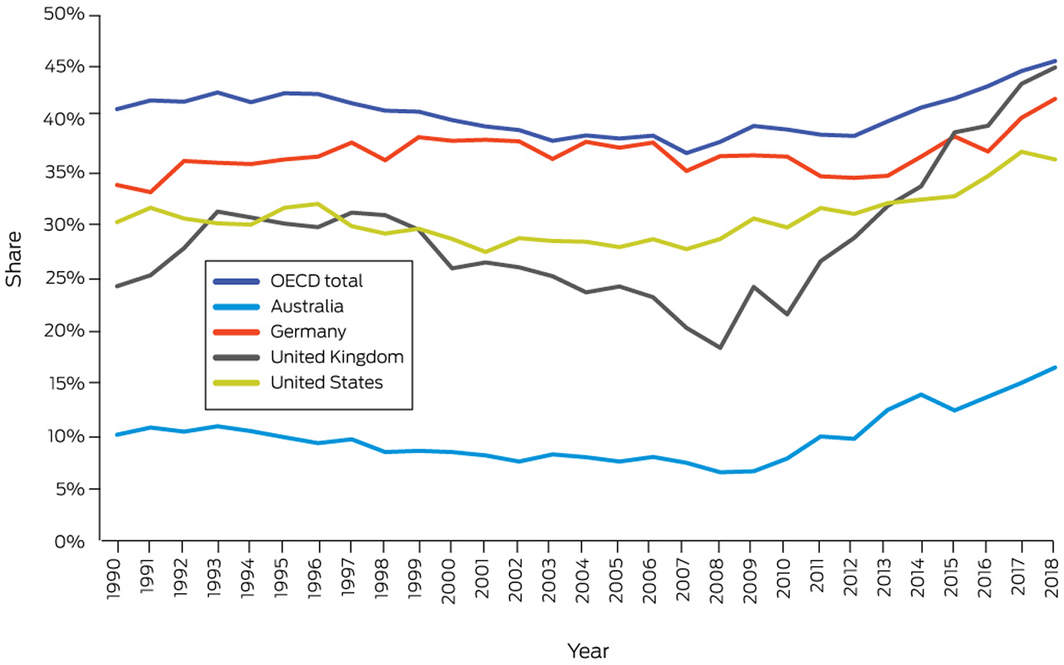
Data source: International Energy Agency.
Box 18 – Share of electricity generation from renewable sources in Australia, Germany, the United Kingdom and the United States, and the Organisation for Economic Co‐operation and Development (OECD) total, 1990–2018
Data source: International Energy Agency.
Box 19 – Australian transport energy consumption by fuel types, 2010–2019
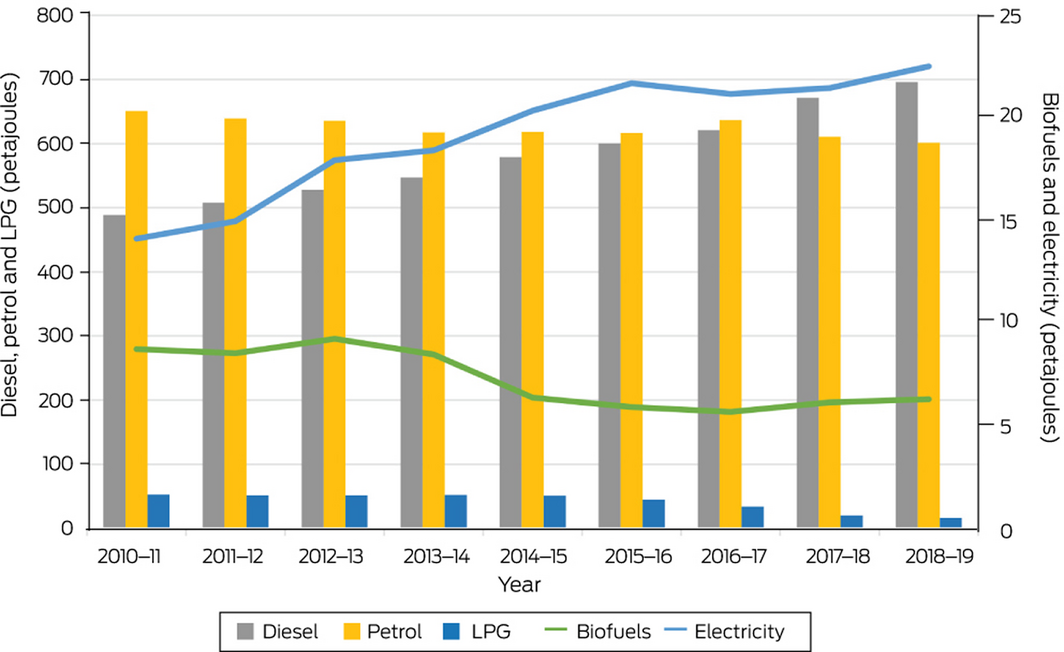
Data source: Australian Government.
Box 21 – Consumption‐based footprint of food sectors, showing the contribution of the top 10 food sectors to the overall footprint (53 448 kilotonnes)
Box 22 – Diet‐related deaths in Australia, Germany, the United Kingdom and the United States, 2000–2017*
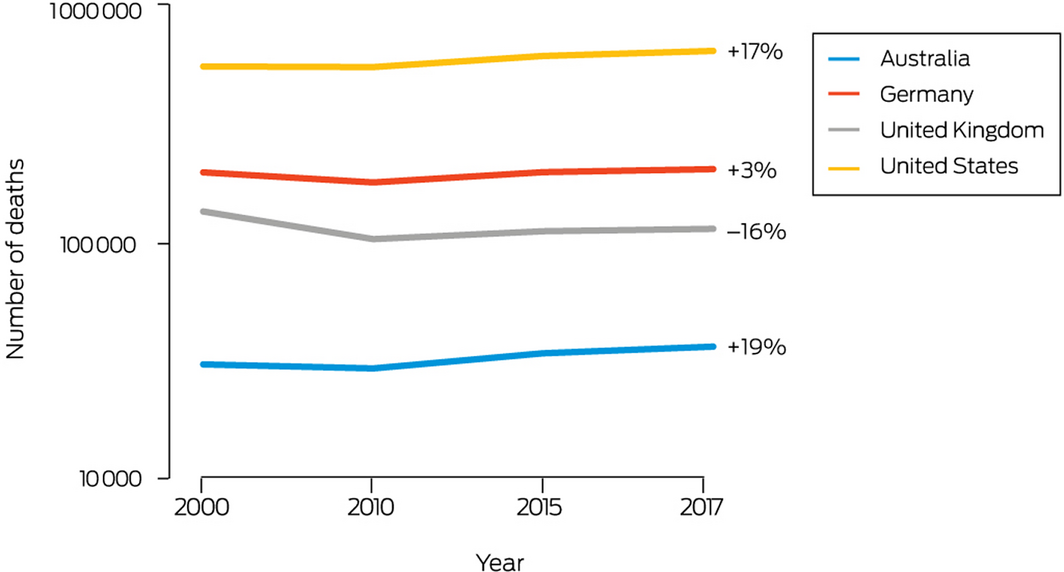
* The overall change from the start to the end of this period is shown as a percentage to the right of each of the lines. Note that the y axis is a logarithmic scale.
Box 24 – New investment and capacity withdrawal in the Australian National Electricity Market for different fuel sources (black coal, brown coal, gas, hydro, wind, solar and battery) for financial years 2012–13 to 2019–20
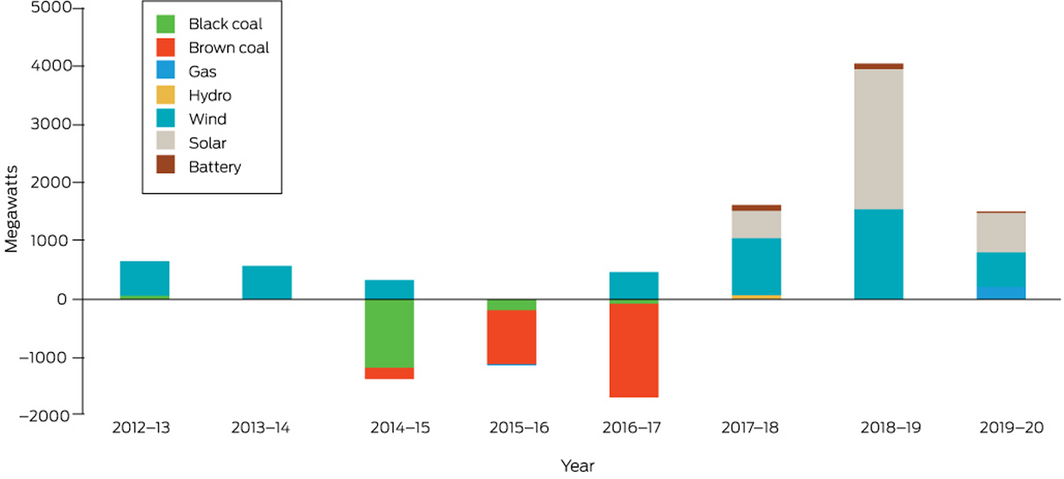
Data sources: Australian Energy Regulator and Australian Energy Market Operator.
Box 25 – Annual direct full‐time equivalent (FTE) employment in renewable energy activities for Australia, New South Wales, South Australia, Queensland and Victoria
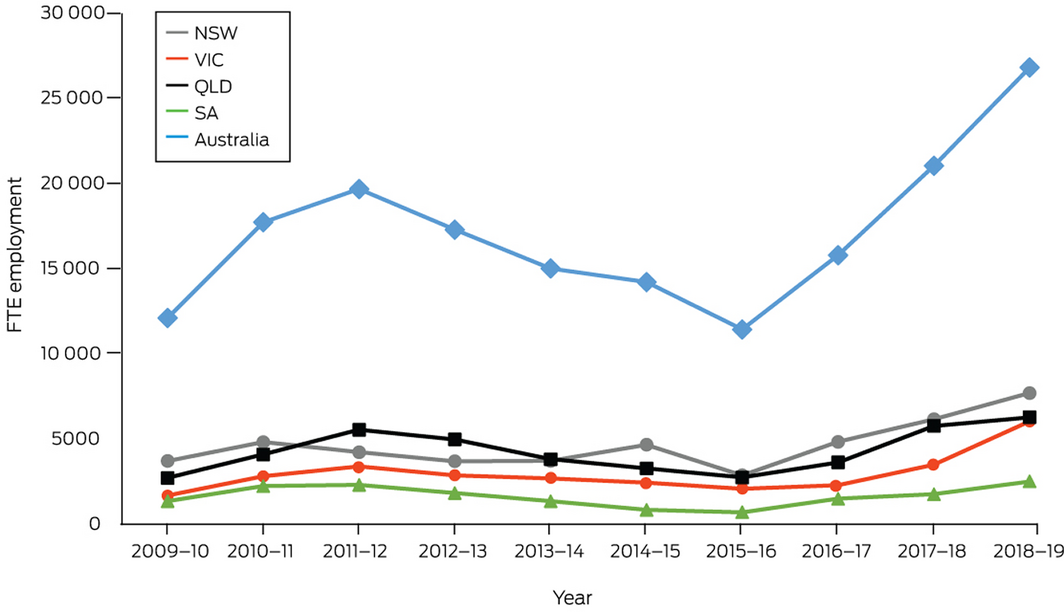
Source: Australian Bureau of Statistics.100
Provenance: Not commissioned; externally peer reviewed.
- Paul J Beggs1
- Ying Zhang2
- Alice McGushin3
- Stefan Trueck1
- Martina K Linnenluecke1
- Hilary Bambrick4
- Helen L Berry5
- Ollie Jay2
- Lucie Rychetnik2
- Ivan C Hanigan6
- Geoffrey G Morgan7
- Yuming Guo8
- Arunima Malik9
- Mark Stevenson10
- Donna Green11
- Fay H Johnston12
- Celia McMichael10
- Ian Hamilton13
- Anthony G Capon14
- 1 Macquarie University, Sydney, NSW
- 2 University of Sydney, Sydney, NSW
- 3 Institute for Global Health, University College London, London, UK
- 4 Queensland University of Technology, Brisbane, QLD
- 5 Australian Institute of Health Innovation, Macquarie University, Sydney, NSW
- 6 University Centre for Rural Health, University of Sydney, Sydney, NSW
- 7 University Centre for Rural Health, University of Sydney, Lismore, NSW
- 8 Monash University, Melbourne, VIC
- 9 Integrated Sustainability Analysis, University of Sydney, Sydney, NSW
- 10 University of Melbourne, Parkville, VIC
- 11 Climate Change Research Centre and ARC Centre of Excellence for Climate Extremes, University of New South Wales, Sydney, NSW
- 12 Menzies Institute for Medical Research, University of Tasmania, Hobart, TAS
- 13 UCL Energy Institute, University College London, London, UK
- 14 Monash Sustainable Development Institute, Monash University, Melbourne, VIC
We thank Katie Quail for assistance with indicator 1.2 Indigenous health and climate change. We thank Robert Fawcett, John Nairn (retired), Elizabeth Ebert and Bronwyn Brown (all from the Australian Bureau of Meteorology) for indicators 1.3 Health effects of heatwaves and 2.4 Climate information services for health. We thank Nathan Morris for assistance with the analysis for indicator 1.4 Heat impact on physical and sporting activities. We thank Tord Kjellstrom and Matthias Otto for providing the results for indicator 1.5 Change in labour capacity. The Bushfires indicator was generated with support from NASA Applied Sciences Program (grant no. 80NSSC21K0507) and we thank Yang Liu, Bryan Vu and Liuhua Shi (all from Emory University) for the Australian data used for this indicator (1.7), and Nicolas Borchers Arriagada (Menzies Institute for Medical Research, University of Tasmania) for assistance with analysis. Shouro Dasgupta conducted the sea level rise‐related data analysis for indicator 1.9 Migration, displacement, and environmental change. He is an author on the Lancet Countdown global report, and contributor to the sea level rise indicator. The global version of this indicator was developed in collaboration also with Ilan Kelman and Sonja Ayeb‐Karlsson. We thank Kerry Nice (University of Melbourne) who worked on indicator 2.6 Urban green space. The assistance of Zahra Borghei Ghomi (Macquarie University) in compiling the data for indicators 3.1 Carbon intensity of the energy system, 3.2 Coal phase‐out, 3.3 Zero carbon emission electricity, and 3.4 Clean household energy is acknowledged. We thank Marco Springman from the Lancet Countdown for providing the results for indicator 3.9 Diet and health co‐benefits. We thank Maddie Heenan for searching and data compilation for indicator 5.3 Government engagement in health and climate change in Australia. We thank the NHMRC for providing the data for indicator 5.4 Health and climate change research funding.
No relevant disclosures.
- 1. Arjmand H‐A, Seabrook E, Bakker D, Rickard N. Mental health consequences of adversity in Australia: national bushfires associated with increased depressive symptoms, while COVID‐19 pandemic associated with increased symptoms of anxiety. Front Psychol 2021; 12: 635158.
- 2. Batterham PJ, Calear AL, McCallum SM, et al. Trajectories of depression and anxiety symptoms during the COVID‐19 pandemic in a representative Australian adult cohort. Med J Aust 2021; 214: 462–468. https://www.mja.com.au/journal/2021/214/10/trajectories‐depression‐and‐anxiety‐symptoms‐during‐covid‐19‐pandemic
- 3. Farugia TL, Cuni‐Lopez C, White AR. Potential impacts of extreme heat and bushfires on dementia. J Alzheimers Dis 2021; 79: 969–978.
- 4. Royal Commission into National Natural Disaster Arrangements. Report. Canberra: Commonwealth of Australia, 2020. https://naturaldisaster.royalcommission.gov.au/publications/royal‐commission‐national‐natural‐disaster‐arrangements‐report (viewed Sept 2021).
- 5. Zhang Y, Beggs PJ, Bambrick H, et al. The MJA‐Lancet Countdown on health and climate change: Australian policy inaction threatens lives. Med J Aust 2018; 209: 474.e1‐474.e21. https://www.mja.com.au/journal/2018/209/11/mja‐lancet‐countdown‐health‐and‐climate‐change‐australian‐policy‐inaction
- 6. Beggs PJ, Zhang Y, Bambrick H, et al. The 2019 report of the MJA‐Lancet Countdown on health and climate change: a turbulent year with mixed progress. Med J Aust 2019; 211: 490–491.e21. https://www.mja.com.au/journal/2019/211/11/2019‐report‐mja‐lancet‐countdown‐health‐and‐climate‐change‐turbulent‐year‐mixed
- 7. Zhang Y, Beggs PJ, McGushin A, et al. The 2020 special report of the MJA–Lancet Countdown on health and climate change: lessons learnt from Australia’s “Black Summer”. Med J Aust 2020; 213: 492.e2–492.e10. https://www.mja.com.au/journal/2020/213/11/2020‐special‐report‐mja‐lancet‐countdown‐health‐and‐climate‐change‐lessons
- 8. Crowley K. Fighting the future: the politics of climate policy failure in Australia (2015–2020). WIREs Clim Change 2021; 12: e725.
- 9. Sachs J, Kroll C, Lafortune G, Fuller G, Woelm F. Sustainable Development Report 2021: The decade of action for the Sustainable Development Goals. Cambridge: Cambridge University Press, 2021. https://s3.amazonaws.com/sustainabledevelopment.report/2021/2021‐sustainable‐development‐report.pdf (viewed Sept 2021).
- 10. Australian Government Department of Industry, Science, Energy and Resources. International climate change commitments. https://www.industry.gov.au/policies‐and‐initiatives/australias‐climate‐change‐strategies/international‐climate‐change‐commitments (viewed July 2021).
- 11. Romanello M, McGushin A, Di Napoli C, et al. The 2021 report of the Lancet Countdown on health and climate change: code red for a healthy future. Lancet 2021; https://doi.org/10.1016/S0140‐6736(21)01787‐6.
- 12. Watts N, Amann M, Arnell N, et al. The 2020 report of the Lancet Countdown on health and climate change: responding to converging crises. Lancet 2021; 397: 129–170.
- 13. Lancet Countdown on Health and Climate Change. Explore our data: 1.1.1 Vulnerability to extremes of heat. https://www.lancetcountdown.org/data‐platform/climate‐change‐impacts‐exposures‐and‐vulnerability/1‐1‐health‐and‐heat/1‐1‐1‐heat‐vulnerability (viewed Jul 2021).
- 14. Green D, King U, Morrison J. Disproportionate burdens: the multidimensional impacts of climate change on the health of Indigenous Australians. Med J Aust 2009; 190: 4–5. https://www.mja.com.au/journal/2009/190/1/disproportionate‐burdens‐multidimensional‐impacts‐climate‐change‐health
- 15. Australian Institute of Health and Welfare. Aboriginal and Torres Strait Islander Health Performance Framework: 2020 summary report (Cat. No. IHPF 2). Canberra: AIHW, 2020. https://www.indigenoushpf.gov.au/ (viewed Sept 2021).
- 16. Campbell S, Remenyi TA, White CJ, Johnston FH. Heatwave and health impact research: a global review. Health Place 2018; 53: 210–218.
- 17. Watson KE, Gardiner KM, Singleton JA. The impact of extreme heat events on hospital presentations to the Royal Hobart Hospital. J Public Health (Oxf) 2020; 42: 333–339.
- 18. Nairn J, Fawcett R. Defining heatwaves: heatwave defined as a heat‐impact event servicing all community and business sectors in Australia (CAWCR Technical Report No. 060). CSIRO and Australian Government Bureau of Meteorology, 2013. https://www.cawcr.gov.au/technical‐reports/CTR_060.pdf (viewed May 2021).
- 19. Nairn JR, Fawcett RJB. The excess heat factor: a metric for heatwave intensity and its use in classifying heatwave severity. Int J Environ Res Public Health 2015; 12: 227–253.
- 20. Australian Government Bureau of Meteorology. Heatwave assessment and forecast. http://www.bom.gov.au/metadata/catalogue/19115/ANZCW0503900601 (viewed July 2021).
- 21. Jay O, Broderick C, Smallcombe J. Extreme heat policy. Melbourne: Sports Medicine Australia, 2021. https://sma.org.au/sma‐site‐content/uploads/2021/02/SMA‐Extreme‐Heat‐Policy‐2021‐Final.pdf (viewed Sept 2021).
- 22. Chen K, Vicedo‐Cabrera AM, Dubrow R. Projections of ambient temperature‐ and air pollution‐related mortality burden under combined climate change and population aging scenarios: a review. Curr Environ Health Rep 2020; 7: 243–255.
- 23. Johnston FH. Bushfires and human health in a changing environment. Aust Fam Physician 2009; 38: 720–724.
- 24. Williamson GJ, Prior LD, Jolly WM, et al. Measurement of inter‐ and intra‐annual variability of landscape fire activity at a continental scale: the Australian case. Environ Res Lett 2016; 11: 035003.
- 25. Abram NJ, Henley BJ, Gupta AS, et al. Connections of climate change and variability to large and extreme forest fires in southeast Australia. Commun Earth Environ 2021; 2: 8.
- 26. March A, Riddell G, de Moraes LN, et al. Urban planning capabilities for bushfire: treatment categories and scenario testing. Aust J Emerg Manag 2020; 35: 32–40.
- 27. McMartin DW, Sammel AJ, Arbuthnott K. Community response and engagement during extreme water events in Saskatchewan, Canada and Queensland, Australia. Environ Manag 2018; 61: 34–45.
- 28. Raikes J, Smith TF, Baldwin C, Henstra D. Linking disaster risk reduction and human development. Clim Risk Manag 2021; 32: 100291.
- 29. Internal Displacement Monitoring Centre. Displacement data. https://www.internal‐displacement.org/ (viewed May 2021).
- 30. Internal Displacement Monitoring Centre. Internal displacement 2020: mid‐year update. Geneva: IDMC, 2020. https://www.internal‐displacement.org/publications/internal‐displacement‐2020‐mid‐year‐update (viewed May 2021).
- 31. Dannenberg AL, Frumkin H, Hess JJ, Ebi KL. Managed retreat as a strategy for climate change adaptation in small communities: public health implications. Clim Change 2019; 153: 1–14.
- 32. McMichael C. Human mobility, climate change, and health: unpacking the connections. Lancet Planet Health 2020; 4: e217–e218.
- 33. Duncombe J, Clements A, Davis J, et al. Spatiotemporal patterns of Aedes aegypti populations in Cairns, Australia: assessing drivers of dengue transmission. Trop Med Int Health 2013; 18: 839–849.
- 34. Stratton MD, Ehrlich HY, Mor SM, Naumova EN. A comparative analysis of three vector‐borne diseases across Australia using seasonal and meteorological models. Sci Rep 2017; 7: 40186.
- 35. Climate and Health Alliance. Framework for a national strategy on climate, health and well‐being for Australia. Melbourne: CAHA, 2017. https://www.caha.org.au/national_strategy_framework_launch (viewed May 2021).
- 36. Australian Capital Territory Government. ACT climate change strategy 2019–25. Canberra: ACT Government, 2019. https://www.environment.act.gov.au/__data/assets/pdf_file/0003/1414641/ACT‐Climate‐Change‐Strategy‐2019‐2025.pdf/_recache (viewed May 2021).
- 37. Government of South Australia. State Public Health Plan 2019–2024. Adelaide: SA Health, 2018. https://www.sahealth.sa.gov.au/wps/wcm/connect/d18380e5‐6792‐4cdd‐a193‐08d80fd47df4/FINAL+State+public+Health+Plan+2019‐2024.pdf?MOD=AJPERES&CACHEID=ROOTWORKSPACE‐d18380e5‐6792‐4cdd‐a193‐08d80fd47df4‐nK5wa‐k (viewed Sept 2021).
- 38. Weeramanthri TS, Joyce S, Bowman F, et al. Climate Health WA Inquiry: final report. Perth: WA Department of Health, 2020. https://ww2.health.wa.gov.au/Improving‐WA‐Health/Climate‐health‐inquiry (viewed Sept 2021).
- 39. Tasmanian Government Department of Health. Tasmanian climate change and health roundtable: final report. Hobart: Department of Health, 2020. https://www.health.tas.gov.au/__data/assets/pdf_file/0009/408429/Tasmanian_Climate_Change_and_Health_Roundtable_‐_Final_Report_June_2020.pdf (viewed May 2021).
- 40. Rice M, Weisbrot E, Bradshaw S, et al. Game, set, match: calling time on climate inaction. Sydney: Climate Council, 2021. https://www.climatecouncil.org.au/wp‐content/uploads/2021/02/Game‐Set‐Match‐Calling‐Time‐on‐Climate‐Inaction‐Climate‐Council‐Sports‐Report‐1.pdf (viewed Sept 2021).
- 41. Bambrick H, Charlesworth K, Bradshaw S, Baxter T. Kicking the gas habit: how gas is harming our health. Sydney: Climate Council, 2021. https://www.climatecouncil.org.au/wp‐content/uploads/2021/05/Kicking‐the‐Gas‐Habit‐How‐Gas‐is‐Harming‐our‐Health.pdf (viewed Sept 2021).
- 42. Garnaut R. The Garnaut climate change review: final report. Cambridge: Cambridge University Press, 2008.
- 43. CSIRO, Bureau of Meteorology. State of the climate 2020. Commonwealth of Australia, 2020. https://www.csiro.au/en/Showcase/state‐of‐the‐climate (viewed May 2021).
- 44. City of Sydney. Climate emergency response. Sydney: City of Sydney, 2019. https://www.cityofsydney.nsw.gov.au/strategies‐action‐plans/climate‐emergency‐response (viewed May 2021).
- 45. City of Sydney. Sustainable Sydney 2030: community strategic plan 2017–2021. Sydney: City of Sydney, 2017. https://www.cityofsydney.nsw.gov.au/strategies‐action‐plans/community‐strategic‐plan (viewed May 2021).
- 46. City of Melbourne. Climate change adaptation strategy refresh 2017. Melbourne: City of Melbourne, 2017. https://www.melbourne.vic.gov.au/about‐council/vision‐goals/eco‐city/Pages/climate‐change‐adaptation‐strategy.aspx (viewed May 2021).
- 47. City of Hobart. Sustainable Hobart action plan: towards a zero emissions Hobart, 2020‐2025. Hobart: City of Hobart, 2020. https://www.hobartcity.com.au/files/assets/public/strategies‐and‐plans/sustainable‐hobart‐action‐plan‐2020‐2025.pdf (viewed May 2021).
- 48. Government of South Australia: Department of Planning, Transport and Infrastructure. The 30‐year plan for Greater Adelaide: 2017 update. Adelaide: DPTI, 2017. https://livingadelaide.sa.gov.au/__data/assets/pdf_file/0003/319809/The_30‐Year_Plan_for_Greater_Adelaide.pdf (viewed May 2021).
- 49. City of Darwin. Climate change action plan 2011–2020. Darwin: Darwin City Council, 2011.
- 50. Brisbane City Council. Brisbane. Clean, green, sustainable: 2017–2031. Brisbane: Brisbane City Council, 2017.
- 51. City of Perth. Towards an energy resilient city: strategic directions paper. Perth: City of Perth, 2014.
- 52. Bannister T, Ebert EE, Silver J, et al. A pilot forecasting system for epidemic thunderstorm asthma in southeastern Australia. Bull Am Meteorol Soc 2021; 102: E399–E420.
- 53. World Health Organization. International Health Regulations (2005). 3rd ed. Geneva: WHO, 2016.
- 54. Wong MCS, Huang J, Wong SH, Yuen‐Chun Teoh J. The potential effectiveness of the WHO International Health Regulations capacity requirements on control of the COVID‐19 pandemic: a cross‐sectional study of 114 countries. J R Soc Med 2021; 114: 121–131.
- 55. Kriegler FL, Malila WA, Nalekpa RF, Richardson W. Preprocessing transformations and their effects on multispectral recognition. Proceedings of the Sixth International Symposium on Remote Sensing of Environment 1969; II: 97.
- 56. Wolch JR, Byrne J, Newell JP. Urban green space, public health, and environmental justice: the challenge of making cities ‘just green enough’. Landsc Urban Plan 2014; 125: 234–244.
- 57. Markevych I, Schoierer J, Hartig T, et al. Exploring pathways linking greenspace to health: theoretical and methodological guidance. Environ Res 2017; 158: 301–317.
- 58. Fong KC, Hart JE, James P. A review of epidemiologic studies on greenness and health: updated literature through 2017. Curr Environ Health Rep 2018; 5: 77–87.
- 59. Murphy K, Morton A. Morrison government flags $540m for hydrogen and carbon capture ahead of Biden summit. The Guardian 2021; 21 Apr. https://www.theguardian.com/environment/2021/apr/21/morrison‐government‐flags‐540m‐for‐hydrogen‐and‐carbon‐capture‐ahead‐of‐biden‐summit (viewed July 2021).
- 60. International Energy Agency. Indicators for CO2 emissions (edition 2020). Paris: IEA, 2020. https://www.oecd‐ilibrary.org/energy/data/iea‐co2‐emissions‐from‐fuel‐combustion‐statistics/indicators‐for‐co2‐emissions‐edition‐2020_8d2fb5d7‐en (viewed Mar 2021).
- 61. International Energy Agency. Global energy review 2021. Paris: IEA, 2021. https://www.iea.org/reports/global‐energy‐review‐2021 (viewed May 2021).
- 62. International Energy Agency. Coal information: statistics report. https://www.iea.org/reports/coal‐information‐overview (viewed Sept 2021).
- 63. International Energy Agency. Key world energy statistics 2020. https://www.iea.org/reports/key‐world‐energy‐statistics‐2020 (viewed Mar 2021).
- 64. International Energy Agency. Coal 2020: analysis and forecast to 2025. https://www.iea.org/reports/coal‐2020 (viewed Mar 2021).
- 65. International Energy Agency. Coal information: overview. https://www.iea.org/reports/coal‐information‐overview (viewed Mar 2021).
- 66. International Energy Agency. World energy balances: overview. https://www.iea.org/reports/world‐energy‐balances‐overview (viewed Sept 2021).
- 67. Australian Government Department of Industry, Science, Energy and Resources. Australian energy statistics, Table O: Electricity generation by fuel type 2018–19 and 2019. Canberra: DISER, 2020. https://www.energy.gov.au/publications/australian‐energy‐statistics‐table‐o‐electricity‐generation‐fuel‐type‐2018‐19‐and‐2019 (viewed May 2021).
- 68. Clean Energy Council. Clean energy Australia: report 2021. Melbourne: CEC, 2021. https://www.cleanenergycouncil.org.au/resources/resources‐hub/clean‐energy‐australia‐report (viewed Sept 2021).
- 69. Clean Energy Council. Renewable energy target. https://www.cleanenergycouncil.org.au/advocacy‐initiatives/renewable‐energy‐target (viewed Mar 2021).
- 70. Clean Energy Regulator. Postcode data for small‐scale installations. http://www.cleanenergyregulator.gov.au/RET/Forms‐and‐resources/Postcode‐data‐for‐small‐scale‐installations#Smallscale‐installations‐by‐installation‐year (viewed Jul 2019).
- 71. Clean Energy Council. Solar. https://www.cleanenergycouncil.org.au/resources/technologies/solar‐energy#:~:text=The%20growth%20of%20solar,the%20third%2Dhighest%20number%20ever (viewed May 2021).
- 72. Mazengarb M. Rooftop solar’s stunning surge to new records, as Australia installs reach 2.5 million. Renew Economy 2020; 3 Aug. https://reneweconomy.com.au/rooftop‐solars‐stunning‐surge‐to‐new‐records‐as‐australia‐installs‐reach‐2‐5‐million‐55528/ (viewed May 2021).
- 73. Australian Government Department of Industry, Science, Energy and Resources. Regional and Remote Communities Reliability Fund. https://www.energy.gov.au/government‐priorities/energy‐programs/regional‐and‐remote‐communities‐reliability‐fund (viewed May 2021).
- 74. United States Environmental Protection Agency. Integrated science assessment (ISA) for particulate matter (Final Report, Dec 2019). EPA/600/R‐19/188. Washington, DC: USEPA, 2019.
- 75. Hanigan IC, Johnston FH, Morgan GG. Vegetation fire smoke, indigenous status and cardio‐respiratory hospital admissions in Darwin, Australia, 1996–2005: a time‐series study. Environ Health 2008; 7: 42.
- 76. Johnston FH, Hanigan IC, Henderson S, Morgan GG. Evaluation of interventions to reduce air pollution from biomass smoke on mortality in Launceston, Australia: retrospective analysis of daily mortality, 1994–2007. BMJ 2013; 346: e8446.
- 77. Hanigan IC, Broome RA, Chaston TB, et al. Avoidable mortality attributable to anthropogenic fine particulate matter (PM2.5) in Australia. Int J Environ Res Public Health 2021; 18: 254.
- 78. Broome RA, Powell J, Cope ME, Morgan GG. The mortality effect of PM2.5 sources in the Greater Metropolitan Region of Sydney, Australia. Environ Int 2020; 137: 105429.
- 79. Australian Government Department of Industry, Science, Energy and Resources. Australian energy statistics 2020 update published. https://www.energy.gov.au/news‐media/news/australia‐energy‐statistics‐2020‐update‐published (viewed May 2021).
- 80. ClimateWorks Australia. Moving to zero: accelerating the transition to zero‐emissions transport. Melbourne: ClimateWorks Australia, 2020.
- 81. Australian Government Department of Industry, Science, Energy and Resources. Australian energy update 2020. Canberra: DISER, 2020. https://www.energy.gov.au/publications/australian‐energy‐update‐2020 (viewed Oct 2020).
- 82. Budget Direct. Electric car sales 2020. https://www.budgetdirect.com.au/car‐insurance/research/electric‐car‐sales‐australia.html (viewed Mar 2021).
- 83. Electric Vehicle Council. State of electric vehicles: August 2020. Sydney: Electric Vehicle Council, 2020. https://electricvehiclecouncil.com.au/reports/state‐of‐electric‐vehicles‐2020/ (viewed Sept 2021).
- 84. Climate Change Commission. Ināia tonu nei: a low emissions future for Aotearoa. Advice to the New Zealand Government on its first three emissions budgets and direction for its emissions reduction plan 2022–2025. Wellington: New Zealand Government, 2021.
- 85. Hamilton I, Kennard H, McGushin A, et al. The public health implications of the Paris Agreement: a modelling study. Lancet Planet Health 2021; 5: e74–e83.
- 86. Goel R, Goodman A, Aldred R, et al. Cycling behaviour in 17 countries across 6 continents: levels of cycling, who cycles, for what purpose, and how far? Transport Rev 2021; https://doi.org/10.1080/01441647.2021.1915898.
- 87. Australian Government: Department of Industry, Science, Energy and Resources. National greenhouse gas inventory – Paris Agreement inventory. https://ageis.climatechange.gov.au (viewed Mar 2021).
- 88. Malik A, Lenzen M, McAlister S, McGain F. The carbon footprint of Australian health care. Lancet Planet Health 2018; 2: e27–e35.
- 89. Malik A, Padget M, Carter S, et al. Environmental impacts of Australia’s largest health system. Resour Conserv Recycl 2021; 169: 105556.
- 90. Lenzen M, Malik A, Li M, et al. The environmental footprint of health care: a global assessment. Lancet Planet Health 2020; 4: e271–e279.
- 91. Pichler P‐P, Jaccard IS, Weisz U, Weisz H. International comparison of health care carbon footprints. Environ Res Lett 2019; 14: 064004.
- 92. Hepburn C, O’Callaghan B, Stern N, et al. Will COVID‐19 fiscal recovery packages accelerate or retard progress on climate change? Oxf Rev Econ Policy 2020; 36 Suppl 1: S359–S381.
- 93. Conti S, Meli P, Minelli G, et al. Epidemiologic study of mortality during the Summer 2003 heat wave in Italy. Environ Res 2005; 98: 390–399.
- 94. Semenza JC, Rubin CH, Falter KH, et al. Heat‐related deaths during the July 1995 heat wave in Chicago. N Engl J Med 1996; 335: 84–90.
- 95. Herbst J, Mason K, Byard RW, et al. Heat‐related deaths in Adelaide, South Australia: review of the literature and case findings – an Australian perspective. J Forensic Leg Med 2014; 22: 73–78.
- 96. Australian Bureau of Statistics. 3222.0 ‐ Population Projections. Canberra: ABS, 2008. https://www.abs.gov.au/AUSSTATS/abs@.nsf/Lookup/3222.0Main+Features12006%20to%202101?OpenDocument (viewed July 2021).
- 97. Office of Best Practice Regulation, Department of the Prime Minister and Cabinet. Best practice regulation guidance note: value of statistical life. Canberra: Office of Best Practice Regulation, 2014.
- 98. Australian Energy Regulator. State of the energy market 2020. Melbourne: AER, 2020. https://www.aer.gov.au/publications/state‐of‐the‐energy‐market‐reports/state‐of‐the‐energy‐market‐2020 (viewed May 2021).
- 99. Australian Energy Market Operator. Generation information. http://aemo.com.au/Electricity/National‐Electricity‐Market‐NEM/Planning‐and‐forecasting/Generation‐information (viewed Apr 2021).
- 100. Australian Bureau of Statistics. Employment in renewable energy activities, Australia: 2018–19 financial year. Canberra: ABS, 2020. https://www.abs.gov.au/statistics/labour/employment‐and‐unemployment/employment‐renewable‐energy‐activities‐australia/latest‐release (viewed May 2021).
- 101. Australian Bureau of Statistics. Australian industry: 2018–19 financial year. Canberra: ABS, 2020. https://www.abs.gov.au/statistics/industry/industry‐overview/australian‐industry/2018‐19 (viewed May 2021).
- 102. Fossil Free. 1200+ divestment commitments. https://gofossilfree.org/divestment/commitments/ (viewed Apr 2021).
- 103. Clean Energy Regulator. Australian carbon credit units. Canberra: CER, 2020. http://www.cleanenergyregulator.gov.au/OSR/ANREU/types‐of‐emissions‐units/australian‐carbon‐credit‐units (viewed July 2021).
- 104. Australian Government. Excise ‐ Table 4: Fuel tax credits scheme – claims paid, by broad and fine industry, 2006–07 to 2019–20 financial years. Canberra: Australian Government, 2021. https://data.gov.au/data/dataset/taxation‐statistics‐2018‐19/resource/4b2139a1‐395b‐47e4‐83bb‐f1de7fb0ed8b?inner_span=True (viewed July 2021).
- 105. The Australia Institute. Australian fossil fuel subsidies hit $10.3 billion in 2020‐21 [media release]. 26 Apr 2021. https://australiainstitute.org.au/post/australian‐fossil‐fuel‐subsidies‐hit‐10‐3‐billion‐in‐2020‐21/ (viewed July 2021).
- 106. Organisation for Economic Co‐operation and Development. OECD.Stat. Fossil fuel support ‐ AUS. https://stats.oecd.org/Index.aspx?DataSetCode=FFS_AUS (viewed Mar 2021).
- 107. World Bank. Carbon pricing dashboard. https://carbonpricingdashboard.worldbank.org/ (viewed Mar 2021).
- 108. Market Forces. How your tax dollars subsidise fossil fuels. https://www.marketforces.org.au/campaigns/ffs/tax‐based‐subsidies/ (viewed Mar 2021).
- 109. Australian Government Department of Health. Bushfire smoke and health: summary of the current evidence. Canberra: Department of Health, 2020. https://www1.health.gov.au/internet/main/publishing.nsf/Content/A12B57E41EC9F326CA257BF0001F9E7D/$File/Bushfire‐smoke‐health‐Summary‐current‐evidence.pdf (viewed May 2021).
- 110. Commonwealth of Australia. Disaster and emergency management for environmental health practitioners. Canberra: Commonwealth of Australia, 2020. https://www1.health.gov.au/internet/main/publishing.nsf/Content/A12B57E41EC9F326CA257BF0001F9E7D/$File/Disaster_and_Emergency_Management_for_EHPs.pdf (viewed May 2021).
- 111. National Health and Medical Research Council. NHMRC Special Initiative in Human Health and Environmental Change. Canberra: NHMRC, 2021. https://www.nhmrc.gov.au/funding/find‐funding/nhmrc‐special‐initiative‐human‐health‐and‐environmental‐change (viewed May 2021).
Summary