


The known: Public health disasters, such as the COVID‐19 pandemic, can have considerable mental health effects because of direct viral exposure, social isolation, and economic changes.
The new: In our longitudinal and nationally representative study of mental health, we found that exposure to COVID‐19 itself did not harm mental health, but COVID‐19‐related financial distress and social impairment were associated with higher symptom levels of depression or anxiety throughout the first three months of the pandemic.
The implications: Clinical and public health strategies to mitigate the negative impacts of COVID‐19 and future public health disasters on the mental health of Australian adults are needed.
The coronavirus disease 2019 (COVID‐19) pandemic may cause considerable mental ill health.1 The direct risks of the virus, the social and financial consequences of lockdowns, isolation and quarantine,2 and uncertainty about change3 may exacerbate symptoms of depression and anxiety.1,4,5 However, most investigations of the mental health effects of COVID‐19 have used convenience samples, relied on cross‐sectional data, or collected data after a lockdown had commenced.6,7 Further, only one longitudinal study of the prevalence of symptoms of depression and anxiety in a nationally representative cohort during an epidemic has been reported, and it was limited to three waves of data.8
In this article, we report a longitudinal cohort study that collected data each fortnight from a nationally representative sample during the initial months of the COVID‐19 pandemic in Australia (late March to mid‐June 2020). Public health restrictions were implemented nationally in late March, with public gatherings limited to two people, the international border closed, and people allowed to leave their homes only for essential activities.9 Restrictions were eased in early May, but have since been renewed following increases in local numbers of COVID‐19 cases. Our aims were to estimate initial levels of symptoms of depression and anxiety and their changes during March to mid‐June 2020, to identify factors associated with the initial levels and changes, to identify trajectories of symptoms of depression and anxiety, and to identify factors associated with these trajectories.
Methods
The longitudinal Australian National COVID‐19 Mental Health, Behaviour and Risk Communication (COVID‐MHBRC) survey investigated the impact of the COVID‐19 pandemic on a representative sample of Australian adults (18 years or older).10 A sample representative of the Australian population by age group, gender, and state/territory was recruited from an online market research panel using quota sampling. Our target sample size, with sufficient power to detect small effects in subgroups and up to six latent symptom trajectories, was 1200 participants. The full study protocol and survey have been published online.11
We analysed data from seven survey waves, administered online each fortnight by Qualtrics Research Services, commencing with baseline data collected during 28–31 March 2020 (1296 participants). Baseline participants were invited by email to complete each subsequent survey, with six‐day windows for completion; up to five reminders for each follow‐up survey were sent as required.
Outcomes reported in this article are symptoms of depression and anxiety, measured with the Patient Health Questionnaire (PHQ‐9) depression and Generalised Anxiety Disorder (GAD‐7) scales.12 These measures are closely aligned with diagnostic criteria for major depressive disorder and generalised anxiety disorder;12 scores of 10 or more indicate clinically significant symptoms (10–14, moderate; ≥ 15, severe symptoms), and scores of 5–9 mild symptoms.
We collected baseline data on risk factors for depression and anxiety:1,13,14,15,16
- socio‐demographic characteristics: age, gender, education, having a partner, living alone, living with children;
- COVID‐19‐related health, social, and employment exposures: exposure to COVID‐19 (13 binary indicators related to direct exposure), job loss, working from home, financial distress, and impairment in work and social domains (measured with the Work and Social Adjustment Scale;17 range, 0–40 points, eight points each for impairment of ability to work, home management, social leisure activities, private leisure activities, and ability to form and maintain close relationships);
- current diagnoses of physical, mental, or neurological disorders (based on lists of specific conditions); and
- exposure to adversity: affected by fire or by smoke during 2019–20 bushfires, or by any other recent adversity.
Statistical analysis
Intercept (initial level), linear changes, and quadratic changes in PHQ‐9 and GAD‐7 scores over the seven surveys were estimated in quadratic growth models that took into account all data for each time point.18
Symptoms of depression and anxiety were also examined in quadratic growth mixture models. These models include categorical latent variables derived from the data to identify groups of individuals (subpopulations or “classes”) on the basis of their symptom trajectories, and account for within‐class variation by including a random effect.19 Models including one to five trajectory classes were estimated for each symptom type, and the optimal number of classes determined with a significant bootstrap likelihood ratio test for the addition of a class; to ensure the robustness of estimates, inclusion of at least 5% of the sample was required for each class.20 After the latent classes were characterised and extracted, factors associated with class membership (trajectory) were identified by multinomial logistic regression analysis.
Summary statistics were derived and multinomial logistic regressions conducted in SPSS 26 (IBM); growth models were estimated in Mplus 7.4 (http://www.statmodel.com).
Ethics approval
Our study was approved by the Australian National University Human Research Ethics Committee (protocol, 2020/152). All survey participants provided written informed consent.
Results
Of the 1296 participants who provided information in the baseline survey, 969 responded to the second survey (75%), 952 to the third (73%), 910 to the fourth (70%), 874 to the fifth (67%), 820 to the sixth (63%), and 762 to the final survey (59%).
The demographic characteristics of the baseline participants broadly reflected those of the Australian population, except that rural and regional people were slightly under‐represented (21% [inferred by postcode] v 28% nationally) (Box 1). The prevalence of clinically significant symptoms of depression at baseline was 20.3% (263 of 1295 participants) and of anxiety 16.4% (212 of 1295 participants); it peaked for depression in mid‐April (229 of 969 respondents, 23.6%) and for anxiety in late April (163 of 950 respondents, 17.2%) (Box 2).
Symptoms of depression and anxiety
Across the seven surveys, mean PHQ‐9 and GAD‐7 scores for the cohort were at or below levels that correspond to mild symptoms of depression or anxiety (5–9 points). Linear change was not statistically significant for either symptom, but quadratic change was statistically significant for symptoms of depression (P = 0.026) but not anxiety (P = 0.55), indicating that the mean depression score declined to a greater degree in later weeks than in earlier weeks (online Supporting Information, figure).
Younger age, being female, greater COVID‐19‐related work and social impairment, COVID‐19‐related financial distress, having a neurological or mental illness diagnosis, and recent adversity were each significantly associated with higher baseline depression and anxiety scores. In contrast, few factors were statistically associated with changes in symptoms of depression or anxiety over the seven surveys: degree of direct exposure to COVID‐19 was associated with less marked decline of symptoms of depression (quadratic change); being able to work from home and being female were associated with greater declines in symptoms of anxiety (linear change) (Supporting Information, table 1).
Symptom trajectories (growth mixture models)
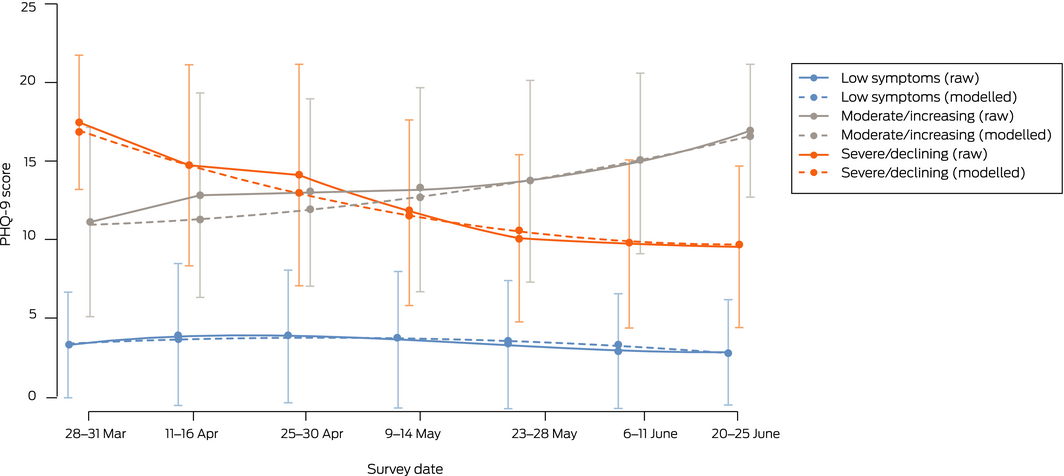
We identified three distinct trajectories for symptoms of depression (Box 3):
- low level symptoms throughout the study: 1053 participants (81.3%);
- moderate symptoms throughout the study: 127 participants (9.8%); and
- initially severe symptoms, then declining: 116 participants (9.0%).
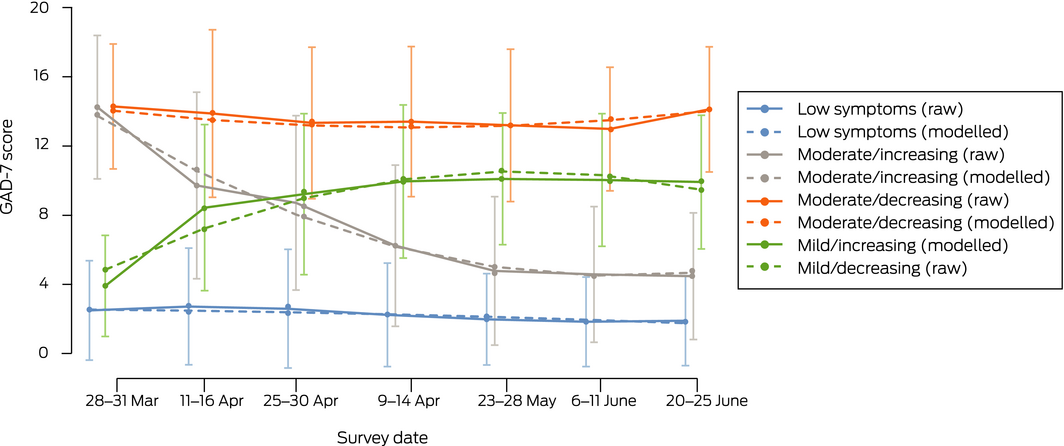
We identified four distinct trajectories of symptoms of anxiety (Box 4):
- low level symptoms throughout the study: 998 (77.0%);
- initially moderate symptoms, then increasing: 129 participants (10%);
- initially moderate symptoms, then declining: 68 participants (5.2%); and
- initially mild symptoms, then increasing for four surveys, then declining: 101 participants (7.8%).
Linear and quadratic changes for the consistently low anxiety and moderate depression symptom classes were not statistically significant. In contrast, linear and quadratic change estimates were significant for all other trajectories (Supporting Information, table 2).
Participants with current mental health diagnoses were significantly less likely to have low symptom trajectories than other trajectories for either depression or anxiety. For symptoms of depression, the odds of a severe/declining trajectory were greater than for a low trajectory for people who had experienced COVID‐related work or social impairment, and for those with neurological diagnoses; severe/declining and moderate trajectories were each more likely for younger participants, for people who had experienced COVID‐related financial distress or “other adversities”, while a moderate trajectory was more likely for people working from home (Box 5).
For symptoms of anxiety, the odds of a moderate/declining trajectory were greater than for a low trajectory for women and people working from home, and lower for those affected by bushfire smoke; the odds of a moderate/increasing trajectory were greater for younger people and those with fewer years of education; and the odds of moderate/increasing and moderate/declining trajectories were each higher for people with neurological diagnoses, who had experienced COVID‐19‐related financial distress, or were affected by “other adversity”. The odds of each trajectory were greater than for a low trajectory with people who had experienced COVID‐19‐related impairment (Box 5).
In post hoc analyses, multinomial logistic models were re‐estimated to examine factors associated with the moderate/increasing anxiety and the moderate depression trajectories. For symptoms of anxiety, exposure to bushfire (odds ratio [OR], 5.78; 95% confidence interval [CI], 1.25–26.9) or to bushfire smoke (OR, 2.79; 95% CI, 1.44–5.38) were associated with greater odds of a moderate/increasing than a moderate/decreasing trajectory, as were younger age (per year: OR, 0.97; 95% CI, 0.94–0.99) and COVID‐related job loss (OR, 3.16; 95% CI, 1.07–9.35). The odds of a moderate/declining trajectory were lower than of a moderate/increasing trajectory for women (OR, 2.27; 95% CI, 1.17–4.45) and people working from home (OR, 2.57; 95% CI, 1.02–6.48). The only significant association with symptoms of depression was exposure to bushfire (moderate/increasing v severe/declining trajectory: OR, 2.95; 95% CI, 1.24–7.04) (Supporting Information, table 3).
Discussion
We found that mean levels of symptoms of depression and anxiety early in the COVID‐19 pandemic were higher than estimated by earlier Australian population‐based surveys,9 but most adults in our study did not experience changes in mental health symptoms during the first three months of the pandemic. The prevalence of clinical levels of symptoms of depression and anxiety were higher than for other population samples, consistent with the cross‐sectional findings we have reported.10 However, our quadratic growth curve models suggest that distress during the pandemic was transient for most people, and unlikely to lead to increased incidence of depression or anxiety disorders, consistent with previous research on public health disasters.1,22,23 Nevertheless, economic and social changes can have a delayed impact on mental health. Direct contact with COVID‐19 had no significant effect on symptom levels, although greater COVID‐19‐related work and social impairment was associated with higher PHQ‐9 and GAD‐7 scores at baseline, as was COVID‐19‐related financial distress.
Few factors were robustly associated with changes in symptom levels over the seven surveys. In growth mixture models, however, we identified subgroups of participants with initially elevated symptoms of depression or anxiety and significant changes over time attributable to COVID‐19‐related consequences, particularly social and work impairment, and financial distress. People with mental health diagnoses were considerably less likely to have low symptom trajectories than people without such diagnoses. Other factors associated with trajectories other than low symptom levels included younger age, neurological diagnoses, and recent experience of adversity. For about 10% of respondents, symptom levels improved over time, which may reflect declining uncertainty, the relaxing of public health restrictions, and reduced anxiety about COVID‐19. However, exposure to the severe Australian bushfires of 2019–20 was associated with increasing symptom levels, suggesting that the cumulative effects of multiple disasters compound the risk of mental ill health. Symptom level changes for all trajectories apart from continuously low (for anxiety or depression) and moderate/increasing (for anxiety) were clinically meaningful (PHQ‐9: change of at least 5 points; GAD‐7: at least 4 points24,25).
Our findings highlight the influence on depression and anxiety symptoms of specific vulnerabilities and the degree of personal impact during a viral pandemic, consistent with previous reports on other types of disasters.1,26 Proximity to a catastrophic event or the degree of personal impact during a natural disaster or epidemic may also influence mental health after the event.22,27,28 Identifying and providing additional support for people at higher risk of poor mental health trajectories may help mitigate the impact of both the event and of associated public health measures.
Limitations
We undertook a longitudinal study of the mental health impact of a pandemic in a nationally representative sample. However, while the PHQ‐9 and GAD‐7 are robust measures of depression and anxiety, different outcomes may have been obtained had clinician‐administered diagnostic interviews been analysed. Second, the consequences of financial distress or extended quarantine restrictions may have effects over longer periods than that of our study; we followed up our cohort in early 2021 to assess longer term impacts, and will report these results separately. Similarly, the first survey may not have provided a genuine baseline measure of mental status, as public concerns about COVID‐19 were growing before public health restrictions were imposed. Third, people who engage in online market research panels may differ systematically from the broader population.29 Fourth, as the identified subgroups were derived from statistical models rather than theoretical groupings of change, further validation of the symptom trajectories may be required. Further, our multiple comparisons mean that type I errors for small effects are possible. Finally, while attrition was relatively low (41% overall) and the statistical models employed are robust to differential attrition,30 our sample may have become less representative of the Australian adult population as the study progressed.
Conclusion
We found no overall increases in the symptoms of depression and anxiety related to the COVID‐19 pandemic in Australia. However, about 19% of participants had initially elevated or subsequently increasing levels of depression, and about 23% had initially elevated or subsequently increasing levels of anxiety in the 12 weeks after public health restrictions were introduced. Several adverse events, such as bushfire, may have influenced COVID‐19‐related anxiety and depression symptom levels. Clinicians should be aware that people with mental health problems may be at greater risk of poor mental health during a public health crisis, as are those who experience financial distress or struggle to adjust to work or social change caused by the crisis. Our findings indicate the importance of the need for greater support and practical strategies for mitigating these risks, as recognising and responding to distress early may alter harmful trajectories. Population‐based primary and secondary prevention strategies to clinically and socially support vulnerable groups, including increased online and telephone mental health support, should be priorities for health and community services and governments during the COVID‐19 pandemic and future crises.
Box 1 – Baseline characteristics of the 1296 survey participants
|
Characteristic |
Survey participants: baseline |
Australian adult population21 |
|||||||||||||
|
|
|||||||||||||||
|
Number of participants |
1296 |
— |
|||||||||||||
|
Age (years), mean (SD) |
46.0 (17.3) |
— |
|||||||||||||
|
COVID‐19 impairment (WSAS), mean score (SD)* |
15.6 (9.3) |
— |
|||||||||||||
|
COVID‐19 exposure factors, mean number (SD)† |
0.8 (0.9) |
— |
|||||||||||||
|
Education (years), mean (SD) |
13.8 (2.6) |
— |
|||||||||||||
|
Age group (years) |
|
|
|||||||||||||
|
18–24 |
163 (12.6%) |
10.3% |
|||||||||||||
|
25–34 |
244 (18.8%) |
18.8% |
|||||||||||||
|
35–44 |
231 (17.8%) |
17.6% |
|||||||||||||
|
45–54 |
223 (17.2%) |
17.3% |
|||||||||||||
|
55–64 |
195 (15.0%) |
15.4% |
|||||||||||||
|
65 or more |
240 (18.5%) |
20.5% |
|||||||||||||
|
State/territory |
|
|
|||||||||||||
|
New South Wales |
409 (31.6%) |
32.2% |
|||||||||||||
|
Victoria |
313 (24.2%) |
24.9% |
|||||||||||||
|
Queensland |
249 (19.2%) |
20.3% |
|||||||||||||
|
Western Australia |
144 (11.1%) |
10.4% |
|||||||||||||
|
South Australia |
96 (7.4%) |
7.3% |
|||||||||||||
|
Tasmania |
36 (2.8%) |
2.3% |
|||||||||||||
|
Australian Capital Territory |
37 (2.9%) |
1.6% |
|||||||||||||
|
Northern Territory |
12 (0.9%) |
1.0% |
|||||||||||||
|
Remoteness |
|
|
|||||||||||||
|
Major city |
1021 (78.8%) |
72% |
|||||||||||||
|
Inner regional |
195 (15.0%) |
18% |
|||||||||||||
|
Outer regional |
73 (5.6%) |
8% |
|||||||||||||
|
Remote/very remote |
7 (0.6%) |
2% |
|||||||||||||
|
Gender (female) |
649 (50.1%) |
50.7% |
|||||||||||||
|
Lost job |
117 (9.0%) |
— |
|||||||||||||
|
Work from home |
173 (13.3%) |
— |
|||||||||||||
|
COVID‐19‐related financial distress |
421 (32.5%) |
— |
|||||||||||||
|
Any physical disease |
485 (37.4%) |
— |
|||||||||||||
|
Any neurological disease |
163 (12.6%) |
— |
|||||||||||||
|
Any mental disorder |
310 (23.9%) |
— |
|||||||||||||
|
Have partner |
853 (65.8%) |
— |
|||||||||||||
|
Live alone |
157 (12.1%) |
— |
|||||||||||||
|
Live with children |
406 (31.3%) |
— |
|||||||||||||
|
Affected by bushfire smoke |
607 (46.8%) |
— |
|||||||||||||
|
Affected by bushfire fire |
111 (8.6%) |
— |
|||||||||||||
|
Other adversity |
282 (21.8%) |
— |
|||||||||||||
|
|
|||||||||||||||
|
COVID‐19 = coronavirus disease 2019; SD = standard deviation; WSAS = Work and Social Adjustment Scale.17 * Data missing for seven participants at baseline † Direct COVID‐19 exposures counted here included: diagnosis of COVID‐19, awaiting test result, received negative result, currently directed to isolate, previously directed to isolate, currently voluntarily isolated, previously voluntarily isolated, contact with person with COVID‐19 diagnosis, family member in isolation, family member diagnosed with COVID‐19, know someone required to isolate, know someone diagnosed with COVID‐19, required to work from home. |
|||||||||||||||
Box 2 – Depression and anxiety scores for the 1296 survey participants during the seven survey waves
|
|
Respondents* |
Mean score (SD) |
Clinically significant symptoms† |
||||||||||||
|
|
|||||||||||||||
|
Depression (PHQ‐9) |
|
|
|
||||||||||||
|
28–31 March (baseline) |
1295 |
5.4 (5.9) |
263 (20.3%) |
||||||||||||
|
11–16 April |
969 |
5.8 (6.3) |
229 (23.6%) |
||||||||||||
|
25–30 April |
949 |
5.6 (6.1) |
208 (21.9%) |
||||||||||||
|
9–14 May |
907 |
5.2 (5.8) |
195 (21.5%) |
||||||||||||
|
23–28 May |
871 |
4.9 (5.6) |
167 (19.2%) |
||||||||||||
|
6–11 June |
812 |
4.7 (5.6) |
154 (19.0%) |
||||||||||||
|
20–25 June |
758 |
4.8 (5.7) |
139 (18.3%) |
||||||||||||
|
Anxiety (GAD–7) |
|
|
|
||||||||||||
|
28–31 March (baseline) |
1295 |
4.4 (5.2) |
212 (16.4%) |
||||||||||||
|
11–16 April |
969 |
4.6 (5.2) |
164 (16.9%) |
||||||||||||
|
25–30 April |
950 |
4.4 (5.1) |
163 (17.2%) |
||||||||||||
|
9–14 May |
907 |
4.1 (4.9) |
137 (15.1%) |
||||||||||||
|
23–28 May |
871 |
3.8 (4.7) |
112 (12.9%) |
||||||||||||
|
6–11 June |
812 |
3.7 (4.7) |
104 (12.8%) |
||||||||||||
|
20–25 June |
758 |
3.8 (4.8) |
102 (13.5%) |
||||||||||||
|
|
|||||||||||||||
|
GAD‐7 = Generalized Anxiety Disorder assessment; PHQ‐9 = Patient Health Questionnaire; SD = standard deviation. * That is, participants who provided responses to PHQ‐9 and GAD‐7 questions. † Scores of 10 points or more. |
|||||||||||||||
Box 3 – Latent class trajectories for symptoms of depression (PHQ‐9): raw means (with standard deviations) and estimated means (with standard deviations) from growth mixture models
Box 4 – Latent class trajectories for symptoms of anxiety (GAD‐7): raw means (with standard deviations) and estimated means (with standard deviations) from growth mixture models
Box 5 – Multinomial logistic regressions testing predictors of class membership for symptoms of depression (PHQ‐9) and anxiety (GAD‐7) trajectories: odds ratios with 95% confidence intervals
|
|
PHQ‐9 score trajectory class |
GAD‐7 score trajectory class |
|||||||||||||
|
Characteristic |
Severe/declining |
Moderate |
Moderate/increasing |
Moderate/declining |
Mild/increasing |
||||||||||
|
|
|||||||||||||||
|
Age (per year) |
0.98 |
0.98 |
0.96 |
0.99 |
0.99 |
||||||||||
|
COVID‐19‐related impairment (WSAS) (per point) |
1.04 |
1.02 |
1.05 |
1.04 |
1.07 |
||||||||||
|
COVID‐19 exposure (per exposure) |
1.09 |
0.80 |
0.94 |
0.96 |
0.86 |
||||||||||
|
Education (per year) |
0.96 |
1.02 |
0.87 |
0.96 |
0.98 |
||||||||||
|
Lost job |
1.04 |
1.21 |
1.32 |
0.42 |
0.48 |
||||||||||
|
Work from home |
0.94 |
1.91 |
1.02 |
2.63 |
1.05 |
||||||||||
|
Gender (women) |
1.24 |
0.93 |
0.96 |
2.18 |
0.71 |
||||||||||
|
Any physical disease |
0.99 |
1.04 |
1.16 |
0.63 |
0.98 |
||||||||||
|
Any neurological disease |
1.98 |
1.07 |
2.23 |
2.77 |
1.36 |
||||||||||
|
Any mental disorder |
4.95 |
4.24 |
5.32 |
3.44 |
2.24 |
||||||||||
|
Have partner |
0.88 |
0.78 |
1.15 |
1.52 |
0.95 |
||||||||||
|
Live alone |
1.60 |
1.23 |
1.41 |
0.82 |
0.53 |
||||||||||
|
Live with children |
0.83 |
0.97 |
0.93 |
0.95 |
0.90 |
||||||||||
|
Affected by bushfire smoke |
1.02 |
1.33 |
1.22 |
0.44 |
0.96 |
||||||||||
|
Affected by bushfire fire |
0.51 |
1.52 |
1.30 |
0.22 |
0.91 |
||||||||||
|
Affected by other adversity |
1.93 |
2.30 |
1.89 |
1.88 |
1.58 |
||||||||||
|
COVID‐19‐related financial distress |
3.29 |
2.06 |
2.61 |
3.88 |
1.52 |
||||||||||
|
|
|||||||||||||||
|
COVID‐19 = coronavirus disease 2019; GAD‐7 = Generalised Anxiety Disorder‐7; PHQ‐9 = Patient Health Questionnaire‐9; WSAS = Work and Social Adjustment Scale. |
|||||||||||||||
Received 6 October 2020, accepted 27 January 2021
- Philip J Batterham1
- Alison L Calear1
- Sonia M McCallum1
- Alyssa R Morse1
- Michelle Banfield1
- Louise M Farrer1
- Amelia Gulliver1
- Nicolas Cherbuin2
- Rachael M Rodney Harris3
- Yiyun Shou4
- Amy Dawel4
- 1 Centre for Mental Health Research, Australian National University, Canberra, ACT
- 2 Centre for Research on Ageing, Health and Wellbeing, Australian National University, Canberra, ACT
- 3 National Centre for Epidemiology and Population Health, Australian National University, Canberra, ACT
- 4 Australian National University, Canberra, ACT
This project was supported by funding from the College of Health and Medicine at the Australian National University. Philip Batterham is supported by a National Health and Medical Research Council (NHMRC) fellowship (1158707), Alison Calear by NHMRC fellowships (1122544, 1173146), Louise Farrer by an Australian Research Council (ARC) Discovery Early Career Researcher Award (DECRA) fellowship (DE190101382), and Yiyun Shou by an ARC DECRA fellowship (DE180100015).
We gratefully acknowledge the team members who contributed to the design and management of the study: Kristen Murray, Michael Smithson, Tambri Housen, and Eryn Newman. We thank Angelica Trias for assisting with the literature review.
No relevant disclosures.
- 1. Pierce M, Hope H, Ford T, et al. Mental health before and during the COVID‐19 pandemic: a longitudinal probability sample survey of the UK population. Lancet Psychiatry 2020; 7: 883–892.
- 2. Brooks SK, Webster RK, Smith LE, et al. The psychological impact of quarantine and how to reduce it: rapid review of the evidence. Lancet 2020; 395: 912–920.
- 3. Rettie H, Daniels J. Coping and tolerance of uncertainty: predictors and mediators of mental health during the COVID‐19 pandemic. Am Psychol 2020; https://doi.org/10.1037/amp0000710 [online ahead of print].
- 4. Campion J, Javed A, Sartorius N, Marmot M. Addressing the public mental health challenge of COVID‐19. Lancet Psychiatry 2020; 7: 657–659.
- 5. Holmes EA, O’Connor RC, Perry VH, et al. Multidisciplinary research priorities for the COVID‐19 pandemic: a call for action for mental health science. Lancet Psychiatry 2020; 7: 547–560.
- 6. Pierce M, McManus S, Jessop C, et al. Says who? The significance of sampling in mental health surveys during COVID‐19. Lancet Psychiatry 2020; 7: 567–568.
- 7. Fisher JR, Tran TD, Hammarberg K, et al. Mental health of people in Australia in the first month of COVID‐19 restrictions: a national survey. Med J Aust 2020; 213: 458–464. https://www.mja.com.au/journal/2020/213/10/mental-health-people-australia-first-month-covid-19-restrictions-national
- 8. Daly M, Sutin AR, Robinson E. Longitudinal changes in mental health and the COVID‐19 pandemic: evidence from the UK Household Longitudinal Study. Psychol Med 2020; https://doi.org/10.1017/S0033291720004432 [online ahead of print].
- 9. Parliament of Australia, Department of Parliamentary Services. COVID‐19: a chronology of state and territory government announcements (up until 30. June 2020). Oct 2020. https://www.aph.gov.au/About_Parliament/Parliamentary_Departments/Parliamentary_Library/pubs/rp/rp2021/Chronologies/COVID-19StateTerritoryGovernmentAnnouncements (viewed Apr 2021).
- 10. Dawel A, Shou Y, Smithson M, et al. The effect of COVID‐19 on mental health and well‐being in a representative sample of Australian adults. Front Psychiatry 2020; 11: 579985.
- 11. Dawel A, Shou Y, Smithson M, et al. The Australian National COVID‐19 Mental Health, Behaviour and Risk Communication survey. Undated. https://psychology.anu.edu.au/research/projects/australian-national-covid-19-mental-health-behaviour-and-risk-communication-survey (viewed Apr 2021).
- 12. Kroenke K, Spitzer RL, Williams JBW, Lowe B. The Patient Health Questionnaire somatic, anxiety, and depressive symptom scales: a systematic review. Gen Hosp Psychiatry 2010; 32: 345–359.
- 13. González‐Sanguino C, Ausín B, Castellanos MA, et al. Mental health consequences during the initial stage of the 2020 coronavirus pandemic (COVID‐19) in Spain. Brain Behav Immun 2020; 87: 172–176.
- 14. Shi L, Lu ZA, Que JY, et al. Prevalence of and risk factors associated with mental health symptoms among the general population in China during the coronavirus disease 2019 pandemic. JAMA Netw Open 2020; 3: e2014053.
- 15. Li J, Yang Z, Qiu H, et al. Anxiety and depression among general population in China at the peak of the COVID‐19 epidemic. World Psychiatry 2020; 19: 249–250.
- 16. Lei L, Huang X, Zhang S, et al. Comparison of prevalence and associated factors of anxiety and depression among people affected by versus people unaffected by quarantine during the COVID‐19 epidemic in southwestern China. Med Sci Mon 2020; 26: e924609.
- 17. Mundt JC, Marks IM, Shear MK, Greist JM. The Work and Social Adjustment Scale: a simple measure of impairment in functioning. Br J Psychiatry 2002; 180: 461–464.
- 18. Muthén BO, Khoo ST. Longitudinal studies of achievement growth using latent variable modeling. Learn Individ Differ 1998; 10: 73–101.
- 19. Muthén B, Muthén LK. Integrating person‐centered and variable‐centered analyses: growth mixture modeling with latent trajectory classes. Alcohol Clin Exp Res 2000; 24: 882–891.
- 20. Nylund KL, Asparouhov T, Muthén BO. Deciding on the number of classes in latent class analysis and growth mixture modeling: a Monte Carlo simulation study. Struct Equ Modeling 2007; 14: 535–569.
- 21. Australian Bureau of Statistics. 2016 Census QuickStats. Updated 23 Oct 2017. https://quickstats.censusdata.abs.gov.au/census_services/getproduct/census/2016/quickstat/036 (viewed Apr 2021).
- 22. Jeong H, Yim HW, Song YJ, et al. Mental health status of people isolated due to Middle East Respiratory Syndrome. Epidemiol Health 2016; 38: e2016048.
- 23. Liao Q, Wu P, Wing Tak Lam W, et al. Trajectories of public psycho‐behavioural responses relating to influenza A (H7N9) over the winter of 2014–15 in Hong Kong. Psychol Health 2019; 34: 162–180.
- 24. Löwe B, Unnützer J, Callahan CM, et al. Monitoring depression treatment outcomes with the Patient Health Questionnaire‐9. Med Care 2004; 42: 1194–1201.
- 25. Toussaint A, Hüsing P, Gumz A, et al. Sensitivity to change and minimal clinically important difference of the 7‐item Generalized Anxiety Disorder Questionnaire (GAD‐7). J Affect Disord 2020; 265: 395–401.
- 26. Allen J, Brown LM, Alpass FM, Stephens CV. Longitudinal health and disaster impact in older New Zealand adults in the 2010–2011 Canterbury earthquake series. J Gerontol Soc Work 2018; 61: 701–718.
- 27. Jose R. Mapping the mental health of residents after the 2013 Boston marathon bombings. J Trauma Stress 2018; 31: 480–486.
- 28. Schwartz RM, Gillezeau CN, Liu B, et al. Longitudinal Impact of Hurricane Sandy exposure on mental health symptoms. Int J Environ Res Public Health 2017; 14: 957.
- 29. Chang L, Krosnick JA. National surveys via RDD telephone interviewing versus the internet: comparing sample representativeness and response quality. Public Opin Q 2009; 73: 641–678.
- 30. Muthén B, Kaplan D, Hollis M. On structural equation modeling with data that are not missing completely at random. Psychometrika 1987; 52: 431–462.
Abstract
Objectives: To estimate initial levels of symptoms of depression and anxiety, and their changes during the early months of the COVID‐19 pandemic in Australia; to identify trajectories of symptoms of depression and anxiety; to identify factors associated with these trajectories.
Design, setting, participants: Longitudinal cohort study; seven fortnightly online surveys of a representative sample of 1296 Australian adults from the beginning of COVID‐19‐related restrictions in late March 2020 to mid‐June 2020.
Main outcome measures: Symptoms of depression and anxiety, measured with the Patient Health Questionnaire (PHQ‐9) depression and Generalised Anxiety Disorder (GAD‐7) scales; trajectories of symptom change.
Results: Younger age, being female, greater COVID‐19‐related work and social impairment, COVID‐19‐related financial distress, having a neurological or mental illness diagnosis, and recent adversity were each significantly associated with higher baseline depression and anxiety scores. Growth mixture models identified three latent trajectories for depression symptoms (low throughout the study, 81% of participants; moderate throughout the study, 10%; initially severe then declining, 9%) and four for anxiety symptoms (low throughout the study, 77%; initially moderate then increasing, 10%; initially moderate then declining, 5%; initially mild then increasing before again declining, 8%). Factors statistically associated with not having a low symptom trajectory included mental disorder diagnoses, COVID‐19‐related financial distress and social and work impairment, and bushfire exposure.
Conclusion: Our longitudinal data enabled identification of distinct symptom trajectories during the first three months of the COVID‐19 pandemic in Australia. Early intervention to ensure that vulnerable people are clinically and socially supported during a pandemic should be a priority.