


The known: In early 2020, Australian ICUs reported they could increase bed numbers by 191% if required, but the limited availability of ventilators and nurses rendered realising such a surge unlikely.
The new: A total of 2183 staffed ICU beds are available in Australia, 8.2% fewer than in 2020. The ventilator shortage of 2020 has been overcome. ICU capacity can be expanded if required, but staff availability, particularly of critical care nurses, imposes limits. Resource levels vary markedly both within and between states.
The implications: Strategies that safely maximise the availability of appropriately trained staff, and coordinated approaches to matching of ICU capacity with demand, are urgently needed.
In March 2020, the Australian and New Zealand Intensive Care Society (ANZICS) surveyed Australian intensive care units (ICUs) to assess their capacity to respond to the coronavirus disease 2019 (COVID‐19) pandemic.1 A total of 2378 fully staffed ICU beds, configured and equipped to ICU standards, were available, with a maximum surge capacity of 4258 additional ICU beds in a potential disaster scenario. However, the number of available ventilators was insufficient to equip this number of beds, and the need for up to 40 000 additional nurses to staff these beds also made the maximal surge bed number unfeasible.1
The experience during COVID‐19 outbreaks in the United States and Europe during 2020 has been that outcomes for patients requiring intensive care are significantly poorer if ICUs need to adopt “surge” approaches, which entail compromised staffing arrangements and providing care in unfamiliar environments.2,3,4,5,6
In this article, we provide updated information on hospital intensive care capacity in Australia. We assessed changes in bed numbers and equipment since our 2020 survey, during a period of real world experience with managing COVID‐19, including in ICUs. Public health and social measures, test, trace, isolate and quarantine strategies, and high vaccination coverage in Australia all had the aim of containing the number of serious COVID‐19 infections to a level that did not overwhelm health systems.7 Instead of focusing on a disaster scenario, we therefore estimated maximum ICU capacity while maintaining pre‐pandemic staffing structures, and did so during a period when the numbers of patients with COVID‐19 in intensive care differed markedly between states. We also collected data regarding ICU infection control infrastructure, such as negative pressure ventilation rooms, and differences in the availability of these resources between states and between metropolitan and rural and regional areas.
Methods
To facilitate comparability of results, the 2021 surge survey design was adapted from the 2020 version.1 An 18‐question survey was piloted in a Delphi process with eight senior clinicians, and then refined to the final 16‐question version (Supporting Information, table 1). To evaluate their face validity, the preliminary questions were sent to four ICU directors. Consistent with definitions used by the ANZICS Critical Care Resources (CCR) registry,8 “available bed” referred to a fully staffed and equipped ICU bed (an “open” bed), whereas “additional physical ICU bed” referred to an added equipped bed space that was not staffed. CCR registry data for 2019‒20 informed estimates of baseline medical and nursing staffing under pre‐pandemic conditions for each ICU. Estimated additional staff numbers were those reported in the survey as being available for one month in the event of a surge. For calculating population levels of ICU bed availability, Australian Bureau of Statistics population data for 31 December 2020 were used.9
Survey distribution
The survey was distributed via the ANZICS email list to the directors of each of the 194 ICUs in Australia (Supporting Information, table 2) on 30 August 2021; it was completed in SurveyMonkey by the ICU director, nurse unit manager, or a senior delegate. Five rural high dependency units (four in New South Wales, one in Victoria) were included in the survey; they reported on high dependency beds that could be used for providing intensive care.
Analysis
The reliability of survey responses regarding available and additional physical beds was assessed by cross‐checking data against site data in the ANZICS CCR registry and the Critical Health Resources Information System (CHRIS). Survey respondents were contacted to resolve any discrepancies. If isolation areas within or outside the ICU were reported in addition to negative pressure and single ICU rooms, the number of additional isolation areas was defined as the difference between the reported number of isolation area beds and the numbers of negative pressure and single ICU rooms. CCR registry medical and nursing staffing data for each ICU (2019‒20) were used to generate the nursing fulltime equivalent (FTE) to available bed ratio for each state and territory. This ratio was then applied to the number of additional available registered nurses reported by each ICU to estimate the number of additional staffed beds that could be opened under pre‐pandemic staffing models in each jurisdiction. We did not include locum or agency staff in our analysis because their availability is limited, with a single pool available to several ICUs.
Ethics approval
The study was approved by the Alfred Human Research Ethics Committee (543/21).
Results
Survey responses were received from all 194 ICUs between 30 August and 9 September 2021 (Supporting Information, table 3). The response rate was 100% for nine of the 16 questions, and 95‒99% for seven questions (Supporting Information, table 4).
Intensive care unit beds
A total of 2183 staffed ICU beds were currently available in the 194 Australian ICUs (including five rural high dependency units); 884 were in New South Wales (40%). The number of ICU beds available in Australia was thus 195 fewer (8.2%) than in 2020. The number had dropped in all jurisdictions, but more markedly in rural/regional (59 fewer beds, 18% decline) and private ICUs (140 fewer beds, 18% decline). A total of 813 additional physical ICU bed spaces were available in ICUs; surge areas outside ICUs could maximally provide 2627 ICU bed spaces, for a total of 5623 beds (Box 1).
Negative pressure and single intensive care unit rooms
Across Australia, 359 negative pressure rooms, 1351 ICU single rooms, and 472 additional bed spaces in areas that could be isolated were available, providing a total of 2182 rooms or bed spaces that could be used to isolate patients with COVID‐19 for infection control and to protect staff and patients, including 890 in NSW (41%) (Box 2).
Equipment
The surveyed hospitals had a total of 7196 ventilators, 796 haemofilter/dialysis machines, and 165 extracorporeal membrane oxygenation (ECMO) machines (Box 3).
Staffing
The 188 ICUs that provided responses to questions 14 to 16 reported that maximally 1882.7 FTE ICU nurses, 510.5 FTE junior medical staff, and 357.1 FTE senior medical staff could be provided as additional ICU staff during a surge for one month (Box 4). Based on the pre‐pandemic ratio of 4.91 FTE registered nurses per available ICU bed (Supporting Information, table 5), these additional staff could facilitate opening 383 of the 813 additional physical ICU beds (47%), but not the additional bed spaces outside ICUs.
Discussion
The survey results reflect the realistic capacity of ICUs in Australia to respond to the COVID‐19 pandemic while maintaining high quality patient care with pre‐pandemic staffing models, as assessed by ICU directors between 30 August and 9 September 2021. Our main findings are that staffing capacity, particularly with respect to registered nurses, is the factor most likely to constrain the potential of ICUs to surge in response to the pandemic; that fewer ICU beds are currently available than in March 2020; that the availability of staffed beds differs according to ICU location and classification, suggesting that matching of ICU resources and capacity to demand requires attention; and that the equipment shortfalls we previously reported1 have been remediated. The number of ventilators is now sufficient for equipping every ICU bed, probably because ventilators were purchased in preparation for the first wave of the COVID‐19 pandemic. Some jurisdictions also maintain central stores of ventilators and other equipment that were not assessed by our survey.
The reduction in number of available ICU beds since last year was not uniform across all ICU types: bed capacity in tertiary ICUs increased slightly, but declined in rural/regional and private ICUs. These findings may be the result of asking for real time operational information from ICUs during the pandemic, when reduced staff numbers caused by work restrictions, leave, redeployment to other pandemic activity, cancellations of surgery, and active re‐development of ICU infrastructure led to closure of some ICU beds. Appropriate critical care nurse‐to‐patient ratios must be maintained in ICUs, and the availability of trained nursing staff is consequently rate‐limiting.
The estimated maximum total of 5623 ICU beds would be a 158% increase in the number of available beds, substantially lower than the 191% increase estimated by the 2020 surge survey. This probably reflects the difference between planning in 2020 for a potential disaster scenario with a massive and unavoidable patient influx, and planning in 2021, when estimates are informed by the real life experience of managing COVID‐19 in ICUs. The number of physical bed spaces in ICUs and genuinely ICU‐capable areas, such as theatre recovery areas, is slightly higher than reported last year (3362 v 3010), suggesting that the true surge capacity has not changed.
Estimated additional staffing needs were based on the ability to expand ICU capacity for one month, but increased capacity could be required for much longer. The sustainability of pre‐pandemic staffing levels and traditional staffing models under these conditions is uncertain. As early as April 2020, the COVID‐19 pandemic was associated with substantial psychological distress, including anxiety and burnout, among Australian health care workers.10 Ensuring healthy and sustainable staffing models should be a health policy priority, and urgently requires further consideration, both for the short and longer terms.
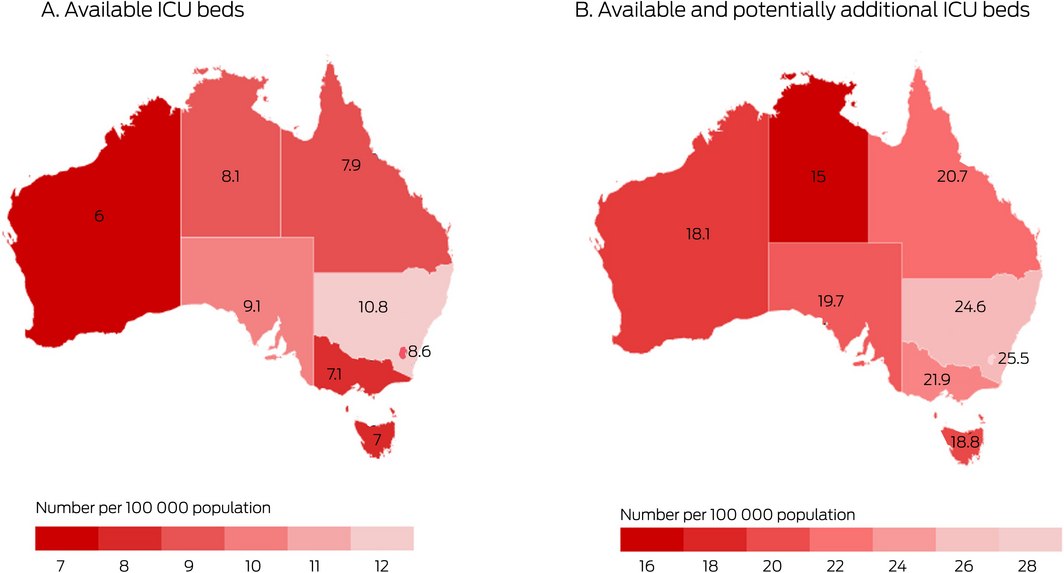
Demand for ICU services during the pandemic has not been uniform, and ICU resources are not evenly distributed across Australia (Box 5). Differences in the additional registered nursing FTEs that could be provided suggest that the ability to respond to a surge in demand varies between and within states. The Critical Health Resources Information System (CHRIS), which collects data on ICU activity, resources, and demand throughout Australia, was used in 2020 to identify ICUs under strain in Melbourne and to facilitate safe transfer of patients from the ICUs with greatest demand to ICUs with the greatest capacity.11,12,13
Three to five patients are transferred from regional ICUs to metropolitan or tertiary ICUs on a typical day.14 For several reasons, rural and regional ICUs are at particular risk of demand exceeding capacity should the number of cases of serious COVID‐19 rise, including the strain on inter‐hospital transport systems, and the fact that cancelling elective surgery brings less relief than in metropolitan centres, as the elective ICU caseload is already generally lower. The differences between states in ICU bed numbers per population may render those with lower capacity particularly vulnerable to increased strain as public health restrictions ease.
Limitations
The survey asked about resources that were “available today”, but the number of available beds may vary between days, and we may not have captured ICU beds that were temporarily closed or were about to open. Differences between the numbers of ICU beds and isolation areas and those recorded by health departments may reflect sampling at different time points, data to health departments being reported by hospital administrators rather than by clinicians, and different inclusion criteria for hospitals; for instance, small rural high dependency units may not be included in health department surveys. Caring for critically ill patients requires allied health professionals, and medication shortfalls can also limit operating capacity; neither of these factors were examined in our study.
Conclusion
The reported number of available staffed ICU beds in August/September 2021 was lower than in March 2020. Equipment shortages have been remediated, and there are now sufficient ventilators for every ICU bed. ICU capacity can be increased in response to greater demand, but is ultimately constrained by the availability of appropriate staff. Fewer than half the potentially additional physical ICU beds could be opened with currently available staff levels while maintaining pre‐pandemic models of care. Planning to act on operational problems in matching ICU resources and capacity to demand is essential.
Box 1 – Intensive care unit (ICU) beds in 194 public and private ICUs in Australia, 2020 and 2021
|
|
|
2020 |
2021 |
||||||||||||
|
ICU location/classification |
Number of ICUs |
Available, staffed ICU beds |
Available, staffed ICU beds |
Additional physical bed spaces in ICUs |
Additional bed spaces outside ICUs |
Total beds |
|||||||||
|
|
|||||||||||||||
|
Australia |
194 |
2378 (9.3) |
2183 (8.5) |
813 |
2627 |
5623 (21.9) |
|||||||||
|
State/territory |
|
|
|
|
|
|
|||||||||
|
Australian Capital Territory |
5 |
52 (12.1) |
37 (8.6) |
24 |
49 |
110 (25.5) |
|||||||||
|
New South Wales |
67 |
929 (11.4) |
884 (10.8) |
256 |
869 |
2009 (24.6) |
|||||||||
|
Northern Territory |
2 |
24 (9.7) |
20 (8.1) |
5 |
12 |
37 (15) |
|||||||||
|
Queensland |
42 |
418 (8.0) |
408 (7.9) |
178 |
490 |
1076 (20.7) |
|||||||||
|
South Australia |
12 |
201 (11.4) |
161 (9.1) |
61 |
127 |
349 (19.7) |
|||||||||
|
Tasmania |
5 |
59 (10.9) |
38 (7.0) |
26 |
38 |
102 (18.8) |
|||||||||
|
Victoria |
48 |
516 (7.7) |
476 (7.1) |
211 |
769 |
1456 (21.9) |
|||||||||
|
Western Australia |
13 |
179 (6.7) |
159 (6.0) |
52 |
273 |
484 (18.1) |
|||||||||
|
Classification* |
|
|
|
|
|
|
|||||||||
|
Tertiary |
35 |
812 |
835 |
255 |
1009 |
2099 |
|||||||||
|
Paediatric |
9 |
135 |
130 |
39 |
71 |
240 |
|||||||||
|
Metropolitan |
34 |
316 |
302 |
177 |
346 |
825 |
|||||||||
|
Rural/regional |
43 |
321 |
262 |
173 |
501 |
936 |
|||||||||
|
Private |
73 |
794 |
654 |
169 |
700 |
1523 |
|||||||||
|
|
|||||||||||||||
|
* According to ANZICS CORE definitions.8 |
|||||||||||||||
Box 2 – Isolation rooms in 194 public and private intensive care units (ICUs) in Australia, 2021
|
ICU location/classification |
ICU negative pressure rooms |
ICU single rooms |
Additional isolation bed spaces* |
Total isolation spaces |
|||||||||||
|
|
|||||||||||||||
|
Australia |
359 |
1351 |
472 |
2182 (8.5) |
|||||||||||
|
State/territory |
|
|
|
|
|||||||||||
|
Australian Capital Territory |
3 |
23 |
3 |
29 (6.7) |
|||||||||||
|
New South Wales |
169 |
557 |
164 |
890 (10.9) |
|||||||||||
|
Northern Territory |
6 |
11 |
0 |
17 (6.9) |
|||||||||||
|
Queensland |
64 |
217 |
92 |
373 (7.2) |
|||||||||||
|
South Australia |
20 |
103 |
8 |
131 (7.4) |
|||||||||||
|
Tasmania |
7 |
12 |
1 |
20 (3.7) |
|||||||||||
|
Victoria |
67 |
334 |
176 |
577 (8.7) |
|||||||||||
|
Western Australia |
23 |
94 |
28 |
145 (5.4) |
|||||||||||
|
Classification† |
|
|
|
|
|||||||||||
|
Tertiary |
178 |
494 |
197 |
869 |
|||||||||||
|
Paediatric |
16 |
103 |
8 |
127 |
|||||||||||
|
Metropolitan |
67 |
227 |
91 |
385 |
|||||||||||
|
Rural/regional |
54 |
204 |
105 |
363 |
|||||||||||
|
Private |
44 |
323 |
71 |
438 |
|||||||||||
|
|
|||||||||||||||
|
* In and outside ICUs. † According to ANZICS CORE definitions.8 |
|||||||||||||||
Box 3 – Ventilators, dialysis machines, and extracorporeal membrane oxygenation (ECMO) machines available to 194 public and private intensive care units (ICUs) in Australia, 2021
|
ICU location/classification |
Ventilators |
Haemofilters/dialysis machines |
ECMO machines |
||||||||||||
|
Standard ICU style |
Anaesthetic machine |
Non‐invasive* |
Other |
All |
|||||||||||
|
|
|||||||||||||||
|
Australia |
3404 |
2087 |
829 |
876 |
7196 |
796 |
165 |
||||||||
|
State/territory |
|
|
|
|
|
|
|
||||||||
|
Australian Capital Territory |
52 |
44 |
10 |
12 |
118 |
18 |
2 |
||||||||
|
New South Wales |
1108 |
675 |
384 |
280 |
2447 |
229 |
53 |
||||||||
|
Northern Territory |
33 |
9 |
5 |
14 |
61 |
13 |
0 |
||||||||
|
Queensland |
636 |
500 |
195 |
134 |
1465 |
164 |
26 |
||||||||
|
South Australia |
215 |
129 |
15 |
34 |
393 |
38 |
11 |
||||||||
|
Tasmania |
80 |
52 |
1 |
38 |
171 |
25 |
8 |
||||||||
|
Victoria |
1122 |
477 |
157 |
267 |
2023 |
249 |
56 |
||||||||
|
Western Australia |
158 |
201 |
62 |
97 |
518 |
60 |
9 |
||||||||
|
Classification† |
|
|
|
|
|
|
|
||||||||
|
Tertiary |
1569 |
645 |
311 |
381 |
2906 |
384 |
118 |
||||||||
|
Paediatric |
165 |
50 |
62 |
43 |
320 |
27 |
19 |
||||||||
|
Metropolitan |
611 |
315 |
160 |
141 |
1227 |
142 |
12 |
||||||||
|
Rural/regional |
472 |
225 |
168 |
162 |
1027 |
110 |
2 |
||||||||
|
Private |
587 |
852 |
128 |
149 |
1716 |
133 |
14 |
||||||||
|
|
|||||||||||||||
|
* Capable of delivering invasive ventilation. † According to ANZICS CORE definitions.8 |
|||||||||||||||
Box 4 – Additional intensive care unit (ICU) staff that could be provided for 188 public and private ICUs in Australia, 2021
|
|
Additional fulltime equivalent positions |
|
|||||||||||||
|
ICU location |
Senior medical |
Junior medical |
Critical care nursing |
Additional staffed ICU beds available* |
|||||||||||
|
|
|||||||||||||||
|
Australia |
357.1 |
510.5 |
1882.7 |
383.4 |
|||||||||||
|
State/territory |
|
|
|
|
|||||||||||
|
Australian Capital Territory |
2.0 |
12.0 |
35.0 |
6.3 |
|||||||||||
|
New South Wales |
149.2 |
173.5 |
574.3 |
140.1 |
|||||||||||
|
Northern Territory |
5.0 |
16.0 |
25.0 |
5.0 |
|||||||||||
|
Queensland |
78.9 |
136.0 |
364.0 |
64.5 |
|||||||||||
|
South Australia |
32.5 |
47.0 |
299.0 |
53.8 |
|||||||||||
|
Tasmania |
4.0 |
18.0 |
71.0 |
10.5 |
|||||||||||
|
Victoria |
69.5 |
84.0 |
358.0 |
66.7 |
|||||||||||
|
Western Australia |
16.0 |
24.0 |
156.4 |
31.2 |
|||||||||||
|
|
|||||||||||||||
|
* Based on number of registered nurses per available ICU bed for each jurisdiction during the pre‐pandemic period (source: ANZICS Critical Care Resources registry data 2019‒20; Supporting Information, table 5). |
|||||||||||||||
Received 30 September 2021, accepted 8 October 2021
- Edward Litton1,2
- Sue Huckson3
- Shaila Chavan3
- Tamara Bucci3
- Anthony Holley4
- Evan Everest5
- Sean Kelly6
- Steven McGloughlin7
- Johnny Millar8
- Nhi Nguyen9,10
- Mark Nicholls11
- Paule Secombe12
- David Pilcher3,7
- 1 Fiona Stanley Hospital, Perth, WA
- 2 The University of Western Australia, Perth, WA
- 3 Centre for Outcome and Resource Evaluation (CORE), Australian and New Zealand Intensive Care Society (ANZICS), Melbourne, VIC
- 4 Royal Brisbane and Women's Hospital, Brisbane, QLD
- 5 Flinders Medical Centre, Adelaide, SA
- 6 Central Coast Local Health District, Charmhaven, NSW
- 7 The Alfred Hospital, Melbourne, VIC
- 8 Royal Children’s Hospital, Melbourne, VIC
- 9 NSW Agency for Clinical Innovation, Sydney, NSW
- 10 Nepean Hospital, Penrith, NSW
- 11 St Vincent's Hospital Sydney, Sydney, NSW
- 12 Alice Springs Hospital, Alice Springs, NT
We thank all data collectors and clinicians, particularly the directors and nurse unit managers of all 194 Australian ICUs who contributed to this study.
No relevant disclosures.
- 1. Litton E, Bucci T, Chavan S, et al. Surge capacity of intensive care units in case of acute increase in demand caused by COVID‐19 in Australia. Med J Aust 2020; 212: 463–467. https://www.mja.com.au/journal/2020/212/10/surge‐capacity‐intensive‐care‐units‐case‐acute‐increase‐demand‐caused‐covid‐19
- 2. Kadri SS, Sun J, Lawandi A, et al. Association between caseload surge and COVID‐19 survival in 558 US hospitals, March to August 2020. Ann Intern Med 2021; 174: 1240–1251.
- 3. Toth AT, Tatem KS, Hosseinipour N, et al. Surge and mortality in ICUs in New York City’s public healthcare system. Crit Care Med 2021; 49: 1439–1450.
- 4. Bravata DM, Perkins AJ, Myers LJ, et al. Association of intensive care unit patient load and demand with mortality rates in US Department of Veterans Affairs hospitals during the COVID‐19 pandemic. JAMA Netw Open 2021; 4: e2034266.
- 5. Gupta S, Hayek SS, Wang W, et al; STOP‐COVID Investigators. Factors associated with death in critically ill patients with coronavirus disease 2019 in the US. JAMA Intern Med 2020; 180: 1436–1447.
- 6. Taccone FS, Van Goethem N, De Pauw R, et al. The role of organizational characteristics on the outcome of COVID‐19 patients admitted to the ICU in Belgium [letter]. Lancet Reg Health Eur 2021; 2: 100019.
- 7. Australian Government. National plan to transition Australia’s national COVID‐19 response. 30 July 2021. https://www.pm.gov.au/sites/default/files/media/national‐plan‐to‐transition‐australias‐national‐covid‐19‐response‐30‐july‐2021.pdf (viewed Sept 2021).
- 8. ANZICS Centre for Outcome and Resource Evaluation. 2020 report. https://www.anzics.com.au/annual‐reports (viewed Oct 2021).
- 9. Australian Bureau of Statistic. National, state and territory population. Reference period: December 2020. 17 June 2021. https://www.abs.gov.au/statistics/people/population/national‐state‐and‐territory‐population/dec‐2020 (viewed Sept 2021).
- 10. Dobson H, Malpas CB, Burrell AJ, et al. Burnout and psychological distress amongst Australian healthcare workers during the COVID‐19 pandemic. Australas Psychiatry 2021; 29: 26–30.
- 11. Painvin B, Messet H, Rodriguez M, et al. Inter‐hospital transport of critically ill patients to manage the intensive care unit surge during the COVID‐19 pandemic in France. Ann Intensive Care 2021; 11: 54.
- 12. Pilcher D, Coatsworth NR, Rosenow M, McClure J. A national system for monitoring intensive care unit demand and capacity: the Critical Health Resources Information System (CHRIS). Med J Aust 2021; 214: 297–298.e1. https://www.mja.com.au/journal/2021/214/7/national‐system‐monitoring‐intensive‐care‐unit‐demand‐and‐capacity‐critical
- 13. Pilcher D, Duke G, Rosenow M, et al. Assessment of a novel marker of ICU strain, the ICU Activity Index, during the COVID‐19 pandemic in Victoria, Australia. Crit Care Resusc 2021; 23: 300–307.
- 14. Secombe P, Brown A, Bailey M, et al. Characteristics and outcomes of patients admitted to regional and rural intensive care units in Australia. Crit Care Resusc 2020; 22: 335–343.
Abstract
Objectives: To describe the short term ability of Australian intensive care units (ICUs) to increase capacity in response to heightened demand caused by the COVID‐19 pandemic.
Design: Survey of ICU directors or delegated senior clinicians (disseminated 30 August 2021), supplemented by Australian and New Zealand Intensive Care Society (ANZICS) registry data.
Setting: All 194 public and private Australian ICUs.
Main outcome measures: Numbers of currently available and potentially available ICU beds in case of a surge; available levels of ICU‐relevant equipment and staff.
Results: All 194 ICUs responded to the survey. The total number of currently open staffed ICU beds was 2183. This was 195 fewer (8.2%) than in 2020; the decline was greater for rural/regional (18%) and private ICUs (18%). The reported maximal ICU bed capacity (5623) included 813 additional physical ICU bed spaces and 2627 in surge areas outside ICUs. The number of available ventilators (7196) exceeded the maximum number of ICU beds. The reported number of available additional nursing staff would facilitate the immediate opening of 383 additional physical ICU beds (47%), but not the additional bed spaces outside ICUs.
Conclusions: The number of currently available staffed ICU beds is lower than in 2020. Equipment shortfalls have been remediated, with sufficient ventilators to equip every ICU bed. ICU capacity can be increased in response to demand, but is constrained by the availability of appropriately trained staff. Fewer than half the potentially additional physical ICU beds could be opened with currently available staff numbers while maintaining pre‐pandemic models of care.