


The known: Data on late mortality in people with cancer, and the relative contributions of cancer and non‐cancer causes to mortality, are limited.
The new: Long term mortality among people with cancer alive five years after diagnosis exceeds that of the general population. Cardiovascular disease is a major competing cause of death; from 13 years after diagnosis, the cumulative number of deaths exceed that of those attributed to cancer.
The implications: Cancer control systems should incorporate monitoring of long term outcomes, including non‐cancer mortality. Mitigation of risk factors for premature death, particularly from cardiovascular disease, is needed.
Advances in the diagnosis and treatment of cancer have increased the number of cancer survivors, many of whom have comorbid chronic conditions.1,2,3 Cancer and its treatment can exacerbate existing conditions and lead to new ones and competing mortality.4,5 In order to develop better models of care, it is important to understand the relative contribution of comorbidity to mortality, especially for long term survivors, whose survival ideally should approximate that of people without cancer.
Few studies have compared the relative contributions of cancer and non‐cancer causes to mortality among people with cancer. In 2016, a study of death records from the United States Surveillance, Epidemiology and End Results (SEER) database indicated that the comparative risks of cancer and non‐cancer death differed markedly by cancer type, and that more than 40% of non‐cancer deaths were from cardiovascular disease.6 In Australia, an analysis of 1946 non‐cancer deaths among 21 000 people with cancer found cardiovascular disease to be the most frequent cause of death, and that the standardised mortality ratio (SMR) for cardiovascular disease was higher than for people without cancer.7 Both studies found that SMRs were highest during the first year after diagnosis, probably reflecting the toxicity of anti‐cancer treatment. In the Korean national cancer registry study, including nearly 3 million patients, 87% of the more than one million deaths were attributable to cancer, but cardiovascular disease increased 20‐fold during 2000–2016 and the risk of suicide was higher than in the general population.8
These three studies raised awareness of competing causes of death among people with cancer. However, their inclusion of both early and later deaths made interpretation of their findings difficult. Acute treatment toxicity, rather than cancer itself, can contribute to early death, which may be attributed to cancer rather than organ failure. Patients with a comorbid condition may not be offered the most effective cancer treatment, leading to selection bias. Further, cancer‐specific mortality for these patients may be higher because of less effective treatment, and they may be at greater risk of treatment toxicity and death because of their comorbid conditions.
Only one population‐level study in the past 20 years has examined late mortality in adults with cancer, a Korean analysis of national cancer registry data (including 26 498 deaths). It found that the SMR for patients alive five years after diagnosis (median follow‐up, 7.9 years) was 2.56; higher mortality was primarily driven by cancer‐related deaths, but 24% of deaths were from causes other than cancer.9 The risks of non‐cancer death (except for suicide) were lower than for the general population, and the cardiovascular death rate was similar to that for the general population.
No other studies of late mortality have included adult patients with cancers of diverse tumour types. We therefore examined the causes of death among South Australians with cancer alive five years after diagnosis, and to compare mortality rates for this group with those of the general population.
Methods
In our retrospective cohort study, we analysed data from the South Australian Cancer Registry (SACR). Data for all patients with invasive cancers diagnosed during 1 January 1990 – 31 December 1999 and alive five years after their index cancer diagnosis were included, with follow‐up data until death or 31 December 2016 (final censoring date), whichever occurred first.
Patients’ index cancer diagnoses and demographic data — age, sex, ethnic background, Socio‐Economic Indexes for Areas (SEIFA) Index of Relative Socio‐economic Disadvantage (IRSD) category for area of residence10 — were provided by the SACR. The SA–Northern Territory DataLink (SA‐NT DataLink) provided linked death data from Australian birth, death and marriage registries.
The outcomes of interest were time and cause of death. International Classification of Diseases (ICD)‐9 codes were provided for deaths prior to 2007, and ICD‐10 codes for deaths from 2007. ICD‐9 codes were converted to ICD‐10 codes using the SEER program conversion tables.11 Given the small numbers in some categories, the 73 ICD cancer categories were collapsed to ten categories. Causes of death were classified according to World Health Organization recommendations.12
Statistical analysis
All‐cause and cancer‐specific mortality were calculated for each cancer group. Overall mortality and mortality by index cancer diagnosis topography were estimated in survival analyses. Patient study time was calculated from their index cancer diagnosis until death or 31 December 2016, whichever occurred first. The cumulative incidence function for mortality is reported, using a competing risks model to explore cancer cause‐specific mortality, adjusted for other causes of death. The cumulative incidence function applies an overall survival function that counts deaths from competing events as well as the event of interest, thereby reducing the risk of overestimating the probability of death from the event type of interest.13 The impact on survival (all‐cause and cancer cause‐specific mortality) of patients’ characteristics was examined in multivariable Cox regression models; adjusted hazard ratios are reported with 95% confidence intervals (CIs).
Overall mortality rates were compared with those for the SA population using standard cohort techniques.14,15 As the life table for SA was available only for 1995–2015,16,17,18 data for patients diagnosed during 1995–1999 (about half the study population) were used to compare overall all‐cause mortality with that of the SA population; the censoring date was accordingly set to 31 December 2015 for this analysis, and the number of person‐years at risk calculated from five years after first diagnosis to the censoring date. The 429 people in the 1995–2015 study subsample with multiple cancers (2.4%) were excluded from this analysis.
The SMR was defined as the ratio of deaths in the study group to the estimated number of deaths in the corresponding component of the general population, calculated from the number of person‐years at risk for each specific sex, 5‐year age group, and one‐year calendar period stratum and the corresponding population mortality rate. Cardiovascular disease was defined by the ICD‐10 codes I10–I15, I20–I25, I26–I28, I34–I38, I42, I47–I49, I50–I51, I60–I71.
All analyses were conducted in Stata SE 15.0 or R 4.0.2.
Ethics approval
Our investigation was approved by the Human Research Ethics Committee of the South Australian Department for Health and Wellbeing (reference, HREC/16/SAH/72).
Results
A total of 32 646 people, including 314 children under 14 years of age at diagnosis, were diagnosed with invasive cancers during 1990–1999 and were alive five years after the index cancer diagnosis. Most patients were of European ancestry (30 309, 93%), and 16 400 were male (50%); the mean age at diagnosis was 60.3 years (standard deviation [SD], 15.7 years). The most frequent cancer types were breast (6259, 19.2%), prostate (5976, 18.3%), skin (5185, 15.9%), and gastrointestinal cancers (5033, 15.4%); 1572 people (4.8%) had multiple cancer types (Box 1).
By the end of 2016, median follow‐up time was 17 years (range, 5–26 years; interquartile range, 11–21 years). A total of 17 268 deaths were recorded (53% of patients): 7845 attributed to cancer (24% of patients, 45% of deaths) and 9423 attributed to non‐cancer causes (29% of patients, 55% of deaths). The mean age at death was 80.6 years (SD, 11.4 years). Cause of death information was missing in 2025 cases (11.7%); these cases were included in the total death count for our analyses, but were excluded from calculations of proportions for leading causes of death.
Among 9423 non‐cancer cause deaths, 4612 were caused by cardiovascular diseases (14.1% of patients, 26.7% of deaths, 51.1% of non‐cancer deaths); 338 deaths were attributed to cardiac failure (2.22% of deaths). Ischaemic heart disease was the leading cause of death (2393 deaths, 15.7%), followed by prostate cancer (1424, 9.3%), cerebrovascular disease (1175, 7.7%), and breast cancer (1118, 7.3%). Breast cancer was the leading cause of death in women (1112, 17.1%), followed by ischaemic heart disease (940, 14.5%) and cerebrovascular disease (546, 8.4%); ischaemic heart disease was the leading cause of death in men (1453, 16.6%), followed by prostate cancer (1424, 16.3%) and cerebrovascular disease (629, 7.2%) (Supporting Information, tables 1 and 2).
All‐cause and cancer cause‐specific mortality: by cancer type
The highest all‐cause mortality rates were for patients with prostate cancer (54.7 per 1000 person‐years) and lung cancer (49.5 per 1000 person‐years). The highest cancer cause‐specific mortality rates were for patients with lung cancer (27.3 per 1000 person‐years) and prostate cancer (24.7 per 1000 person‐years). For non‐cancer deaths, the highest mortality rates were for people with prostate cancer (30.0 per 1000 person‐years) and gastrointestinal cancer (25.0 per 1000 person‐years) (Box 2).
All‐cause and cancer cause‐specific mortality: by patient characteristics
All‐cause mortality risk was greater for male patients (adjusted hazard ratio [aHR], 1.28; 95% CI, 1.23–1.34), for people over 40 years of age at diagnosis, for Aboriginal and Torres Strait Islander Australians (v European background: aHR, 1.46; 95% CI, 1.15–1.85), and for patients with multiple tumours (aHR, 1.53; 95% CI, 1.44–1.62); risk was lower for patients of Asian background (v European: aHR, 0.59; 95% CI, 0.46–0.76) and for patients from areas of lesser socio‐economic disadvantage (IRSD quintiles 3–5). All‐cause mortality risk for patients diagnosed during 1996–1997 (aHR, 0.93; 95% CI, 0.88–0.97) or 1998–1999 (aHR, 0.95; 95% CI, 0.90–1.00) was lower than for those diagnosed during 1990–1991. All‐cause mortality risk was higher for patients with prostate cancer, lymphoma/other haematological cancer, head and neck cancer, or lung cancer than for those with breast cancer, and lower for those with skin cancer (Box 3).
Cancer cause‐specific mortality risk was higher for male patients (aHR, 1.36; 95% CI, 1.28–1.45), for people over 40 years of age at diagnosis, for Aboriginal and Torres Strait Islander Australians (aHR, 1.53; 95% CI, 1.11–2.11), for patients with multiple tumours (aHR, 2.32; 95% CI, 2.15–2.50), and for patients from areas of greater socio‐economic disadvantage. All‐cause mortality risk for patients diagnosed during 1996–1997 was lower than for those diagnosed during 1990–1991 (aHR, 0.91; 95% CI, 0.85–0.98). Cancer cause‐specific risk was higher for patients with lymphoma/other haematological cancer or lung cancer than for those with breast cancer, and lower for those with head and neck, renal/testicular/bladder, or gynaecological cancers (Box 3).
Standardised mortality ratios
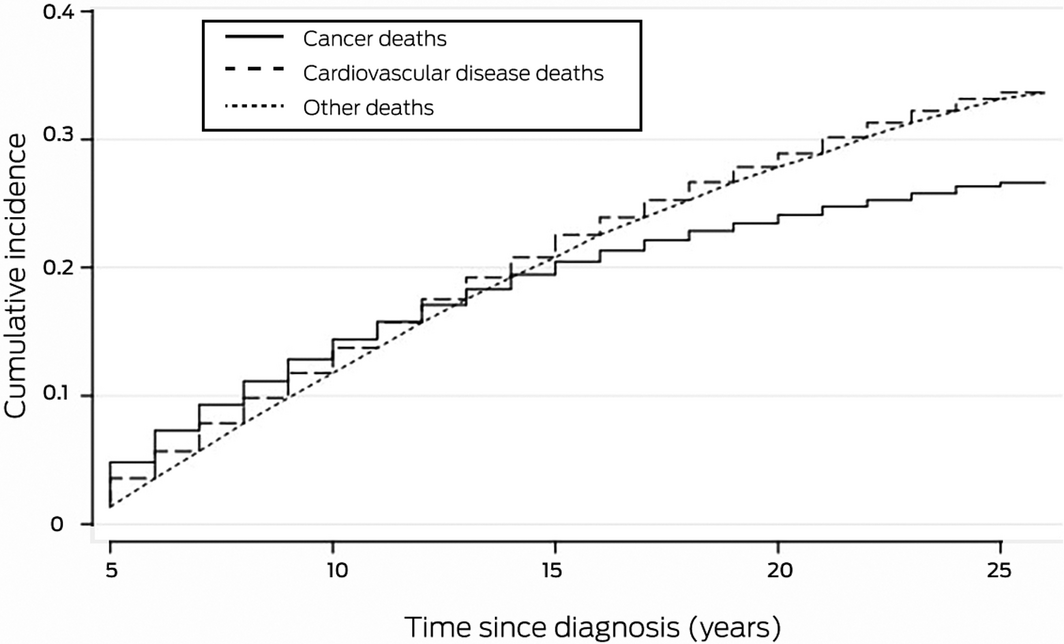
The overall SMR for the study group was 1.24 (95% CI, 1.22–1.25); all‐cause and cardiovascular death SMRs by sex, age at diagnosis, follow‐up period, and index cancer are reported in the Supporting Information, table 3. The cumulative incidence of cardiovascular deaths exceeded that of cancer cause‐specific deaths from 13 years after index cancer diagnosis (Box 4).
Discussion
In this large population‐based study, long term mortality among people with cancer and alive five years after diagnosis exceeded that for the general SA population, with cardiovascular disease a major competing cause of death.
The deaths of 4612 people with cancer and alive five years after diagnosis were attributed to cardiovascular diseases; that is, 26.7% of all deaths and 56.1% of non‐cancer deaths. These estimates are higher than those derived from a recent analysis of cardiovascular mortality data in the SEER database, in which 11% of all deaths and 43% of non‐cancer deaths were attributed to cardiovascular diseases,19 and those of the 2010 Korean study (7.5% of all deaths, 31% of non‐cancer deaths).9 Our finding is probably explained by our longer follow‐up and our inclusion of long term survivors and a smaller number of early cancer‐related deaths. We found that by 13 years after the index cancer diagnosis the cumulative number of cardiovascular deaths exceeded that of cancer cause‐specific deaths, underscoring the importance of longer follow‐up. Our findings are also consistent with the steady rise in cumulative cardiovascular mortality reported by an Australian study of early competing causes of death among patients with cancer.7
While the risks of cardiovascular disease in people with cancer have previously been reported, our study was unique in its focus on long term survivors and its longer follow‐up period. Our findings may partly reflect the high prevalence of and mortality from cardiovascular disease in Australia,20 but we also found that cardiovascular mortality was higher than in the general population, consistent with an earlier Australian study of non‐cancer mortality among people with cancer.21 Our findings suggest an interaction between cancer or its treatment and cardiovascular risk factors. The interaction may reflect a biological phenomenon (such as a direct toxic effect of anti‐cancer treatment on the heart or vascular system),22 or it may reflect lack of prioritisation of cardiovascular disease by patients, or health care focused on treating cancer.23 It is notable that cardiac failure was a relatively infrequent cause of death (2.2% of all deaths), suggesting that treatment toxicity, which tends to cause cardiac failure, may lead to earlier mortality, but that later mortality from cardiovascular disease is driven more by existing risk factors and background population risk. The relative contributions of these factors in patients with different cancer types should be further examined.
Death from cardiovascular disease annuls any benefits of anti‐cancer treatment, and identifying cancer survivors most at risk of cardiovascular disease is critical. Specific risk estimates have been reported for some cancers, such as Hodgkin disease,24 but not for other cancer types. Managing cardiovascular disease risk factors and providing interventions for the people at greatest risk (men, older people, Indigenous patients with cancer and comorbid conditions), for whom outcomes are inferior to those of other patient groups,25,26 should be prioritised. Treating comorbid conditions has recently been identified as an important component of survivorship care,27 but management of cardiovascular risk factors has not always been a routine part of cancer care; the emergence of cardio‐oncology may change this situation.28
Limitations
The long follow‐up period and complete population data were strengths of our study. But it is possible that cancer had been incorrectly recorded as the cause of death for some people with histories of cancer, potentially leading to underestimation of non‐cancer causes of death. Further, the estimated mortality rates for the general population are based on data that also include people with cancer, leading to underestimation of the difference between mortality rates for people with and without cancer. We had no information about comorbid conditions or prior cancer treatment for patients, and therefore could not assess their impact on mortality and causality. These findings suggest that it would be useful to include data on these variables in the routine cancer registry dataset.
Conclusion
We found that mortality among long term cancer survivors exceeds that of the general population, with cardiovascular disease a major competing cause of death. Cancer control systems should incorporate monitoring of long term survivorship outcomes, including non‐cancer‐related mortality, and manage risk factors for premature death from non‐cancer causes.
Box 1 – Characteristics of people alive 5 years after being diagnosed with invasive cancer during 1990–1999 and followed until 31 December 2016
|
|
Status, 31 December 2016 |
||||||||||||||
|
|
Total |
Alive |
Cancer death |
Non‐cancer death |
|||||||||||
|
|
|||||||||||||||
|
Number of people |
32 646 |
15 378 |
7845 |
9423 |
|||||||||||
|
Age at index diagnosis (years) |
|
|
|
|
|||||||||||
|
Mean (SD) |
60.3 (15.7) |
51.2 (15.1) |
64.6 (12.1) |
71.5 (9.4) |
|||||||||||
|
0–14 |
314 |
290 (92.4%) |
15 (4.8%) |
9 (3%) |
|||||||||||
|
15–40 |
3172 |
2826 (89.1%) |
278 (8.8%) |
68 (2.1%) |
|||||||||||
|
40–49 |
4120 |
3309 (80.3%) |
630 (15.3%) |
181 (4.4%) |
|||||||||||
|
50–59 |
5835 |
3977 (68.2%) |
1313 (22.5%) |
545 (9.3%) |
|||||||||||
|
60–69 |
8838 |
3583 (40.6%) |
2600 (29.5%) |
2645 (30.0%) |
|||||||||||
|
70–79 |
7971 |
1245 (15.6%) |
2424 (30.4%) |
4302 (54.0%) |
|||||||||||
|
≥ 80 |
2406 |
148 (6.2%) |
585 (24.3%) |
1673 (69.5%) |
|||||||||||
|
Follow‐up time (years), median (IQR) |
17 (11–21) |
20 (18–23) |
10 (7–14) |
12 (8–16) |
|||||||||||
|
Sex |
|
|
|
|
|||||||||||
|
Female |
16 246 |
8884 (54.7%) |
3277 (20.2%) |
4085 (25.1%) |
|||||||||||
|
Male |
16 400 |
6494 (39.6%) |
4568 (27.9%) |
5338 (32.6%) |
|||||||||||
|
Ethnic background |
|
|
|
|
|||||||||||
|
European |
30 309 |
13 429 (44.3%) |
7719 (25.5%) |
9161 (30.3%) |
|||||||||||
|
Asian |
212 |
150 (70.8%) |
35 (16%) |
27 (13%) |
|||||||||||
|
Aboriginal and Torres Strait Islander Australians |
119 |
50 (42%) |
37 (31%) |
32 (27%) |
|||||||||||
|
Unknown |
2006 |
1749 (87.2%) |
54 (2.7%) |
203 (10.1%) |
|||||||||||
|
Socio‐economic status (IRSD quintile) |
|
|
|
|
|||||||||||
|
1 (most disadvantaged) |
6356 |
2907 (45.7%) |
1581 (24.9%) |
1868 (29.4%) |
|||||||||||
|
2 |
6461 |
3058 (47.3%) |
1587 (24.6%) |
1816 (28.1%) |
|||||||||||
|
3 |
7609 |
3420 (45.0%) |
1852 (24.3%) |
2337 (30.7%) |
|||||||||||
|
4 |
5842 |
2744 (47.0%) |
1416 (24.2%) |
1682 (28.8%) |
|||||||||||
|
5 (least disadvantaged) |
6378 |
3249 (50.9%) |
1409 (22.1%) |
1720 (27.0%) |
|||||||||||
|
Multiple cancers |
|
|
|
|
|||||||||||
|
Yes |
1572 |
293 (18.6%) |
791 (50.3%) |
488 (31.0%) |
|||||||||||
|
No |
31 074 |
15 085 (48.5%) |
7054 (22.7%) |
8935 (28.8%) |
|||||||||||
|
Index cancer site |
|
|
|
|
|||||||||||
|
Breast |
6259 |
3516 (56.2%) |
1439 (23.0%) |
1304 (20.8%) |
|||||||||||
|
Prostate |
5976 |
1539 (25.8%) |
2005 (33.6%) |
2432 (40.7%) |
|||||||||||
|
Skin |
5185 |
3389 (65.4%) |
677 (13.1%) |
1119 (21.6%) |
|||||||||||
|
Gastrointestinal |
5033 |
1979 (39.3%) |
1119 (22.2%) |
1935 (38.5%) |
|||||||||||
|
Lymphoma/other haematological |
2686 |
1098 (40.9%) |
958 (35.7%) |
630 (23.4%) |
|||||||||||
|
Head/neck |
1784 |
811 (45.5%) |
377 (21.1%) |
596 (33.4%) |
|||||||||||
|
Renal/testicular/bladder |
1848 |
907 (49.1%) |
420 (22.7%) |
521 (28.2%) |
|||||||||||
|
Lung |
654 |
206 (31.5%) |
247 (37.8%) |
201 (30.7%) |
|||||||||||
|
Gynaecological |
1613 |
977 (60.6%) |
261 (16.2%) |
375 (23.2%) |
|||||||||||
|
Other |
1475 |
913 (61.9%) |
306 (20.8%) |
256 (17.3%) |
|||||||||||
|
Unknown |
133 |
43 (32%) |
36 (27%) |
54 (41%) |
|||||||||||
|
|
|||||||||||||||
|
IQR = interquartile range; IRSD = Index of Relative Socio-economic Disadvantage; SD = standard deviation. |
|||||||||||||||
Box 2 – All‐cause, cancer‐specific, and non‐cancer mortality (per 1000 person‐years) for people alive 5 years after being diagnosed with invasive cancer during 1990–1999 and followed until 31 December 2016, by index cancer diagnosis
|
Index cancer at diagnosis |
Patients at risk |
Time at risk (years) |
All‐cause deaths |
All‐cause mortality |
Cancer deaths* |
Cancer‐specific mortality* |
Non‐cancer deaths |
Non‐cancer mortality |
|||||||
|
|
|||||||||||||||
|
Breast |
6259 |
106 231 |
2743 |
25.8 (24.9–26.8) |
1439 |
13.5 (12.9–14.3) |
1304 |
12.3 (11.6–13.0) |
|||||||
|
Prostate |
5976 |
81 053 |
4437 |
54.7 (53.2–56.4) |
2005 |
24.7 (23.7–25.8) |
2432 |
30.0 (28.8–312) |
|||||||
|
Skin |
5185 |
93 764 |
1796 |
19.2 (18.3–20.1) |
677 |
7.2 (6.7–7.8) |
1119 |
11.9 (11.3–12.7) |
|||||||
|
Gastrointestinal |
5033 |
77 384 |
3054 |
39.5 (38.1–40.9) |
1119 |
14.5 (13.6–15.3) |
1935 |
25.0 (23.9–26.1) |
|||||||
|
Lymphoma/other haematological |
2686 |
40 374 |
1588 |
39.3 (37.4–41.3) |
958 |
23.7 (22.3–25.3) |
630 |
15.6 (14.4–16.9) |
|||||||
|
Head/neck |
1784 |
29 017 |
973 |
33.5 (31.5–35.7) |
377 |
13.0 (11.7–14.4) |
596 |
20.5 (19.0–22.3) |
|||||||
|
Renal/testicular/bladder |
1848 |
29 976 |
941 |
31.4 (29.4–33.5) |
420 |
14.0 (12.7–15.4) |
521 |
17.4 (16.0–18.9) |
|||||||
|
Lung |
654 |
9045 |
448 |
49.5 (45.1–54.3) |
247 |
27.3 (24.1–30.9) |
201 |
22.2 (19.4–25.5) |
|||||||
|
Gynaecological |
1613 |
28 507 |
636 |
22.3 (20.6–24.1) |
261 |
9.2 (8.1–10.3) |
375 |
13.2 (11.9–14.6) |
|||||||
|
Other/unknown |
1608 |
27 333 |
652 |
23.9 (22.1–25.8) |
342 |
12.5 (11.3–13.9) |
310 |
11.3 (10.1–12.7) |
|||||||
|
Total |
32 646 |
522 680 |
17 268 |
33.0 (32.5–33.5) |
7845 |
15.0 (14.7–15.3) |
9423 |
18.0 (17.7–18.4) |
|||||||
|
|
|||||||||||||||
|
CI = confidence interval. * Death caused by any cancer, but not necessarily the index cancer. |
|||||||||||||||
Box 3 – All‐cause and cancer cause‐specific mortality for people alive 5 years after being diagnosed with invasive cancer during 1990–1999 and followed until 31 December 2016: Cox regression analyses
|
|
All‐cause mortality |
Cancer cause‐specific mortality* |
|||||||||||||
|
|
|||||||||||||||
|
Sex |
|
|
|||||||||||||
|
Female |
1 |
1 |
|||||||||||||
|
Male |
1.28 (1.23–1.34) |
1.36 (1.28–1.45) |
|||||||||||||
|
Age at diagnosis, years |
|
|
|||||||||||||
|
< 40 |
1 |
1 |
|||||||||||||
|
40–49 |
2.07 (1.83–2.34) |
2.00 (1.74–2.30) |
|||||||||||||
|
50–59 |
3.47 (3.10–3.88) |
2.87 (2.52–3.26) |
|||||||||||||
|
60–69 |
7.26 (6.52–8.08) |
3.98 (3.52–4.51) |
|||||||||||||
|
70–79 |
14.7 (13.2–16.3) |
5.36 (4.73–6.08) |
|||||||||||||
|
≥ 80 |
26.2 (23.4–29.4) |
6.50 (5.62–7.52) |
|||||||||||||
|
Ethnic background |
|
|
|||||||||||||
|
European |
1 |
1 |
|||||||||||||
|
Asian |
0.59 (0.46–0.76) |
0.71 (0.51–0.99) |
|||||||||||||
|
Aboriginal and Torres Strait Islander Australians |
1.46 (1.15–1.85) |
1.53 (1.11–2.11) |
|||||||||||||
|
Unknown |
0.20 (0.18–0.23) |
0.09 (0.07–0.12) |
|||||||||||||
|
Socio‐economic status (IRSD quintile) |
|
|
|||||||||||||
|
1 (most disadvantaged) |
1 |
1 |
|||||||||||||
|
2 |
0.96 (0.92–1.01) |
0.98 (0.91–1.05) |
|||||||||||||
|
3 |
0.90 (0.86–0.94) |
0.91 (0.85–0.97) |
|||||||||||||
|
4 |
0.94 (0.90–0.99) |
0.95 (0.88–1.02) |
|||||||||||||
|
5 (least disadvantaged) |
0.86 (0.82–0.90) |
0.87 (0.81–0.94) |
|||||||||||||
|
Multiple cancer diagnosis |
|
|
|||||||||||||
|
No |
1 |
1 |
|||||||||||||
|
Yes |
1.53 (1.44–1.62) |
2.32 (2.15–2.50) |
|||||||||||||
|
Diagnosis year |
|
|
|||||||||||||
|
1990–1991 |
1 |
1 |
|||||||||||||
|
1992–1993 |
0.97 (0.93–1.02) |
0.93 (0.86–0.997) |
|||||||||||||
|
1994–1995 |
0.96 (0.91–1.00) |
0.94 (0.87–1.01) |
|||||||||||||
|
1996–1997 |
0.93 (0.88–0.97) |
0.91 (0.85–0.98) |
|||||||||||||
|
1998–1999 |
0.95 (0.90–0.995) |
0.93 (0.86–0.998) |
|||||||||||||
|
Index cancer diagnosis group |
|
|
|||||||||||||
|
Breast |
1 |
1 |
|||||||||||||
|
Prostate |
1.11 (1.04–1.18) |
1.08 (0.98–1.19) |
|||||||||||||
|
Skin |
0.80 (0.75–0.85) |
0.54 (0.49–0.60) |
|||||||||||||
|
Gastrointestinal |
0.95 (0.90–1.00) |
0.73 (0.67–0.79) |
|||||||||||||
|
Lymphoma/other haematological |
1.49 (1.40–1.59) |
1.66 (1.52–1.82) |
|||||||||||||
|
Head/neck |
1.16 (1.07–1.26) |
0.85 (0.75–0.96) |
|||||||||||||
|
Renal/testicular/bladder |
1.01 (0.93–1.09) |
0.83 (0.74–0.94) |
|||||||||||||
|
Lung |
1.55 (1.40–1.72) |
1.53 (1.33–1.77) |
|||||||||||||
|
Gynaecological |
0.95 (0.87–1.03) |
0.73 (0.64–0.83) |
|||||||||||||
|
Other/unknown |
1.25 (1.15–1.37) |
1.13 (1.002–1.28) |
|||||||||||||
|
|
|||||||||||||||
|
CI = confidence interval. * Death caused by any cancer, but not necessarily the index cancer. † The multivariable Cox regression models include all variables reported in the table. |
|||||||||||||||
Received 7 August 2020, accepted 4 November 2020
- Bogda Koczwara1,2
- Rosie Meng2
- Michelle D Miller2
- Robyn A Clark2
- Billingsley Kaambwa2
- Tania Marin2
- Raechel A Damarell2
- David M Roder3
- 1 Flinders Medical Centre, Adelaide, SA
- 2 Flinders University, Adelaide, SA
- 3 Cancer Research Institute, University of South Australia, Adelaide, SA
Our study was supported by a Flinders Foundation Seeding Grant. Bogda Koczwara was supported by a National Breast Cancer Foundation Practitioner Fellowship, Robyn A Clark by a Heart Foundation Future Leader Fellowship.
No relevant disclosures.
- 1. Bray F, Ferlay J, Soerjomataram I, et al. Global cancer statistics 2018: GLOBOCAN estimates of incidence and mortality worldwide for 36 cancers in 185 countries. CA Cancer J Clin 2018; 68: 394–424.
- 2. Rowland JH, Bellizzi KM. Cancer survivorship issues: life after treatment and implications for an aging population. J Clin Oncol 2014; 32: 2662–2668.
- 3. Ritchie CS, Kvale E, Fisch MJ. Multimorbidity: an issue of growing importance for oncologists. J Oncol Pract 2011; 7: 371–374.
- 4. Sarfati D, Koczwara B, Jackson C. The impact of comorbidity on cancer and its treatment. CA Cancer J Clin 2016; 66: 337–350.
- 5. Edwards BK, Noone AM, Mariotto AB, et al. Annual Report to the Nation on the status of cancer, 1975–2010, featuring prevalence of comorbidity and impact on survival among persons with lung, colorectal, breast, or prostate cancer. Cancer 2014; 120: 1290–1314.
- 6. Zaorsky NG, Churilla TM, Egleston BL, et al. Causes of death among cancer patients. Ann Oncol 2017; 28: 400–407.
- 7. Ye Y, Otahal P, Marwick TH, et al. Cardiovascular and other competing causes of death among patients with cancer from 2006 to 2015: an Australian population-based study. Cancer 2019; 125: 442–452.
- 8. Oh CM, Lee D, Kong HJ, et al. Causes of death among cancer patients in the era of cancer survivorship in Korea: attention to the suicide and cardiovascular mortality. Cancer Med 2020; 9: 1741–1752.
- 9. Shin DW, Ahn E, Kim H, et al. Non-cancer mortality among long-term survivors of adult cancer in Korea: national cancer registry study. Cancer Causes Control 2010; 21: 919–929.
- 10. Pink B. Information paper: an introduction to Socio‐Economic Indexes For Areas (SEIFA), 2006 (ABS cat. no. 2039.0). Canberra: Australian Bureau of Statistics, 2008. https://www.ausstats.abs.gov.au/ausstats/subscriber.nsf/0/D729075E079F9FDECA2574170011B088/$File/20390_2006.pdf
- 11. National Cancer Institute Surveillance, Epidemiology, and End Results Program. ICD-9-CM to ICD-10-CM based on FY2017 ICD-9-CM codes: reportable neoplasms. https://seer.cancer.gov/tools/conversion/2017/ICD9CM_to_ICD10CM_FY2017.pdf (viewed Nov 2020).
- 12. Becker R, Silvi J, Ma Fat D, et al. A method for deriving leading causes of death. Bull World Health Organ 2006; 84: 297–304.
- 13. Lau B, Cole SR, Gange SJ. Competing risk regression models for epidemiologic data. Am J Epidemiol 2009; 170: 244–256.
- 14. Breslow NE, Day NE. Statistical methods in cancer research: volume II. The design and analysis of cohort studies. Lyon: IARC Scientific Publications, 1987.
- 15. Reulen RC, Winter DL, Frobisher C, et al; British Childhood Cancer Survivor Study Steering Group. Long-term cause-specific mortality among survivors of childhood cancer. JAMA 2010; 304: 172–179.
- 16. Australian Government Actuary. Australian life tables 1995–97. 1999. https://www.aga.gov.au/publications/downloads/ALT1995-97.pdf (viewed Oct 2020).
- 17. Australian Bureau of Statistics. 3311.4. Demography, South Australia [1996–2001]. https://www.abs.gov.au/AUSSTATS/abs@.nsf/second+level+view?ReadForm&prodno=3311.4&viewtitle=Demography,%20South%20Australia~2001~Latest~12/12/2002&&tabname=Past%20Future%20Issues&prodno=3311.4&issue=2001&num=&view=& (viewed Oct 2020).
- 18. Australian Bureau of Statistics. Life tables, states, territories and Australia [2001–2015]. https://www.abs.gov.au/statistics/people/population/life-tables (viewed Oct 2020).
- 19. Sturgeon KM, Deng L, Bluethmann SM, et al. A population-based study of cardiovascular disease mortality risk in US cancer patients. Eur Heart J 2019; 40: 3889–3897.
- 20. Banks E, Crouch SR, Korda RJ, et al. Absolute risk of cardiovascular disease events, and blood pressure-and lipid-lowering therapy in Australia. Med J Aust 2016; 204: 320–320.e8. https://www.mja.com.au/journal/2016/204/8/absolute-risk-cardiovascular-disease-events-and-blood-pressure-and-lipid
- 21. Baade PD, Fritschi L, Eakin EG. Non-cancer mortality among people diagnosed with cancer (Australia). Cancer Causes Control 2006; 17: 287–297.
- 22. Accordino MK, Neugut AI, Hershman DL. Cardiac effects of anticancer therapy in the elderly. J Clin Oncol 2014; 32: 2654–2661.
- 23. Clark RA, Marin TS, Berry NM, et al. Cardiotoxicity and cardiovascular disease risk assessment for patients receiving breast cancer treatment. Cardiooncology 2017; 3: 6.
- 24. Salz T, Zabor EC, de Nully Brown P, et al. Preexisting cardiovascular risk and subsequent heart failure among non-Hodgkin lymphoma survivors. J Clin Oncol 2017; 35: 3837–3843.
- 25. Hershman DL, Till C, Shen S, et al. Association of cardiovascular risk factors with cardiac events and survival outcomes among patients with breast cancer enrolled in SWOG clinical trials. J Clin Oncol 2018; 36: 2710–2717.
- 26. Kaplan G, Keil J. Socioeconomic factors and cardiovascular disease: a review of the literature. Circulation 1993; 88: 1973–1998.
- 27. Nekhlyudov L, Mollica MA, Jacobsen PB, et al. Developing a quality of cancer survivorship care framework: implications for clinical care, research, and policy. J Natl Cancer Inst 2019; 111: 1120–1130.
- 28. Clark R, Berry N, Chowdhury M, et al. Heart failure following cancer treatment: characteristics, survival and mortality of a linked health data analysis. Intern Med J 2016; 46: 1297–1306.
Abstract
Objectives: To investigate causes of death of people with cancer alive five years after diagnosis, and to compare mortality rates for this group with those of the general population.
Design, setting, participants: Retrospective cohort study; analysis of South Australian Cancer Registry data for all people diagnosed with cancer during 1990–1999 and alive five years after diagnosis, with follow‐up to 31 December 2016.
Main outcome measures: All‐cause and cancer cause‐specific mortality, by cancer diagnosis; standardised mortality ratios (study group v SA general population) by sex, age at diagnosis, follow‐up period, and index cancer.
Results: Of 32 646 people with cancer alive five years after diagnosis, 30 309 were of European background (93%) and 16 400 were males (50%); the mean age at diagnosis was 60.3 years (SD, 15.7 years). The median follow‐up time was 17 years (IQR, 11–21 years); 17 268 deaths were recorded (53% of patients; mean age, 80.6 years; SD, 11.4 years): 7845 attributed to cancer (45% of deaths) and 9423 attributed to non‐cancer causes (55%). Ischaemic heart disease was the leading cause of death (2393 deaths), followed by prostate cancer (1424), cerebrovascular disease (1175), and breast cancer (1118). The overall standardised mortality ratio (adjusted for age, sex, and year of diagnosis) was 1.24 (95% CI, 1.22–1.25). The cumulative number of cardiovascular deaths exceeded that of cancer cause‐specific deaths from 13 years after cancer diagnosis.
Conclusions: Mortality among people with cancer who are alive at least five years after diagnosis was higher than for the general population, particularly cardiovascular disease‐related mortality. Survivorship care should include early recognition and management of risk factors for cardiovascular disease.