


The known: Most population‐based birthweight centile charts are biased at pre‐term gestational ages because a disproportionate number of small for gestational age babies are delivered before term by obstetric intervention.
The new: We derived new birthweight charts, based upon the most recent available Australian population data for births with spontaneous onset of labour. Excluding deliveries by intervention minimised the influence of pre‐term small for gestational age babies on the definition of the threshold 10th centile.
The implications: Our new birthweight charts may facilitate more accurate diagnosis of small for gestational age babies and improve obstetric and neonatal care.
Centile curves of birthweight by gestational age are widely used in obstetric, paediatric and general medicine. During pregnancy, they are used to assess fetal growth and to screen for small and large fetuses at increased risk of antenatal and intrapartum complications; in the postnatal period, they are used to identify neonates at increased risk of complications such as hypoglycaemia and to assess their growth. The 10th centile, in particular, is often used to define small for gestational age (SGA) babies, who are at increased risk of perinatal complications and death.1,2 The exact centile cut‐offs therefore have important implications for diagnosis and management during the ante‐ and postnatal periods. Given the potential consequences of inaccurate birthweight charts, it is essential to review and update them to incorporate the most recent population data and methodology for constructing the charts.3,4
Birthweight charts can be descriptive (population‐based) or prescriptive (based on a restricted subset of “normal” pregnancies).5 They can also be derived from two different methods of measurement: ultrasound estimates of fetal weight in utero6,7 or birthweights recorded at birth.8 Each approach has limitations. Ultrasound estimates are subject to measurement error,9,10 while a descriptive chart based on actual birthweights from an unselected birth cohort will be skewed to lower birthweights for pre‐term babies (earlier than 37 weeks’ gestation) because a disproportionate number of infants born pre‐term are SGA.11,12 This bias may influence the diagnosis of intra‐uterine growth restriction in a pre‐term fetus, affecting the decision to expedite delivery and subsequent neonatal care.
Births can be classified as deliveries by intervention (in which the obstetric team has made a decision to intervene to end the pregnancy) or as spontaneous deliveries (in which labour has commenced without intervention). Removing the intervention group from birthweight‐based growth curves excludes a significant source of bias and leads to more accurate diagnosis of pre‐term SGA, better identifying infants at risk of stillbirth and neonatal problems.13
In our study, we applied this improvement in methodology to develop new birthweight‐based reference charts for Australian neonates, incorporating updated population data from the National Perinatal Data Collection.
Methods
Design
We undertook a population‐based, retrospective observational study.
Data source
Data were extracted from the Australian Institute of Health and Welfare (AIHW) National Perinatal Data Collection, a population‐based surveillance system for all births of at least 400 g birthweight or at least 20 weeks’ gestation.14 The National Perinatal Data Collection includes data on gestational age, birthweight, infant sex, and onset of labour for each birth. The onset of labour is described as “spontaneous”, “induced”, or “no labour”; for our analysis, the latter two categories were deemed to indicate delivery by intervention.
Population and setting
Our study population comprised all Australian liveborn singleton infants during the ten calendar years 2004–2013, the most recent 10‐year period for which National Perinatal Data Collection data were available. Perinatal data are collected by birth attendants and collated by the relevant state or territory health department. The estimated gestational age is based on the last menstrual period (if known), ultrasound earlier in the pregnancy, or clinical examination at birth if there was no prior antenatal care; the exact method of estimation, however, is not recorded in the database.
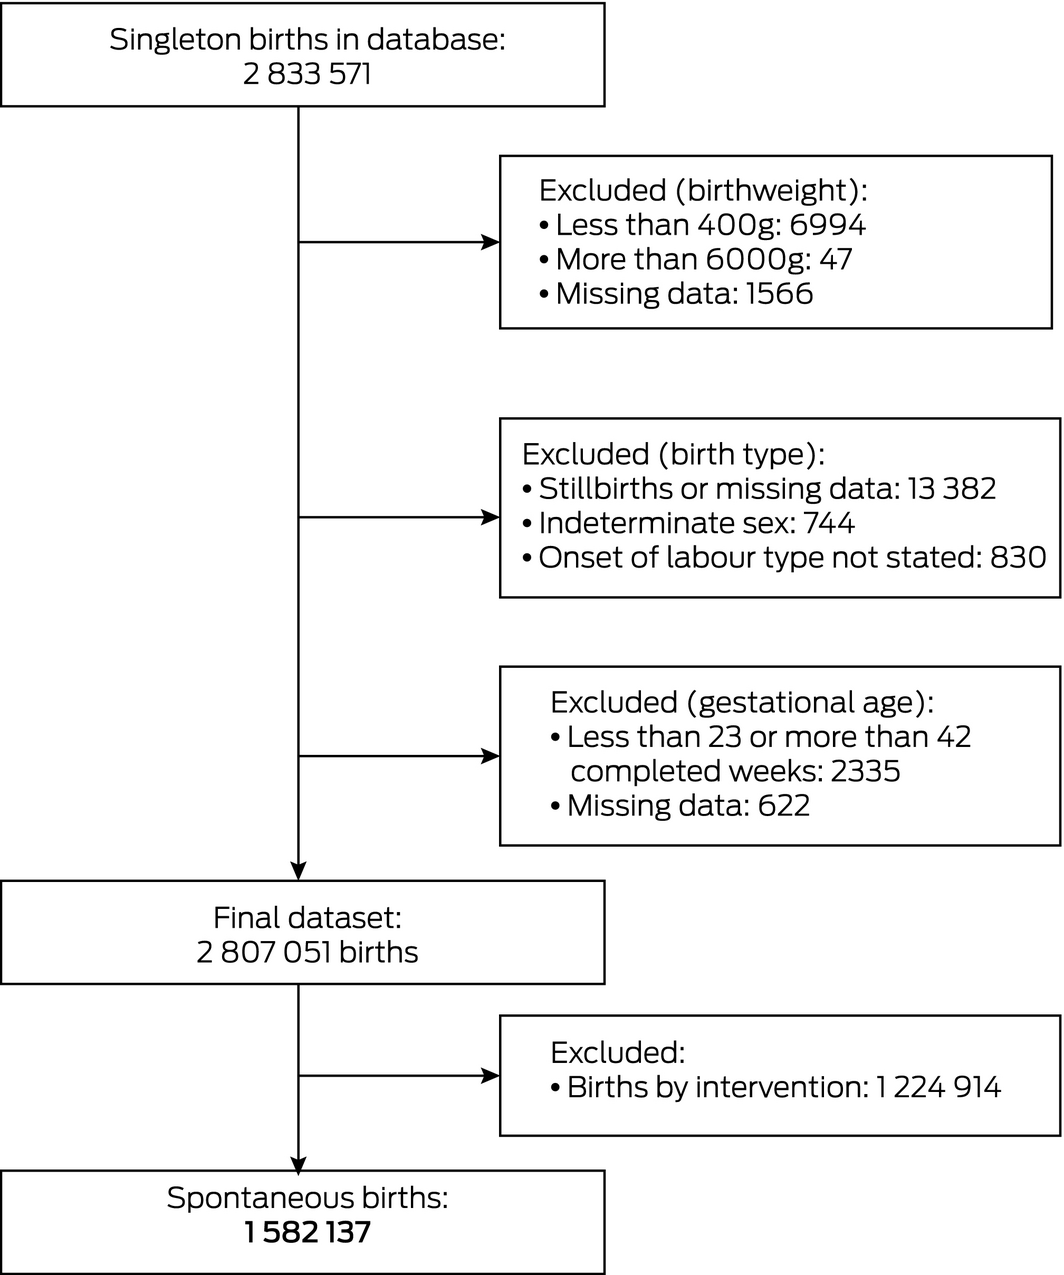
Given the paucity of data for shorter and longer gestations, we limited our analysis to infants with recorded gestation periods of 23–42 completed weeks, allowing construction of centile growth curves for 24+0 to 42+0 weeks’ gestation. Birthweights below 400 g or exceeding 6000 g were excluded from our analysis because of the dubious accuracy of such weights. Records with missing values for gestational age, onset of labour, or birth outcome, and for babies of indeterminate sex were also omitted.
Statistical analysis
Our analysis and reporting of results were informed by the STROBE guidelines.15
Statistical analysis was performed in SAS 9.4 for Windows. Centile curves for birthweight by gestation for each sex were prepared by quantile regression, as previously used for preparing growth curves,13,16 including the additional explanatory variable of labour onset (spontaneous, intervention). The statistical significance of the interaction between labour onset and gestational age was also determined. Polynomial functions of order 4 were fitted to the data, an approach we have previously validated.13 The centile curves were checked against raw centiles for additional validation.
In a sensitivity analysis, curves prepared after removing outliers with a modification of the Tukey method17 were compared with our main centile curves.
Ethics approval
Ethics approval was granted by the Human Research Ethics Committee of the University of New South Wales (reference, HC16370) and the AIHW Ethics Committee (reference, EO2016/3/291).
Results
The initial dataset included 2 833 571 singleton births of at least 20 weeks’ gestation; 26 520 births (0.9%) were excluded by our selection criteria. Of the 2 807 051 eligible births, 1 582 137 were recorded as spontaneous births (56.4%) and 1 224 914 as births following obstetric intervention (43.6%) (Box 1, Box 2).
In the quantile regression model, gestational age, labour onset, and the interaction between gestational age and labour onset were each significantly associated with birthweight at the 10th and 50th centiles (P < 0.001), indicating that the relationship between birthweight and gestational age differs by labour onset type. The interaction term was not significant at the 90th centile (Supporting Information, file 1).
Our centile birthweight curves for singleton infants born to mothers in Australia after spontaneous labour onset are depicted in Box 3 and Box 4. The birthweights for selected centiles are listed in Box 5; more comprehensive tables are included in the online Supporting Information, file 2.
In a sensitivity analysis in which we recalculated the 10th, 50th, and 90th birthweight centiles after removing outliers (birthweight data points more than four times the interquartile range from the mean), the largest resulting difference was 10 g (data not shown).
To check for consistency across the 10‐year data period, we also divided the births into two 5‐year periods (2004–2008, 2009–2013) and calculated the 10th centile curve for each period. The 10th centile birthweights in the more recent group were slightly larger (1–2% for most gestational ages) (data not shown).
Comparison of our curves with previously published curves
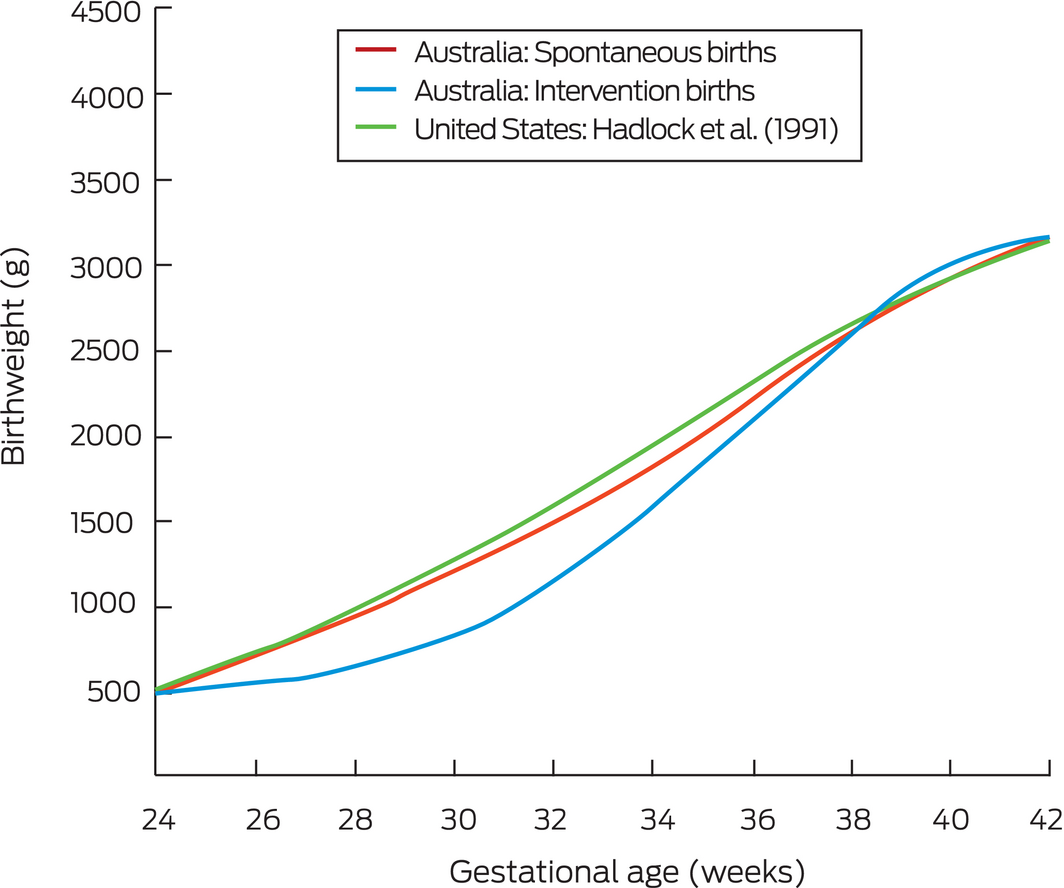
The 10th centile curves for spontaneous and intervention births are compared in Box 6 with the 1991 ultrasound estimates by Hadlock and colleagues,6 an example of a widely used prescriptive fetal growth chart for a population of healthy pregnant women (that is, excluding pre‐term deliveries of SGA babies). Consistent with our previous report,13 we found that the birthweights of infants born pre‐term after obstetric intervention were generally lower than for spontaneous births, and that the curves for infants born following spontaneous labour approximated ultrasound‐based curves for a healthy population.
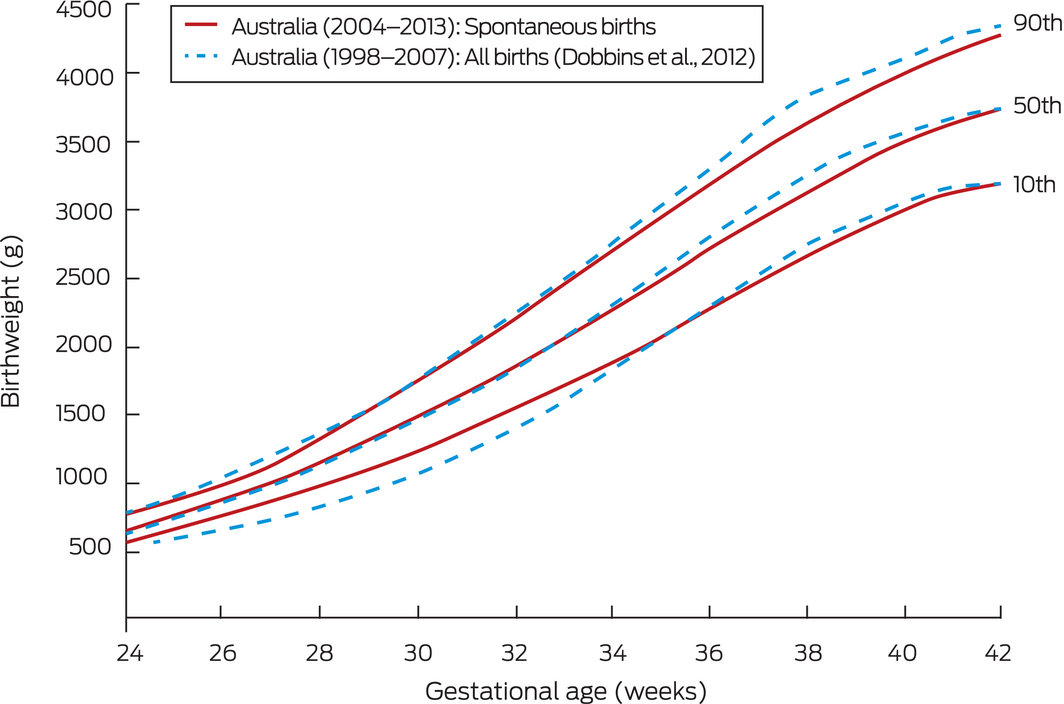
In Box 7, the 10th, 50th and 90th centiles for our spontaneous birth cohort are compared with the descriptive birthweight reference based on all Australian births (1998–2007) published by Dobbins and colleagues.8 Only 3.0% of spontaneous births of less than 34 weeks’ gestation in our cohort (1071 of 35 801 births) lie beneath the Dobbins 10th centile for birthweight; conversely, the Dobbins 90th centile for term gestations is higher than our 90th centile for spontaneous births.
Discussion
We report new birthweight charts based on data for spontaneous singleton births in Australia. By restricting our analysis to spontaneous births, our charts more closely reflect normal growth and delivery trajectories by excluding the impact on growth curves for pre‐term fetuses of the early delivery by intervention of SGA babies. Our curves will allow more accurate assessment of fetal growth in Australia than previous charts based on unselected populations, which tend to underdiagnose SGA in pre‐term fetuses. The potential magnitude of underdiagnosis of SGA is illustrated by the fact that only 3.0% of all spontaneous births of less than 34 weeks’ gestation in our study lay beneath the Dobbins 10th centile for birthweight,8 suggesting that a substantial proportion of SGA pre‐term fetuses are not recognised as such in Australia, where descriptive birthweight charts are commonly used.
Although the bias associated with obstetric intervention deliveries is most marked for the pre‐term period, we restricted our analysis of birthweight at all gestational ages to spontaneous births. This approach reduces potential bias at later gestational ages, such as that associated with term intervention deliveries of babies with suspected macrosomia. We also found that more complex analytic approaches (eg, including only spontaneous births up to an arbitrary gestational age limit, and all births thereafter) yielded very similar centile curves (data not shown).
It would be appropriate to test the effect of using our birthweight charts in clinical settings. Some fetuses previously regarded as “normal” will now be identified as SGA and may benefit from additional surveillance. More frequent diagnosis of SGA will increase the burden on health care, but may reduce the incidence of poor clinical outcomes for neonates.
The National Perinatal Data Collection does not record head circumference and length data, important neonatal parameters. The birthweight centiles in the Fenton charts,18 widely used in Australian nurseries, are derived from six studies (3 986 456 births), but the Fenton head circumference (173 612 births) and length centiles (151 527 births) are based on only two studies. That is, the Fenton charts effectively include one set of charts for birthweight and another for head circumference and length. Until the National Perinatal Data Collection includes these parameters, it would be reasonable to use our new birthweight charts for neonatal birthweight, and the Fenton charts for head circumference and length assessment.
With one notable exception,19 most published birthweight‐based growth charts have not taken the problem of pre‐term SGA bias into account. Ultrasound‐based charts, such as the Hadlock charts6 and those of the Fetal Growth Longitudinal Study,7 circumvent this problem, but at the cost of measurement error; further, they are limited to select population samples, introducing selection bias that does not affect population‐based birthweight charts.
Another approach is to construct prescriptive standardised charts based on birthweights for a cohort of women with low risk pregnancies, as in the INTERGROWTH‐21st project; however, the small number of early pre‐term births limited the value of the resulting curves to later gestational ages.20 Such standardised charts also inevitably include some pregnancies with fetal growth restrictions that result in obstetric intervention, as it is not possible to prospectively exclude all such pregnancies.
Strengths and limitations
The major strength of our study was the size of the dataset, comprising more than 1.5 million spontaneous labour births and with few exclusions, thereby avoiding selection bias and producing robust estimates. The dataset is sufficiently large to allow confident estimation of birthweights for as early as 24 weeks’ gestation.13 Our centile curves are applicable across Australia, and possibly also in other multi‐ethnic populations with similar demographic features.
An additional strength was the use of quantile regression, which produces smoothed centile curves with no assumptions about the distribution of error terms, unlike traditional least squares regression.21 The method could be used to generate birthweight charts that are also adjusted for factors such as maternal height by including these variables in the regression models.
The major weakness of our analysis is that it depends on the accuracy of the included data, particularly information about onset of labour. The classification of labour is not always straightforward, and events such as artificial rupture of membranes or augmentation with oxytocin can obscure whether labour onset was ultimately spontaneous or induced. This uncertainty could bias our centile curves in either direction. National Perinatal Data Collection reporting could be improved in this regard by more reliably differentiating between induction of labour and interventions during spontaneous labour.
We also assumed that spontaneous onset of labour is less likely to be associated with abnormal fetal growth. Spontaneous pre‐term birth is associated with acute chorioamnionitis22,23,24 and, as expected given its acute onset, is less likely to be associated with fetal growth restriction.25 However, there is still a weak association between fetal growth restriction and spontaneous pre‐term birth, and our charts will be subject to some residual downward bias in the pre‐term 10th centile.
The impact of interventions for delivering large for gestational age (LGA) babies at term is more complex. Delivery by intervention of LGA fetuses at 38–40 weeks’ gestation probably pushes the 90th centile up, leading to underdiagnosis of LGA at gestations of this length. However, our 90th centile for spontaneous births may be low from 40 weeks, as the proportion of LGA fetuses that reach this gestational age is small. Comparison with cross‐sectional ultrasound‐based charts6,13 suggests that this bias is small (Box 6). Accurate diagnosis of LGA is becoming increasingly important as rates of maternal obesity and diabetes rise.26 Maternal health, nutrition, and ethnic background may also influence fetal weight, but data on these parameters were not available for our study.
Finally, we noted a small increase between 2004–2008 and 2009–2013 in the 10th centile birthweights at all gestational ages. We could not assess the significance of this result, nor whether it was linked with earlier interventions for delivering SGA fetuses, a change in population demographic characteristics, or another factor. However, it would be advisable to periodically recalculate and update centile curves using the most recent data available.
Conclusion
We have reported a new set of fetal birthweight charts that, in particular, allow improved diagnosis of SGA in Australia. Our methods could be applied to constructing growth charts for other populations for which the local obstetric database reliably differentiates between spontaneous deliveries and deliveries by intervention.
Box 2 – Singleton births of 23–42 weeks’ gestation in the Australian Institute of Health and Welfare National Perinatal Data Collection, 2004–2013*
|
|
Birth mode |
|
|||||||||||||
|
Spontaneous |
Intervention |
Total |
|||||||||||||
|
|
|||||||||||||||
|
All births |
1 582 137 (56.4%) |
1 224 914 (43.6%) |
2 807 051 |
||||||||||||
|
Sex |
|
|
|
||||||||||||
|
Girls |
767 117 (56.3%) |
596 278 (43.7%) |
1 363 395 |
||||||||||||
|
Boys |
815 020 (56.5%) |
628 636 (43.5%) |
1 443 656 |
||||||||||||
|
Gestational age (completed weeks) |
|||||||||||||||
|
23 |
658 (78.0%) |
186 (22.0%) |
844 |
||||||||||||
|
24 |
974 (77.2%) |
287 (22.8%) |
1261 |
||||||||||||
|
25 |
1078 (70.5%) |
452 (29.5%) |
1530 |
||||||||||||
|
26 |
1160 (62.8%) |
687 (37.2%) |
1847 |
||||||||||||
|
27 |
1190 (56.4%) |
921 (43.6%) |
2111 |
||||||||||||
|
28 |
1435 (52.5%) |
1298 (47.5%) |
2733 |
||||||||||||
|
29 |
1554 (52.1%) |
1429 (47.9%) |
2983 |
||||||||||||
|
30 |
2096 (50.9%) |
2022 (49.1%) |
4118 |
||||||||||||
|
31 |
2783 (52.5%) |
2521 (47.5%) |
5304 |
||||||||||||
|
32 |
4226 (53.3%) |
3698 (46.7%) |
7924 |
||||||||||||
|
33 |
6639 (56.4%) |
5126 (43.6%) |
11 765 |
||||||||||||
|
34 |
12 008 (57.0%) |
9048 (43.0%) |
21 056 |
||||||||||||
|
35 |
20 257 (58.1%) |
14 633 (41.9%) |
34 890 |
||||||||||||
|
36 |
39 955 (55.7%) |
31 778 (44.3%) |
71 733 |
||||||||||||
|
37 |
87 450 (50.2%) |
86 861 (49.8%) |
174 311 |
||||||||||||
|
38 |
221 692 (41.1%) |
318 232 (58.9%) |
539 924 |
||||||||||||
|
39 |
422 838 (57.8%) |
308 930 (42.2%) |
731 768 |
||||||||||||
|
40 |
562 224 (72.1%) |
217 746 (27.9%) |
779 970 |
||||||||||||
|
41 |
183 420 (47.5%) |
202 831 (52.5%) |
386 251 |
||||||||||||
|
42 |
8500 (34.4%) |
16 228 (65.6%) |
24 728 |
||||||||||||
|
|
|||||||||||||||
|
* Exclusions: birthweights below 400 g or exceeding 6000 g; records with missing values for gestational age, onset of labour, or birth outcome, and for babies of indeterminate sex. |
|||||||||||||||
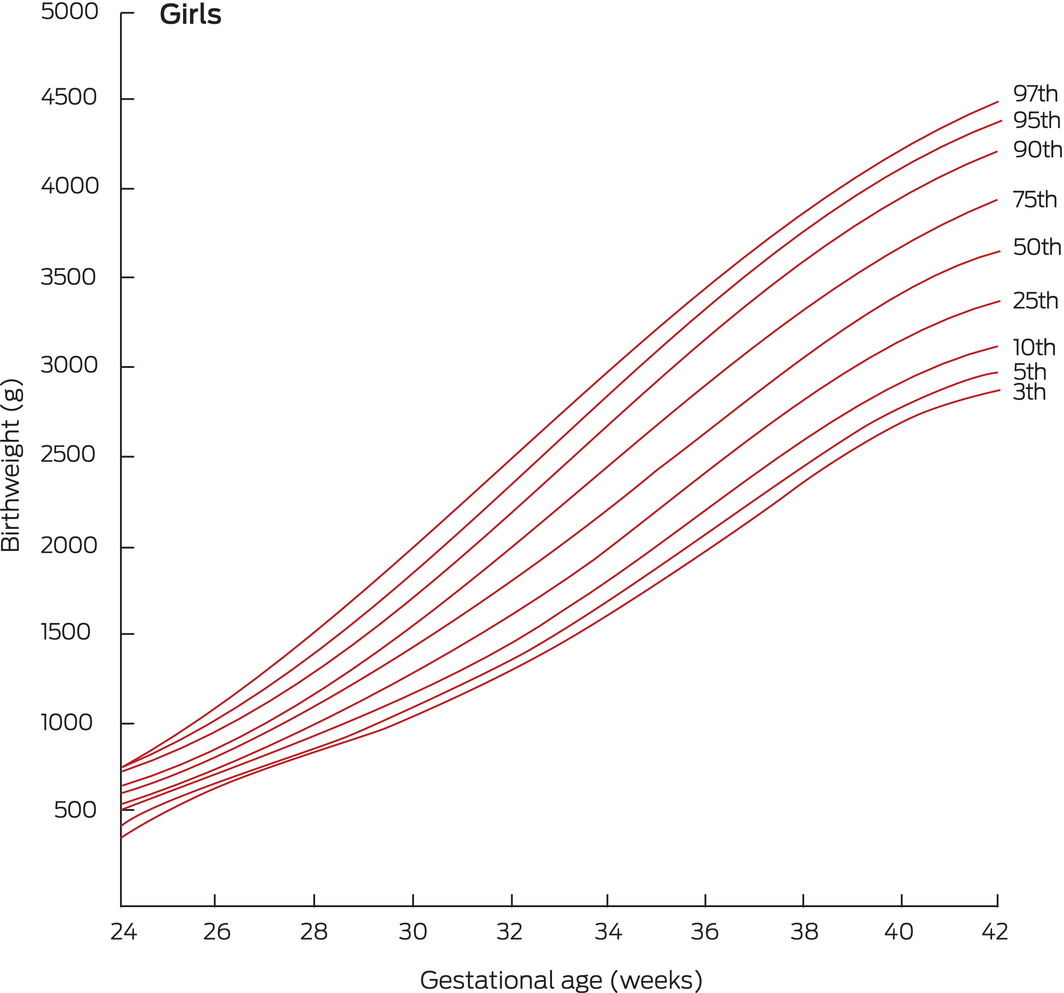
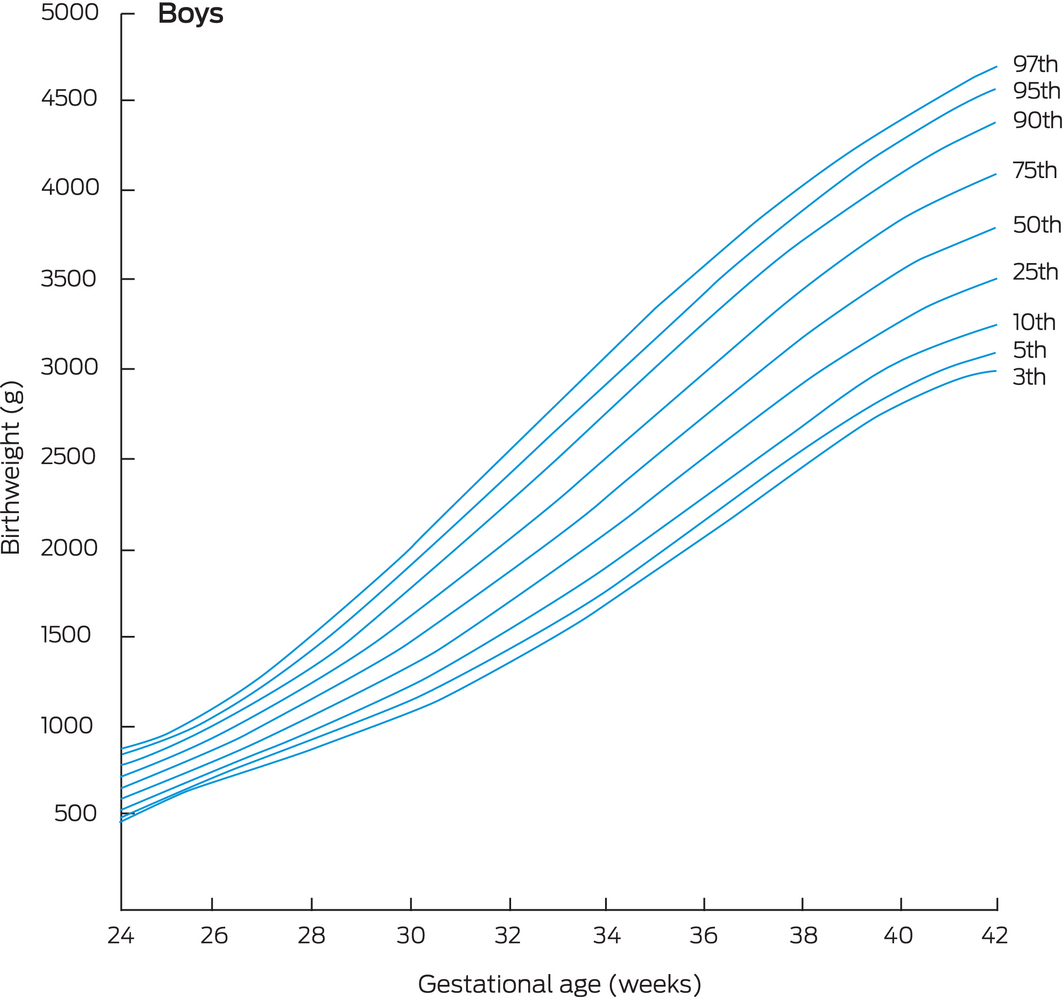
Box 5 – Birthweight centiles for live, spontaneous singleton births, Australia, 2004–2013: by sex and gestational age
|
|
Birthweight (grams, by centiles) |
||||||||||||||
|
Gestation (weeks) |
3rd |
5th |
10th |
25th |
50th |
75th |
90th |
95th |
97th |
||||||
|
|
|||||||||||||||
|
Girls |
|
|
|
|
|
|
|
|
|
||||||
|
24+0 |
388 |
447 |
499 |
560 |
620 |
673 |
729 |
761 |
775 |
||||||
|
25+0 |
541 |
574 |
618 |
667 |
724 |
773 |
828 |
873 |
932 |
||||||
|
26+0 |
661 |
682 |
726 |
776 |
838 |
895 |
959 |
1022 |
1117 |
||||||
|
27+0 |
762 |
781 |
830 |
890 |
964 |
1036 |
1117 |
1201 |
1325 |
||||||
|
28+0 |
854 |
879 |
937 |
1014 |
1103 |
1196 |
1299 |
1406 |
1550 |
||||||
|
29+0 |
946 |
982 |
1052 |
1148 |
1257 |
1373 |
1502 |
1629 |
1788 |
||||||
|
30+0 |
1047 |
1095 |
1177 |
1295 |
1425 |
1567 |
1721 |
1868 |
2035 |
||||||
|
31+0 |
1160 |
1222 |
1316 |
1456 |
1606 |
1773 |
1952 |
2115 |
2286 |
||||||
|
32+0 |
1290 |
1364 |
1469 |
1630 |
1800 |
1990 |
2193 |
2368 |
2537 |
||||||
|
33+0 |
1438 |
1521 |
1636 |
1815 |
2005 |
2216 |
2438 |
2621 |
2786 |
||||||
|
34+0 |
1603 |
1694 |
1816 |
2010 |
2217 |
2446 |
2685 |
2872 |
3030 |
||||||
|
35+0 |
1784 |
1879 |
2007 |
2212 |
2433 |
2677 |
2928 |
3115 |
3264 |
||||||
|
36+0 |
1976 |
2072 |
2203 |
2416 |
2649 |
2905 |
3165 |
3349 |
3488 |
||||||
|
37+0 |
2172 |
2267 |
2400 |
2618 |
2862 |
3125 |
3390 |
3569 |
3699 |
||||||
|
38+0 |
2366 |
2458 |
2592 |
2813 |
3064 |
3334 |
3600 |
3774 |
3895 |
||||||
|
39+0 |
2547 |
2636 |
2770 |
2993 |
3250 |
3525 |
3791 |
3960 |
4075 |
||||||
|
40+0 |
2702 |
2791 |
2925 |
3152 |
3413 |
3693 |
3959 |
4126 |
4238 |
||||||
|
41+0 |
2820 |
2911 |
3048 |
3280 |
3546 |
3833 |
4100 |
4270 |
4383 |
||||||
|
42+0 |
2883 |
2984 |
3126 |
3369 |
3641 |
3938 |
4208 |
4390 |
4509 |
||||||
|
Boys |
|
|
|
|
|
|
|
|
|
||||||
|
24+0 |
477 |
495 |
541 |
600 |
657 |
716 |
791 |
846 |
873 |
||||||
|
25+0 |
597 |
620 |
657 |
710 |
767 |
827 |
889 |
937 |
964 |
||||||
|
26+0 |
699 |
728 |
765 |
821 |
885 |
954 |
1017 |
1070 |
1108 |
||||||
|
27+0 |
792 |
828 |
872 |
938 |
1015 |
1098 |
1174 |
1239 |
1294 |
||||||
|
28+0 |
885 |
929 |
983 |
1064 |
1158 |
1258 |
1354 |
1437 |
1513 |
||||||
|
29+0 |
983 |
1036 |
1102 |
1202 |
1315 |
1435 |
1556 |
1659 |
1757 |
||||||
|
30+0 |
1092 |
1153 |
1233 |
1353 |
1487 |
1628 |
1775 |
1898 |
2016 |
||||||
|
31+0 |
1215 |
1284 |
1378 |
1518 |
1672 |
1835 |
2009 |
2150 |
2285 |
||||||
|
32+0 |
1355 |
1431 |
1537 |
1696 |
1871 |
2055 |
2253 |
2410 |
2558 |
||||||
|
33+0 |
1511 |
1593 |
1710 |
1887 |
2080 |
2284 |
2503 |
2673 |
2828 |
||||||
|
34+0 |
1684 |
1769 |
1895 |
2087 |
2298 |
2520 |
2757 |
2935 |
3091 |
||||||
|
35+0 |
1869 |
1958 |
2090 |
2295 |
2521 |
2759 |
3009 |
3191 |
3345 |
||||||
|
36+0 |
2063 |
2154 |
2291 |
2506 |
2744 |
2997 |
3255 |
3438 |
3585 |
||||||
|
37+0 |
2261 |
2354 |
2492 |
2715 |
2964 |
3228 |
3492 |
3673 |
3810 |
||||||
|
38+0 |
2455 |
2549 |
2688 |
2916 |
3175 |
3449 |
3715 |
3892 |
4019 |
||||||
|
39+0 |
2637 |
2732 |
2871 |
3104 |
3371 |
3652 |
3919 |
4093 |
4212 |
||||||
|
40+0 |
2797 |
2892 |
3032 |
3270 |
3544 |
3831 |
4101 |
4273 |
4389 |
||||||
|
41+0 |
2922 |
3020 |
3162 |
3406 |
3686 |
3979 |
4254 |
4431 |
4550 |
||||||
|
42+0 |
3001 |
3101 |
3249 |
3503 |
3791 |
4089 |
4376 |
4563 |
4699 |
||||||
|
|
|||||||||||||||
|
|
|||||||||||||||
Box 6 – Birthweight curves, 10th centile: comparison of data for Australian births, 2004–2013, by birth type, and in utero ultrasound data reported by Hadlock and colleagues6
Box 7 – Birthweight curves, 10th, 50th and 90th centiles: comparison of data for Australian spontaneous births, 2004–2013, with reference curves for all Australian births, 1998–2007, published by Dobbins and colleagues8,*
* The Dobbins curves are raw centiles, not regression curves.
Received 19 April 2019, accepted 13 March 2020
- Farmey A Joseph1
- Jonathan A Hyett2,3
- Philip J Schluter4,5
- Andrew McLennan3
- Adrienne Gordon1,6
- Georgina M Chambers7,8
- Lisa Hilder7,8
- Stephanie KY Choi8
- Bradley Vries2,3
- 1 Royal Prince Alfred Hospital, Sydney, NSW
- 2 Sydney Institute for Women, Children and their Families, Sydney, NSW
- 3 Sydney Medical School, University of Sydney, Sydney, NSW
- 4 University of Canterbury, Christchurch, New Zealand
- 5 University of Queensland, Brisbane, QLD
- 6 Charles Perkins Centre, University of Sydney, Sydney, NSW
- 7 National Perinatal Epidemiology and Statistics Unit, University of New South Wales, Sydney, NSW
- 8 Centre for Big Data Research in Health, University of New South Wales, Sydney, NSW
We acknowledge the Ministries of Health of all Australian states and territories for providing data to the National Perinatal Data Collection. We also acknowledge the Australian Institute of Health and Welfare (AIHW) for preparing and providing the National Perinatal Data Collection data for this study. We are grateful to the Victorian Consultative Council on Obstetric and Paediatric Mortality and Morbidity (CCOPMM) for providing access to the de‐identified data from the Victorian Perinatal Data Collection that contributes to the AIHW National Perinatal Data Collection and for the assistance of the staff at the Consultative Councils Unit, Safer Care Victoria, for facilitating the Victorian approval process for this project. The views expressed in this article do not necessarily reflect those of CCOPMM. Finally, we thank Kevin McGeechan for his advice on statistical analysis.
No relevant disclosures.
- 1. Doctor BA, O'Riordan MA, Kirchner HL, et al. Perinatal correlates and neonatal outcomes of small for gestational age infants born at term gestation. Am J Obstet Gynecol 2001; 185: 652–659.
- 2. Strauss RS. Adult functional outcome of those born small for gestational age. JAMA 2000; 283: 625–632.
- 3. Rao SC, Tompkins J; World Health Organization. Growth curves for preterm infants. Early Hum Dev 2007; 83: 643–651.
- 4. Reeves S, Bernstein IM. Optimal growth modeling. Semin Perinatol 2008; 32: 148–153.
- 5. Hoftiezer L, Hukkelhoven CWPM, Hogeveen M, et al. Defining small‐for‐gestational‐age: prescriptive versus descriptive birthweight standards. Eur J Pediatr 2016; 175: 1047–1057.
- 6. Hadlock F, Harrist R, Martinez‐Poyer J. In utero analysis of fetal growth: a sonographic weight standard. Radiology 1991; 181: 129–133.
- 7. Papageorghiou AT, Ohuma EO, Altman DG, et al; International Fetal and Newborn Growth Consortium for the 21st Century (INTERGROWTH‐21st). International standards for fetal growth based on serial ultrasound measurements: the Fetal Growth Longitudinal Study of the INTERGROWTH‐21st Project. Lancet 2014; 384: 869–879.
- 8. Dobbins TA, Sullivan EA, Roberts CL, Simpson JM. Australian national birthweight percentiles by sex and gestational age, 1998–2007. Med J Aust 2012; 197: 291–294. https://www.mja.com.au/journal/2012/197/5/australian-national-birthweight-percentiles-sex-and-gestational-age-1998-2007
- 9. Sarris I, Ioannou C, Ohuma EO, et al; International Fetal and Newborn Growth Consortium for the 21st Century. Standardisation and quality control of ultrasound measurements taken in the INTERGROWTH‐21st Project. BJOG 2013; 120: 33–37.
- 10. Dudley NJ. A systematic review of the ultrasound estimation of fetal weight. Ultrasound Obstet Gynecol 2005; 25: 80–89.
- 11. Burkhardt T, Schäffer L, Zimmermann R, Kurmanavicius J. Newborn weight charts underestimate the incidence of low birthweight in preterm infants. Am J Obstet Gynecol 2008; 199: 139.e1–139.e6.
- 12. Hutcheon JA, Platt RW. The missing data problem in birth weight percentiles and thresholds for ‘“small‐ for‐gestational‐age”. Am J Epidemiol 2008; 167: 786–792.
- 13. Joseph FA, Hyett JA, McGeechan K, et al. A new approach to developing birth weight reference charts: a retrospective observational study. Fetal Diagn Ther 2018; 43: 148–155.
- 14. Australian Institute of Health and Welfare. Australia's mothers and babies 2016: in brief (Cat. no. PER 97; Perinatal statistics series no. 34). Canberra: AIHW, 2018.
- 15. von Elm E, Altman DG, Egger M, et al. The Strengthening the Reporting of Observational Studies in Epidemiology (STROBE) statement: guidelines for reporting observational studies. PLoS Med 2007; 4: e296.
- 16. Daniel‐Spiegel E, Weiner E, Yarom I, et al. Establishment of fetal biometric charts using quantile regression analysis. J Ultrasound Med 2013; 32: 23–33.
- 17. Hoaglin DC, John W. Tukey and data analysis. Stat Sci 2003; 18: 311–318.
- 18. Fenton TR, Kim JH. A systematic review and meta‐analysis to revise the Fenton growth chart for preterm infants. BMC Pediatr 2013; 13: 59.
- 19. Hoftiezer L, Hof MHP, Dijs‐Elsinga J, et al. From population reference to national standard: new and improved birthweight charts. Am J Obstet Gynecol 2019; 220: 383.e1–383.e17.
- 20. Villar J, Cheikh Ismail L, Victora CG, et al; International Fetal and Newborn Growth Consortium for the 21st Century (INTERGROWTH‐21st). International standards for newborn weight, length, and head circumference by gestational age and sex: the Newborn Cross‐Sectional Study of the INTERGROWTH‐21st Project. Lancet 2014; 384: 857–868.
- 21. Wei Y, Pere A, Koenker R, He X. Quantile regression methods for reference growth charts. Stat Med 2006; 25: 1369–1382.
- 22. Goldenberg RL, Culhane JF, Iams JD, Romero R. Epidemiology and causes of preterm birth. Lancet 2008; 371: 75–84.
- 23. Bastek JA, Gómez LM, Elovitz MA. The role of inflammation and infection in preterm birth. Clin Perinatol 2011; 38: 385–406.
- 24. Kim CJ, Romero R, Chaemsaithong P, et al. Acute chorioamnionitis and funisitis: definition, pathologic features, and clinical significance. Am J Obstet Gynecol 2015; 213 (4 Suppl): S29–S52.
- 25. Zeitlin J, Ancel PY, Saurel‐Cubizollles MJ, Papiernik E. The relationship between intrauterine growth restriction and preterm delivery: an empirical approach using data from a European case–control study. BJOG 2000; 107: 750–758.
- 26. Park FJ, de Vries B, Hyett JA, Gordon A. Epidemic of large babies highlighted by use of INTERGROWTH21st international standard. Aust New Zeal J Obstet Gynaecol 2018; 58: 506–553.
Abstract
Objectives: To prepare more accurate population‐based Australian birthweight centile charts by using the most recent population data available and by excluding pre‐term deliveries by obstetric intervention of small for gestational age babies.
Design: Population‐based retrospective observational study.
Setting: Australian Institute of Health and Welfare National Perinatal Data Collection.
Participants: All singleton births in Australia of 23–42 completed weeks’ gestation and with spontaneous onset of labour, 2004–2013. Births initiated by obstetric intervention were excluded to minimise the influence of decisions to deliver small for gestational age babies before term.
Main outcome measures: Birthweight centile curves, by gestational age and sex.
Results: Gestational age, birthweight, sex, and labour onset data were available for 2 807 051 singleton live births; onset of labour was spontaneous for 1 582 137 births (56.4%). At pre‐term gestational ages, the 10th centile was higher than the corresponding centile in previous Australian birthweight charts based upon all births.
Conclusion: Current birthweight centile charts probably underestimate the incidence of intra‐uterine growth restriction because obstetric interventions for delivering pre‐term small for gestational age babies depress the curves at earlier gestational ages. Our curves circumvent this problem by excluding intervention‐initiated births; they also incorporate more recent population data. These updated centile curves could facilitate more accurate diagnosis of small for gestational age babies in Australia.