


Birthweight remains one of the strongest predictors of infant mortality and morbidity,1,2 and it has been established that assessing an infant’s birthweight requires summary data that account for gestational age.3 Birthweight percentiles form a reference incorporating weight and gestational age of infants at birth and are used as an adjunct for detecting neonates at higher risk of neonatal and postneonatal morbidity and growth impairment. A birthweight small or large for gestational age, often defined as being lower than the 10th percentile or higher than the 90th percentile, provides an indication of risk of perinatal morbidity and mortality.4
Australia’s first birthweight percentiles based on national population data were published in 1999.5 The period since this publication has seen numerous changes in maternal characteristics:
Maternal age has increased, with the proportion of mothers aged 35 years and over increasing from 15.7% in 1998 to 22.3% in 2007.6,7
The proportion of women reporting smoking during pregnancy has reduced from 18.4% in 20028 to 16.6% in 2007;7 with the proportion in New South Wales reducing from 22.0% in 1994 to 13.8% in 2005.9
Maternal overweight and obesity has increased in Australia, as it has in other developed countries,10 from 34% in the 1998–2002 calendar years11 to 50% in 2008.12 Mothers who are overweight or obese are more likely to have an indicated preterm birth, with infants born to overweight or obese women more likely to weigh more than 4 kg.13
The ethnicity of mothers in Australia has changed, with 22.0% in 1998 reporting that they were not born in Australia (7.4% were Asian born),6 compared with 24.3% in 2007 (9.6% Asian born).7
Identification of babies who are small or large for gestational age is important for clinical management,14 and Australian birthweight percentiles continue to be used for both clinical and research purposes.15,16 Current national birthweight percentiles are therefore required.
We excluded implausible birthweights using a method based on Tukey’s box-and-whisker plots.17 For each sex and gestational age combination, birthweights below the first quartile minus twice the interquartile range, or above the third quartile plus twice the interquartile range, were considered outliers and were excluded from analyses.
All analyses were performed using SAS 9.2 for Windows (SAS Institute Inc, Cary, NC, USA).
Between 1998 and 2007, there were 2539 237 live singleton births recorded (Box 1). Of these infants, 5.9% were born preterm (birth before 37 completed weeks of gestation) while 4.8% were low birthweight (< 2500 g) and 0.8% very low birthweight (< 1500 g) (Box 1). We excluded from analysis 1610 births (0.1%) for which one or more of the key variables — sex, birthweight and gestational age — was missing; among these were 12 with gestational age more than 44 weeks and 146 with sex recorded as indeterminate.
Of the 2537 627 live singleton births with gestational age between 20 and 44 weeks and available data on sex and birthweight, 8986 (0.4%) were removed as outliers, with 7599 (0.3%) being above the higher Tukey limit, and 1387 (0.1%) being below the lower Tukey limit. Percentiles were calculated for a total of 2528 641 births (1300 273 males and 1228 368 females).
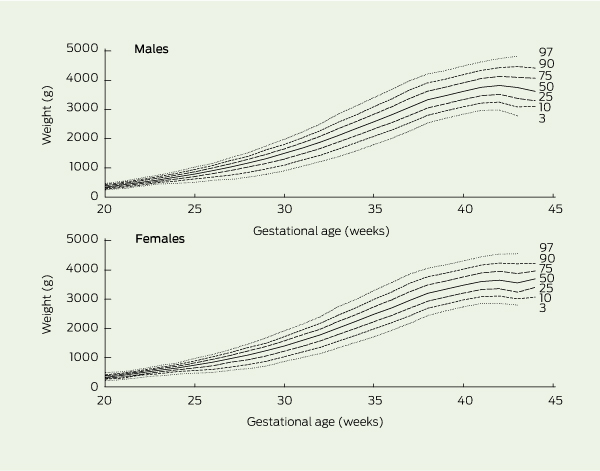
Box 2 shows birthweight percentiles by gestational age for male and female infants, and exact birthweight percentiles are listed in Box 3 and Box 4. Median birthweights were lower for female than male infants at all gestational ages apart from 44 weeks. The mean birthweight remained stable between 1998 and 2007 for both male and female infants (Box 5).
The birthweight percentiles presented are based on 10 years of high-quality population data that have been shown to be accurate and complete.18 Our percentiles provide a reference for babies born in Australia and update those published in 1999 to better reflect the characteristics of Australian mothers. The data are sufficient in number to provide reliable percentiles for babies of early gestational age. Our approach to excluding implausible birthweights has been used in constructing birthweight percentiles in other countries.4,19 The high quality of Australian birthweight data is demonstrated by the fact that the percentiles from the remaining observations resulted in curves that did not need smoothing.
Changes such as the increase in maternal age, obesity and use of assisted reproductive technology7 have resulted in small increases in the gestational age- and sex-specific birthweights. Comparing term babies of the same gestational age, the median birthweight is between 0 and 25 g higher for male infants, and between 5 g and 45 g higher for female infants, than 10 years ago. Similar increases in 90th and most 10th percentiles for boys and girls were also observed. While these increases may seem small, at a population level they have a large impact. A mean increase in birthweight of 23 g between 1990 and 2005 for male babies in NSW translated into an 18% increase in those identified as large for gestational age. For female babies, an increase of 25 g translated into a 21% increase in those identified as large for gestational age.9 Increases in age-specific 10th and 90th percentiles observed from current data will therefore increase the rate of small for gestational age and decrease the rate of large for gestational age for term births, compared with using the previous percentiles.
It is noteworthy that the mean birthweights are relatively stable over time, with a maximum variation over a decade of 13 g for male infants, and 6 g for female infants, in spite of changes in maternal characteristics associated with birthweight.9 This apparent contradiction can be explained by the fact that the mean birthweights are not adjusted for gestational age. For example, while rates of smoking during pregnancy have decreased, there has been a reduction in gestational age (with preterm births increasing from 6.8% of all births in 199120 to 7.4% in 20077). Hence, the expected increase in average birthweight as a result of reduced maternal smoking may have been offset by decreased birthweights from preterm births. It is difficult to assess how other changes in maternal characteristics act together to explain the stability in mean birthweights, highlighting the need for birthweight percentiles to be presented separately by sex and gestational age.
In contrast to the birthweight percentiles published using 1991–1994 calendar year data,5 we calculated percentiles for all singleton births in Australia. Therefore, our percentiles may not be directly comparable with the earlier percentiles derived from non-Indigenous singleton births to Australian-born mothers.
Customised birthweight percentiles have been recommended,21 but their usefulness has been debated.22 There are two recognised features of customised percentiles: first, they use regression-based coefficients adjusted for maternal factors; and, second, they use estimated fetal weight. It is primarily the estimate of fetal weight that contributes to improved prediction of adverse perinatal outcomes, rather than adjustment for maternal characteristics.22 However, fetal (in-utero) weights are not routinely assessed in current practice. Furthermore, the proposition that identifying small for gestational age from customised percentiles, rather than from population reference curves, better predicts adverse outcomes is based on inconsistent evidence.23,24 A simulation study demonstrated that the use of customised percentiles did not improve the identification of infants with intrauterine growth restriction, and concluded that, for the customisation to be useful, the factors used in the customisation model would need to explain an unrealistically high amount of variability in actual birthweight.22 Whether differing points of view and fine areas of disagreement on customised and conventional birthweight percentiles for gestational age have important practical research or clinical implications is questionable.25
Australian birthweight percentiles continue to be used in clinical practice and research.15 The percentiles presented here have a role as a basis for identifying high-risk babies and are recognisable, practical and easily incorporated into charts and presentations. These percentiles provide an up-to-date reference for clinicians and researchers.
Received 18 October 2011, accepted 20 May 2012
- Timothy A Dobbins1
- Elizabeth A Sullivan2
- Christine L Roberts3
- Judy M Simpson1
- 1 Sydney School of Public Health, University of Sydney, Sydney, NSW.
- 2 Perinatal and Reproductive Epidemiology Research Unit, University of New South Wales, Sydney, NSW.
- 3 Clinical and Population Perinatal Health Research, Kolling Institute, University of Sydney, Sydney, NSW.
This article is based on data made available by the Australian Institute of Health and Welfare (AIHW). The analysis and views expressed are those of the authors, and do not necessarily reflect the views of the AIHW. Christine Roberts is supported by a National Health and Medical Research Council Senior Research Fellowship (#457078). We thank Zhuoyang Li, Research Officer, Perinatal and Reproductive Epidemiology Research Unit, School of Women’s and Children’s Health, University of New South Wales, for assistance with data processing.
No relevant disclosures.
- 1. Graner S, Klingberg-Allvin M, Phuc HD, et al. Adverse perinatal and neonatal outcomes and their determinants in rural Vietnam 1999–2005. Paediatr Perinat Epidemiol 2010; 24: 535-545.
- 2. Ng SK, Olog A, Spinks AB, et al. Risk factors and obstetric complications of large for gestational age births with adjustments for community effects: results from a new cohort study. BMC Public Health 2010; 10: 460.
- 3. Lubchenco LO, Hansman C, Dressler M, Boyd E. Intrauterine growth as estimated from liveborn birth-weight data at 24 to 42 weeks of gestation. Pediatrics 1963; 32: 793-800.
- 4. Vashevnik S, Walker S, Permezel M. Stillbirths and neonatal deaths in appropriate, small and large birthweight for gestational age fetuses. Aust N Z J Obstet Gynaecol 2007; 47: 302-306.
- 5. Roberts CL, Lancaster PA. Australian national birthweight percentiles by gestational age. Med J Aust 1999; 170: 114-118. <MJA full text>
- 6. Nassar N, Sullivan EA, Lancaster P, Day P. Australia’s mothers and babies 1998. Canberra: AlHW, 2001. (AIHW Cat. No. PER 15; Perinatal Statistics Series No. 10.) http://www.aihw.gov.au/publication-detail/?id=6442467227 (accessed May 2012).
- 7. Laws P, Sullivan EA. Australia’s mothers and babies 2007. Canberra: AIHW, 2009. (AIHW Cat. No. PER 48; Perinatal Statistics Series No. 23.) http://www.aihw.gov.au/publication-detail/?id=6442468312 (accessed May 2012).
- 8. Laws P, Sullivan EA. Australia’s mothers and babies 2002. Canberra: AIHW, 2004. (AIHW Cat. No. PER 28; Perinatal Statistics Series No. 15.) http://www.aihw.gov.au/publication-detail/?id=6442467675 (accessed May 2012).
- 9. Hadfield RM, Lain SJ, Simpson JM, et al. Are babies getting bigger? An analysis of birthweight trends in New South Wales, 1990–2005. Med J Aust 2009; 190: 312-315. <MJA full text>
- 10. Heslehurst N, Ells LJ, Simpson H, et al. Trends in maternal obesity incidence rates, demographic predictors, and health inequalities in 36,821 women over a 15-year period. BJOG 2007; 114: 187-194.
- 11. Callaway LK, Prins JB, Chang AM, McIntyre HD. The prevalence and impact of overweight and obesity in an Australian obstetric population. Med J Aust 2006; 184: 56-59. <MJA full text>
- 12. Dodd JM, Grivell RM, Nguyen AM, et al. Maternal and perinatal health outcomes by body mass index category. Aust N Z J Obstet Gynaecol 2011; 51: 136-140.
- 13. Dodd JM, Turnbull DA, McPhee AJ, et al. Limiting weight gain in overweight and obese women during pregnancy to improve health outcomes: the LIMIT randomised controlled trial. BMC Pregnancy Childbirth 2011; 11: 79.
- 14. Bonellie S, Chalmers J, Gray R, et al. Centile charts for birthweight for gestational age for Scottish singleton births. BMC Pregnancy Childbirth 2008; 8: 5.
- 15. Flenady V, King J, Charles A, et al; Perinatal Society of Australia and New Zealand Perinatal Mortality Group. PSANZ clinical practice guideline for perinatal mortality. Version 2.2. April 2009. http://www.stillbirthalliance.org.au/doc/Section_7_Version_2.2_April_2009.pdf (accessed May 2012).
- 16. Gordon A, Raynes-Greenow C, McGeechan K, et al. Stillbirth risk in a second pregnancy. Obstet Gynecol 2012; 119: 509-517.
- 17. Tukey JW. Exploratory data analysis. Reading, Mass: Addison-Wesley, 1977.
- 18. Lain SJ, Hadfield RM, Raynes-Greenow CH, et al. Quality of data in perinatal population health databases: a systematic review. Med Care 2012; 50: e7-e20.
- 19. Arbuckle TE, Wilkins R, Sherman GJ. Birth weight percentiles by gestational age in Canada. Obstet Gynecol 1993; 81: 39-48.
- 20. Lancaster P, Huang J, Pedisich E, Australian Institute of Health and Welfare Perinatal Statistics Unit. Australia’s mothers and their babies 1991. Canberra: AIHW, 1994. (AIHW Cat. No. AIHW 240; Perinatal Statistics Series No. 1.) http://www.aihw.gov.au/publication-detail/?id=6442466628 (accessed May 2012).
- 21. Resnik R. One size does not fit all. Am J Obstet Gynecol 2007; 197: 221-222.
- 22. Hutcheon JA, Zhang X, Platt RW, et al. The case against customised birthweight standards. Paediatr Perinat Epidemiol 2011; 25: 11-16.
- 23. Hutcheon JA, Zhang X, Cnattingius S, et al. Customised birthweight percentiles: does adjusting for maternal characteristics matter? BJOG 2008; 115: 1397-1404.
- 24. Larkin JC, Hill LM, Speer PD, Simhan HN. Risk of morbid perinatal outcomes in small-for-gestational-age pregnancies: customized compared with conventional standards of fetal growth. Obstet Gynecol 2012; 119: 21-27.
- 25. Resnik R. To customise or not to customise: that is the question. Paediatr Perinat Epidemiol 2011; 25: 17-19.
Abstract
Objective: To present updated national birthweight percentiles by gestational age for male and female singleton infants born in Australia.
Design and setting: Cross-sectional population-based study of 2.53 million singleton live births in Australia between 1998 and 2007.
Main outcome measures: Birthweight percentiles by gestational age and sex.
Results: Between 1998 and 2007, women in Australia gave birth to 2 539 237 live singleton infants. Of these, 2 537 627 had a gestational age between 20 and 44 weeks, and sex and birthweight data were available. Birthweight percentiles are presented by sex and gestational age for a total of 2 528 641 births, after excluding 8986 infants with outlying birthweights. Since the publication of the previous Australian birthweight percentiles in 1999, median birthweight for term babies has increased between 0 and 25 g for boys and between 5 g and 45 g for girls.
Conclusions: There has been only a small increase in birthweight percentiles for babies of both sexes and most gestational ages since 1991–1994. These national percentiles provide a current Australian reference for clinicians and researchers assessing weight at birth.