


The effects of climate change are felt by populations around the world and across income groups, with the health of the Australian public uniquely at risk.1,2 In response to growing and concerning evidence, leading health bodies, including the Australian Nursing and Midwifery Federation, the Australian Medical Association, the Australian College of Nursing, and the majority of the medical colleges, have all declared climate change a health emergency — urging an accelerated response to reducing emissions and preparing health systems.3,4,5,6,7,8,9,10,11,12
Compounding the longer term effects of climate change, Australia has faced two acute national emergencies over the past 12 months, in the form of the unprecedented and catastrophic 2019–20 Australian bushfire season and the global coronavirus disease 2019 (COVID‐19) pandemic. In the first instance, compelling attribution studies provide direct links between climate change and the health impacts of the 2019 bushfire season;13 in the second, it is likely that the COVID‐19 pandemic recovery and stimulus packages will influence a decade of international and Australian climate policy.14
The 2020 MJA–Lancet Countdown report represents the work of five Australian institutions in collaboration with University College London, brought together by an evolving partnership between The Lancet and The Medical Journal of Australia. The collaboration tracks the links between public health and climate change across five domains: climate change impacts, exposures and vulnerability; adaptation, planning and resilience for health; mitigation actions and health co‐benefits; economics and finance; and public and political engagement.
Given the events of 2019 and the first half of 2020 described above, this year’s report focuses on the relationship between health, climate change and bushfires, highlighting indicators that explore these linkages. The full suite of indicators, reporting across each of the five domains, will return in 2021.
Methods
We tracked progress on health and climate change in Australia across 12 indicators within the five broad domains. We focused on two or three specific indicators in each of the domains. Where possible, we adopted the methods used by the Lancet Countdown, including those used in its 2020 report.15 Where more appropriate for an Australia‐focused assessment, or where it was possible to refine or improve on the original method as more precise and comprehensive data or methods were available at the national level, the method for the Australian indicators was modified or an alternative method was employed.
Consistent with developments in the Lancet Countdown,2,15 a new indicator is introduced this year: the “Economic costs of air pollution” indicator (4.2).
Full details of our methods, data and caveats are provided for each indicator in the Supporting Information and numbered accordingly. We also provide a brief summary of the method within the text for each indicator here.
Section 1: Climate change impacts, exposures and vulnerability
Already, Australians have experienced more intense heatwaves, altered patterns of infectious disease, and food insecurity driven by a changing climate, with the attendant impacts on physical and mental wellbeing.1,16 With average temperatures 1.52°C above and nationally averaged total rainfall 40% below the 1961–1990 average, 2019 was Australia’s hottest and driest year on record, resulting in unprecedented bushfires across the country.17 In this section, we present short and long term changes in exposure to temperature change and heatwaves, as well as the related effects on bushfire risk and exposure.
1.1 Exposure to temperature change
Heat stress and heat stroke, due to rising temperatures and extremes of heat, adversely affect the Australian population as a whole, but disproportionately affect vulnerable groups within it, such as those with cardiovascular and renal disease, who may suffer disease exacerbations in these conditions.
This indicator examines Australia‐wide population exposure to rising summer temperature change (December–February) relative to the baseline period 1981–2010. Relative to this baseline, an ordinary least squares linear regression analysis over the past two decades demonstrates that summer maximum temperatures have risen about 1.54°C (Box 1). Further historical analysis suggests an increasing rate of change over the past 50 summers. Weighting such change by population density as measured in the 2011 national census, the 50‐year and 20‐year summer maximum temperature rises are 0.14°C and 0.72°C respectively, revealing the protective nature of the Australian coast and relative vulnerability of inland populations (Supporting Information 1.1).
1.2 Health effects of heatwaves
In recent years, multiple studies have demonstrated the effects of heatwaves on excess ambulance demand, hospital admissions and mortality in several sites across Australia.18,19 This indicator tracks change in a measure of heatwave intensity — the excess heat factor — as it applies to human health.20,21 The excess heat factor is based on 3‐day‐averaged daily mean temperatures. Box 2 shows the Australian averaged accumulated excess heat factor over the past 20 heatwave seasons (November–March).
Calculating two trends through these data (the 20 years presented, and a longer 50‐year trend extending from 1970 to 2020) allows an assessment of long term change, which demonstrates a 37% increase in excess heat factor over this 20‐year period, as well as an understanding of the accelerated rate of change, with a 136% rise seen over the past 20 heatwave seasons. Weighting the accumulated excess heat factor according to the population density has a similar result, with the 50‐ and 20‐year heatwave season accumulated excess heat factor rises being 33% and 97% respectively (Supporting Information 1.2).
1.3 Bushfires
The 2019–20 bushfires lasted 3 months in total, spanned 10 million hectares, destroyed more than 3000 homes, and resulted in 33 deaths directly.22 In total, they cost about $100 billion, blanketing Australia’s major cities in thick smoke for weeks on end, resulting in record levels of air pollution, almost ten times the hazardous rating.23 In turn, this smoke exposure resulted in an estimated 417 excess deaths, 1305 asthma emergency department presentations, and 3151 hospital admissions for cardiovascular and respiratory conditions.24 Other health effects of the fires, yet to be quantified, include acute and lingering mental health impacts of experiencing trauma of evacuation and dislocation; loss of family and friends, property, livelihoods and natural amenity; and fear about the future. In addition, the potential impacts on frontline responders, especially on firefighters (the physical and mental exhaustion, the emotional trauma, the chronic exposure to smoke, and the loss of income for many volunteer firefighters) should not be underestimated.
A robust attribution study of the 2019–20 bushfires demonstrates the role of climate change in these fires, highlighting the importance of rising temperature extremes and persistent drought, and echoing previous findings for other bushfires.13,25,26 This indicator reports change in days when the Fire Danger Index is high to extreme (4–6), as well as population exposure to bushfires since 2001, using the same data and methodology described in the 2020 global Lancet Countdown report.15 Considering area‐weighted change, Australia has experienced one of the greatest increases in fire risk globally, with an annual average increase of 30.6 days of high to extreme Fire Danger Index in 2016–2019 compared with 2001–2004. Box 3 presents the change in the annual average days of population exposure to bushfires in 2001–2004 and 2016–2019 in New South Wales and Australia. Nationally, there has been a 22% increase in the annual average in the most recent period compared with the 2001–2004 baseline period. Due to the “Black Summer” bushfires, the 102 799 person‐days of exposure to bushfires in 2019 in NSW was by far the highest of any year over the period 2001–2019, with the second highest being 71 452 in 2002 (Box 3; Supporting Information 1.3 and figure A1).
Section 2: Adaptation, planning and resilience for health
Adaptation is essential to manage the current and future effects of climate change, with multiple interdependencies between the imperative to strengthen the health system and efforts to cope with current public health challenges. Indeed, there are parallels between emergency preparedness measures for extreme weather and those needed to respond to COVID‐19.27 This year, Section 2 reports updates on Australian adaptation plans for health (indicator 2.1) and city‐level climate change risk assessments (indicator 2.2), and includes further discussion on adaptation responses to Australia’s worsening bushfires.
2.1 Australian adaptation plans for health
Despite clear and present need, Australia still lacks a nationwide climate change adaptation plan for health. However, it is worth noting the leadership from states and territories, with each having a climate change adaptation plan that includes the health sector in some way. In 2019, the State Government of Victoria published its Pilot health and human services climate change adaptation action plan 2019–21,28 becoming the second state after Queensland to have a specific health adaptation plan. Tasmania continues to develop its first health adaptation plan, and Western Australia has conducted a Climate and Health Inquiry under the Public Health Act 2016 (WA)29 (Supporting Information 2).
2.2 City‐level climate change risk assessments
A total of ten Australian city and shire councils reported having completed a climate change risk and vulnerability assessment in 2019 — three more than in 2018.30 The Cities Power Partnership (https://citiespowerpartnership.org.au/), a network of local government councils leading the response to climate change, now has more than 120 participating councils, an increase of 21% from the 99 we reported in 2019, covering more than 50% of the population (Supporting Information 2).
2.3 Bushfire adaptation
Moving from broad adaptation planning to measures specific to bushfires, continued reluctance to acknowledge the threats posed by climate change at the federal level has hindered progress. The government was warned of the specific dangers of the 2019–20 bushfire season by firefighting experts as early as April 2019.31 Even as the fires played out, the federal government was slow to form any national response to the multijurisdictional crisis.32
A national taskforce on bushfire adaptation would be an important step for future fire seasons, facilitating planning and prevention (eg, early warning forecasts, hazard reduction, and evacuation planning). Any such effort would increase capacity for resource sharing (including personnel) between regions and states, as this capacity is increasingly diminished when large‐scale fires occur simultaneously in multiple jurisdictions. It would also facilitate international coordination with New Zealand, the United States and Canada when resource‐sharing becomes more difficult as fire seasons in both hemispheres extend and overlap. Part of this work would build on the recommendations for the need for a national health protection strategy to minimise harm from bushfire smoke exposure.33,34
A national Royal Commission into Australia’s devastating Black Summer bushfires was established (the Royal Commission into National Natural Disaster Arrangements). Its terms of reference were broad and it was directed to examine, among other things:
- the responsibilities of, and coordination between, Australian, state, territory and local governments relating to natural disasters;
- Australia’s arrangements for improving resilience and adapting to changing climatic conditions;
- what actions should be taken to mitigate the impacts of natural disasters; and
- whether changes are needed to Australia’s legal framework for the involvement of the Commonwealth in responding to national emergencies.35
Given the escalating impacts of bushfires in Australia and the urgency for adaptation and planning, we intend to introduce a bushfire adaptation indicator in 2021. Such an indicator could track a range of measures, including the prevalence of households with a smoke alarm, response times to structure fires, the number of firefighting personnel, and the number of firefighting aircraft.36
Section 3: Mitigation actions and health co‐benefits
Emissions from the 2019–2020 fires in temperate forest in NSW and Victoria were equivalent to adding more than a year’s worth of Australian greenhouse gas emissions to the atmosphere, even without taking into account the fires in Queensland, South Australia, WA and the Northern Territory.22,37
Avoiding the worst health impacts of climate change, meeting the United Nations climate change agreement and limiting warming to “well below 2°C” require global emissions to rapidly decline over the next 10 years and reach net zero by 2050.38,39 While the federal government is yet to join the United Kingdom, the European Union and New Zealand in committing to a net zero target, all Australian state and territory governments have now made such commitments.40,41,42,43,44,45,46,47 Australia would have an opportunity to promote investments in a net zero emissions future through the economic stimulus measures in response to COVID‐19; for example, through an expansion of its renewable energy systems, green buildings and sustainable transport infrastructure. However, such opportunities have not been prioritised in policy decisions, even though well designed policies and investments could yield large and immediate health benefits through reductions in air pollution and increased physical activity, in addition to the mitigation of climate change and its impacts.
3.1 Energy system and health
For this year’s report, this indicator combines three indicators of mitigation of Australia’s energy system, using data from the International Energy Agency.48,49,50 Here, it is clear that Australia’s mitigation response remains inadequate. Australia is the only Organisation for Economic Co‐operation and Development (OECD) country to have worsened the carbon intensity of its energy supply over the past three decades, which is now 36% worse than the global average. Australia continues to have a heavy reliance on coal, which represented a share of 60.4% of total power generation in 2018 (a drop from 62.8% in 2017). Wind and solar power are growing; however, they remain a small share of total generation, rising from 8% in 2017 to 9.6% in 2018 (Supporting Information 3.1).
3.2 Exposure to air pollution in cities
The annual average background concentration of particulate matter less than 2.5 μm in diameter (PM2.5) in typical urban settings in Australia is generally low by international standards. However, the contribution of extreme events such as bushfires and dust storms, as well as regular seasonal variation due to dry season fires in the NT and domestic wood heater use has led to periods of harmful pollution levels. Most of Australia’s premature deaths attributable to PM2.5 come from households, road transport and industry, providing opportunities to improve health through mitigation policies.15 This analysis calculates average PM2.5 concentration for all major Australian cities from 2000 to 2019 where data are available. We averaged city‐specific levels by state and territory (Box 4). While the annual average PM2.5 concentrations were generally below the Australian advisory reporting standard of 8 μg/m3, major bushfire seasons such as those that occurred in NSW in 2001–02, 2002–03 and 2019–20 were so extreme that they influenced the annual average PM2.5 concentrations in those years. At 13.0 μg/m3 and 11.2 μg/m3 respectively, the ACT and NSW annual average PM2.5 concentrations in 2019 far exceeded all previous years across all states and territories in this 20‐year analysis. Similarly, the monthly PM2.5 concentrations in the ACT and NSW in December 2019 were the highest of any month in this 20‐year analysis, reaching an average of 71.6 μg/m3 and 26.0 μg/m3 respectively (Supporting Information 3.2).
Section 4: Economics and finance
Extensive research has made clear that the benefits of a low carbon transition combined with avoided costs of climate change far outweigh any initial investment costs. One recent study estimated that, compared with current commitments, limiting warming to 1.5°C by 2100 would generate a global accumulated net benefit of US$264–610 trillion; that is, 3.1–7.2 times the 2018 global economy.51 Recent trends in economic losses due to climate‐related extreme events and economic costs of air pollution (indicators 4.1 and 4.2) are presented in this section, with other indicators of the transition to a zero carbon economy, including investments and employment in zero carbon energy, returning in 2021.
4.1 Economic losses due to climate‐related extreme events
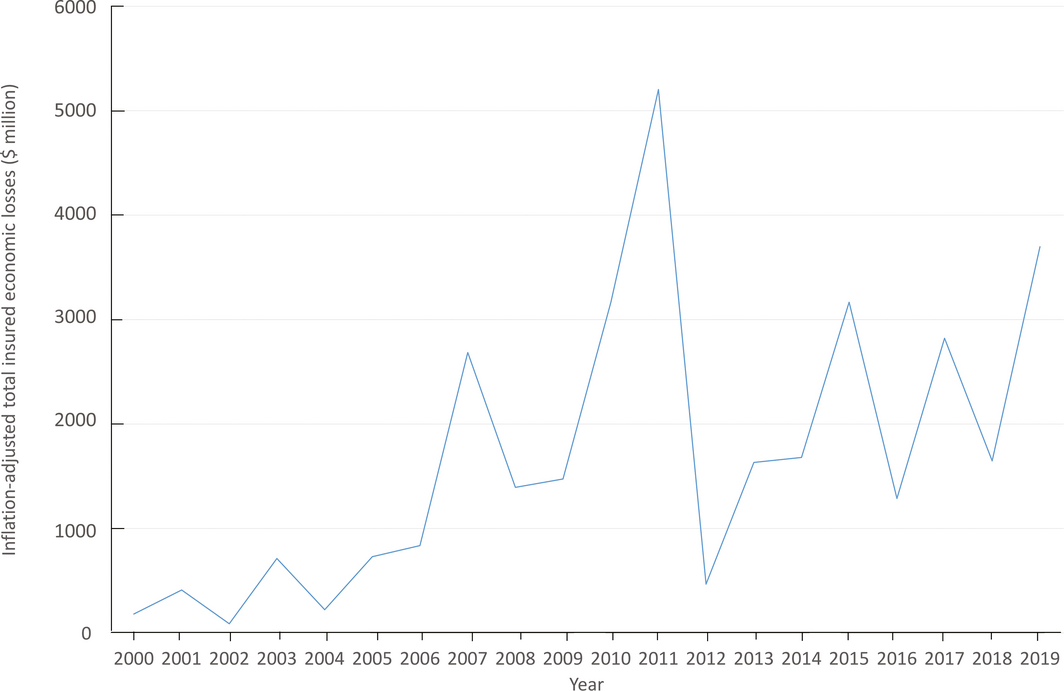
Total insured economic losses from disaster events are tracked in this indicator, based on numbers provided by the Insurance Council of Australia.52 Box 5 plots inflation‐adjusted cumulative annual insured losses arising from bushfires, cyclones, flooding, hailstorms, and tornadoes from 2000 to 2019. For 2019, the estimate for total annual insured losses from these events was $3.70 billion — the second highest across the 20‐year period. The severe bushfires across NSW, Queensland, SA and Victoria accounted for $2.2 billion of these losses, although the total costs of these bushfires could be orders of magnitude higher.23 Data from 2019 captured a second noteworthy extreme event: torrential rainfall and widespread flooding in North Queensland over January and February, resulting in losses of about $1.27 billion (Supporting Information 4.1).
4.2 Economic costs of air pollution
New to the 2020 report, this indicator tracks the economic cost of air pollution on human health. In 2015, more than 2500 deaths (1.6% of total deaths), corresponding to about 29 000 years of life lost were attributable to urban ambient PM2.5 in Australia.53 In addition, an estimated 8700 years lived with disability in Australia in 2015 were attributable to air pollution.53 Air pollution is also one of the ten leading risk factors contributing to death for men in the 85–94 and over 95 years age groups, and women in the 75–84, 85–94 and over 95 years age groups. Applying an estimated economic value of a statistical life year of $185 000 for 2015,54 the health costs from mortality due to air pollution alone are estimated to be around $5.3 billion per year; however, this estimate is sensitive to strong assumptions and details of the method chosen and may not be easily comparable to other estimates of health costs.
As discussed in the previous sections, climate change and the rising risk of bushfires in Australia can be expected to exacerbate the economic cost of air pollution, with large numbers of deaths and hospitalisations already attributed to air pollution from the 2019–20 bushfires24 (Supporting Information 4.2).
Section 5: Public and political engagement
As the preceding sections have highlighted, the health impacts of climate change are worsening rapidly, necessitating stronger engagement and understanding across all spheres of society. Section 5 examines this, centring on engagement within the media and the scientific community (indicators 5.1 and 5.2).
5.1 Media coverage of health and climate change
This indicator continues to track Australian media coverage on health and climate change. We used the same methods as reported previously, analysing 13 national and regional high circulation English‐language newspapers from 2008 to 2019, as well as Australian Broadcasting Corporation (ABC) online news and transcripts of the ABC online programs.1 It is clear that the extreme heat and bushfires of 2019 have resulted in increased media engagement with health and climate change. With 127 pieces in 2019, the total number of newspaper articles on health and climate change was almost double the number (n = 65) in 2018. National newspapers have had the most growth, followed by newspapers in Sydney and Hobart (Box 6). At the same time, online coverage from the ABC on health and climate change has more than tripled (Supporting Information 5.1 and figure A2).
5.2 Scientific engagement in health and climate change
Using search terms in Scopus databases as described in the 2019 MJA–Lancet Countdown report, this indicator tracks scientific publications on health and climate change in Australia.1 The number of publications in 2019 (n = 99) represents a significant increase from the 66 in 2018, standing as the highest number recorded over the past decade (Box 7). In a preliminary analysis of the first 4 months of 2020, this trend continues, and there is a clear increasing proportion of studies related to bushfire impacts and management — 22% compared with 7% in 2019.
In this report, we also present, for the first time, data on National Health and Medical Research Council (NHMRC) health and climate change grant applications from 2000 to 2018 (Box 8). After a period of limited grant applications on health and climate change per year (two to three) from 2000 to 2005, the number peaked at 33 in 2010, due to a partnership between the NHMRC and the former Department of Climate Change. However, since then, the annual rate has decreased every year, to seven applications in 2018. In keeping with the field, the success rate of these applications has been volatile, dropping below 20% in the past decade and with none of the 29 applications submitted in 2013 and 2014 being successful. The NHMRC has since committed $10 million over 5 years for a special research initiative, commencing in 2021, to boost research capacity and capability to address health implications of environmental change. In addition, $5 million funds from the Medical Research Future Fund were allocated for research into the health impacts of bushfire in early 2020 (Supporting Information 5.2).
Conclusion: the MJA–Lancet Countdown in 2020
With 2019 being the hottest year on record in Australia, the indicators of the 2020 report of the MJA–Lancet Countdown document concerning trends in exposure to high summer temperatures, heatwaves and bushfires.
The 2019–20 bushfires were intense and expansive, resulting in about 450 deaths due to direct injury and air pollution exposure. The air pollution was so severe that it made the NSW annual average PM2.5 concentration by far the highest in the past 20 years. The direct insured losses of the bushfires are estimated at $2.21 billion over the 5‐month period, while many other impacts remain uncounted.
Despite a lack of adaptive capacity and of progress in reducing emissions, there is growing awareness of and engagement with the links between health and climate change. This is illustrated in the doubling in the number of newspaper articles and the 50% increase in scientific publications on the topic in Australia from 2018 to 2019. Australia’s leading medical and nursing bodies have recognised climate change as a health emergency, and each state and territory government has committed to a net‐zero target by 2050 at the latest.
As Australia recovers from the compounded effects of the bushfires and begins to emerge from the COVID‐19 pandemic, the health professions have a pivotal role to play. They are uniquely suited to integrate the response to these short term threats, with the longer term public health implications of climate change, and to advocating that the economic recovery from COVID‐19 aligns and strengthens Australia’s commitments under the Paris Agreement.
Box 1 – Nationally averaged Australian summer (December–February) maximum temperature anomalies for the past 20 summers (2000–2001 to 2019–2020)*
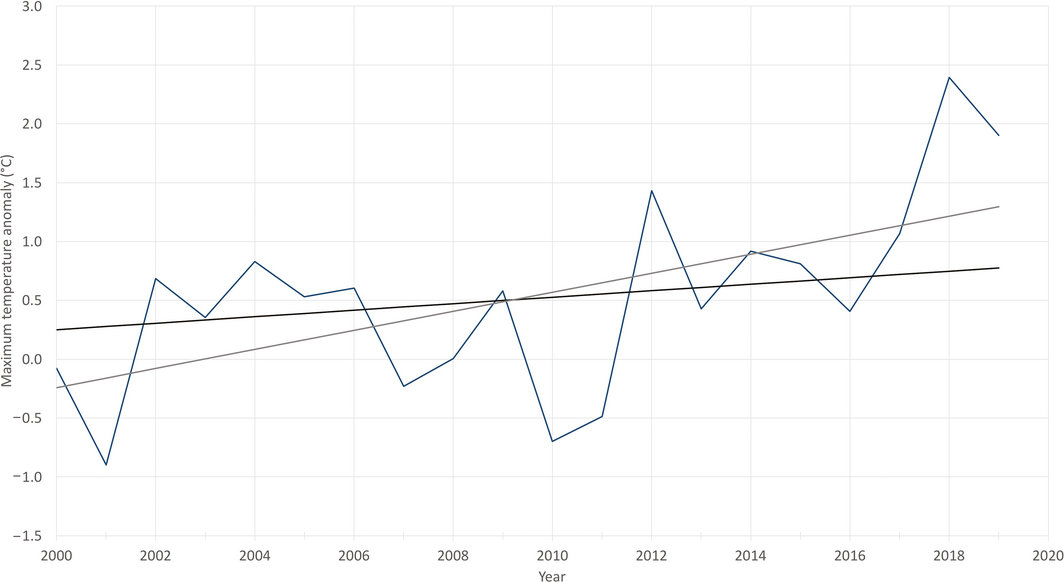
*The base period for the anomalies is 1981–2010. The black trend line is calculated over the past 50 summers (1970–1971 to 2019–2020), while the grey trend line is calculated over the past 20 summers. Data sources: Bureau of Meteorology and Australian Bureau of Statistics.
Box 2 – Nationally averaged Australian heatwave season (November–March) accumulated excess heat factor (EHF) for the past 20 heatwave seasons (2000–2001 to 2019–2020)*
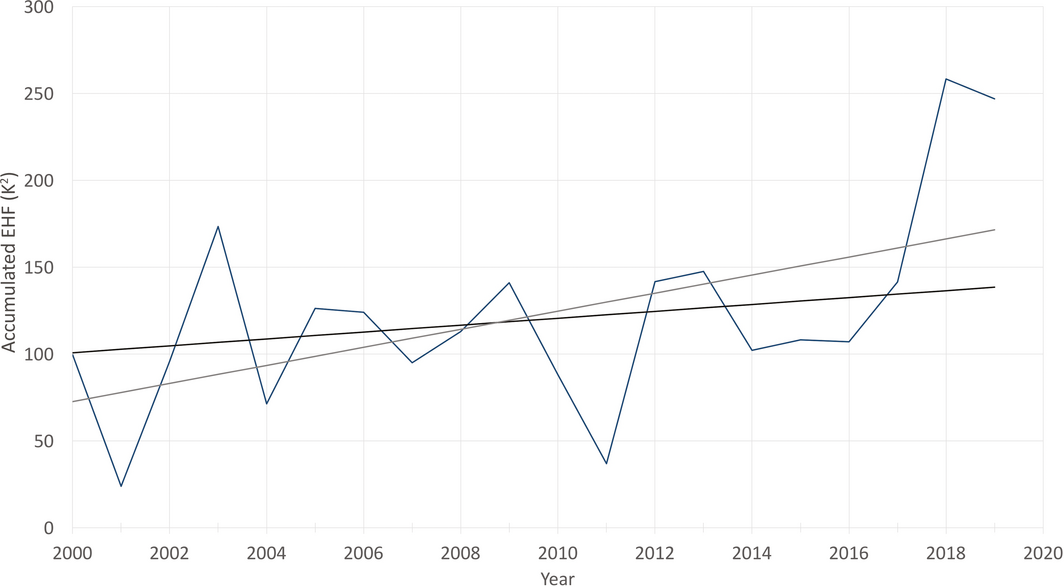
*The black trend line is calculated over the past 50 heatwave seasons (1970–1971 to 2019–2020), while the grey trend line is calculated over the past 20 heatwave seasons. Data sources: Bureau of Meteorology and Australian Bureau of Statistics.
Box 3 – Annual person‐days exposed to bushfires during 2001–2004 and 2016–2019 in New South Wales and Australia
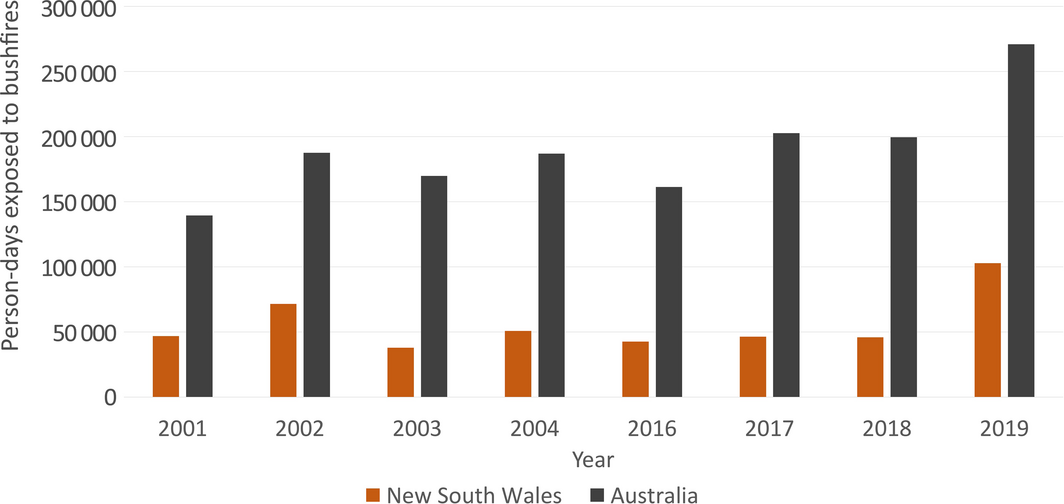
Data source: NASA.
Box 4 – Annual and monthly average fine particulate matter less than 2.5 μm in diameter (PM2.5) for cities in each Australian state and territory from 2000 to 2019, overlaid together in smoothed time‐series plots to display the contribution of major fire events (2001–02, 2002–03 and 2019–20) and dust storms (2009) to the annual averages*
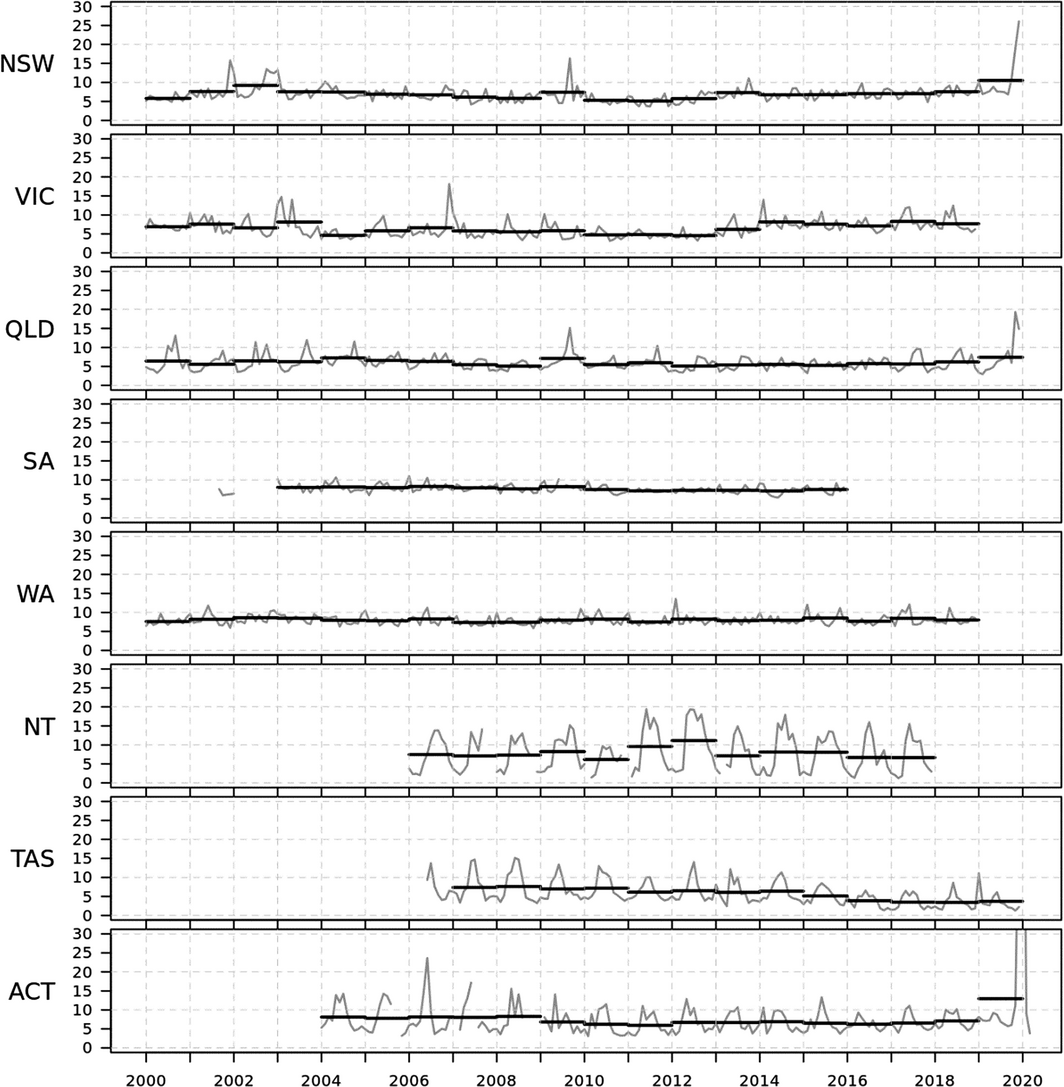
ACT = Australian Capital Territory; NSW = New South Wales; NT = Northern Territory; QLD = Queensland; SA = South Australia; TAS = Tasmania; VIC = Victoria; WA = Western Australia. * PM 2.5 units are μg/m3. Data sources: Australian Bureau of Statistics and relevant state and territory government authorities as detailed in Supporting Information 3.2.
Box 5 – Annual inflation‐adjusted total insured economic losses in Australia from bushfires, cyclones, flooding, hailstorms, storm flooding, and tornadoes for the period 2000–2019 based on the Historical Catastrophe Database of the Insurance Council of Australia (ICA)
Box 6 – Annual number of media articles on health and climate change by regions in Australia, 2008–2019
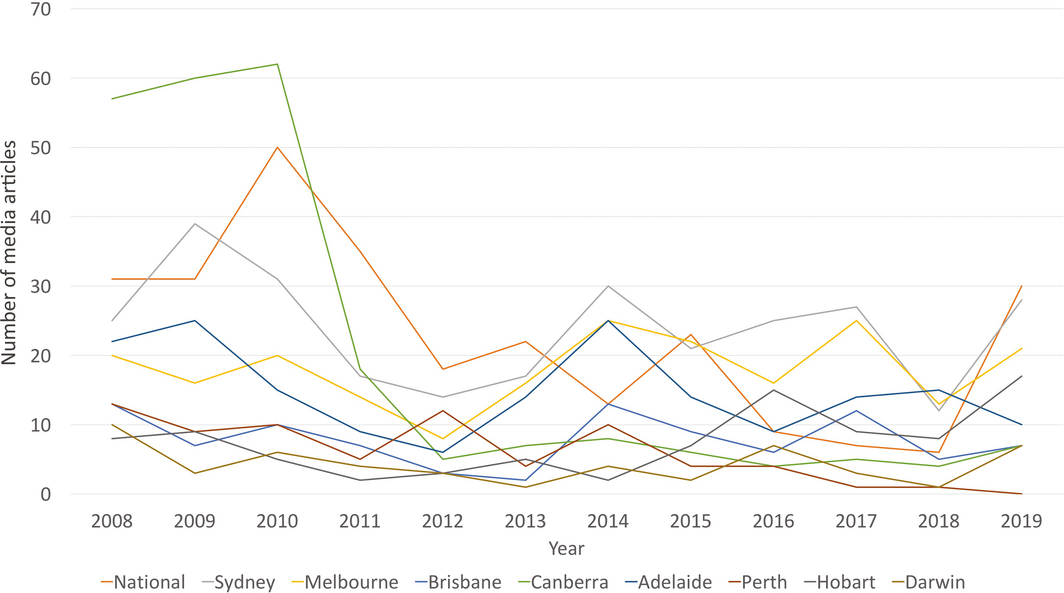
Data source: Factiva (Dow Jones).
Box 7 – Number of scientific publications on health and climate change in Australia, 2008–2019
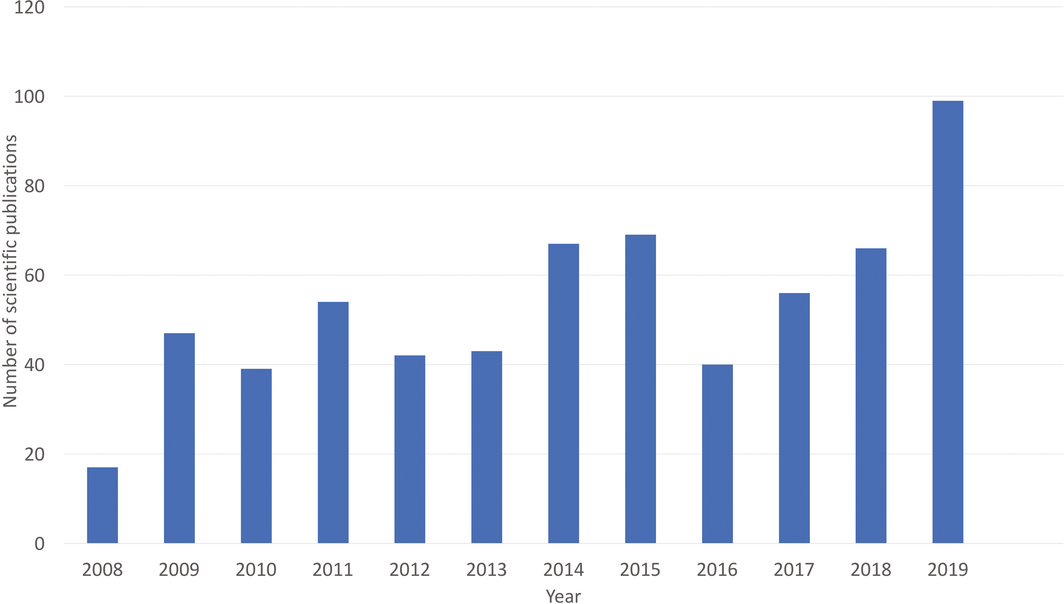
Data source: Scopus (Elsevier).
Box 8 – Funded and not‐funded National Health and Medical Research Council (NHMRC) grant applications with a focus on health and climate change, and success rate, between 2000 and 2018
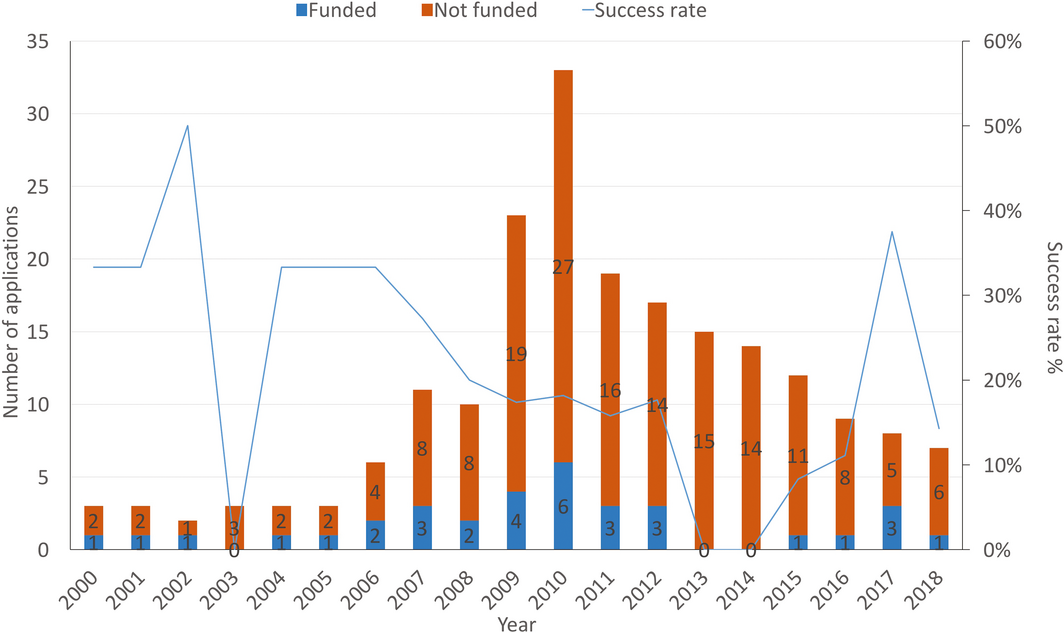
Source: NHMRC.55
Provenance: Not commissioned; externally peer reviewed.

Summary