


Weather conditions conducive to extreme bushfires are becoming more frequent as a consequence of climate change.1 Such fires have substantial social, ecological, and economic effects, including the effects on public health associated with smoke, such as premature mortality and exacerbation of cardio‐respiratory conditions.2,3 During the final quarter of 2019 and the first of 2020, bushfires burned in many forested regions of Australia, and smoke affected large numbers of people in New South Wales, Queensland, the Australian Capital Territory and Victoria. The scale and duration of these bushfires was unprecedented in Australia. We undertook a preliminary evaluation of the health burden attributable to air pollution generated by bushfires during this period.
Using standard methods for assessing the health impact of air pollution,4 we estimated the numbers of excess deaths, hospitalisations for cardiovascular and respiratory problems, and emergency department presentations with asthma in NSW, Queensland, the ACT and Victoria between 1 October 2019 and 10 February 2020 that could be attributed to bushfire smoke exposure.
We estimated population exposure to particulate matter less than 2.5 μm in diameter (PM2.5) for the regions of NSW, Queensland, the ACT and Victoria for which publicly available air quality monitoring data were available (for about 90% of the total population of these states). Data were obtained from the NSW Department of Planning, Industry and Environment,5 the Queensland Department of Science,6 ACT Health,7 and the Environmental Protection Agency Victoria.8 We defined bushfire smoke‐affected days as days on which the 24‐hour mean PM2.5 concentration exceeded the 95th percentile of historical daily mean values for individual air quality stations. We estimated daily mean PM2.5 levels by Statistical Area Level 2 (SA2), using station level data whenever at least one monitoring station was within 100 km of the SA2 centroid, and applying inverse distance weighting.9
Published population and health data from the Australian Bureau of Statistics,10,11 the Australian Institute of Health and Welfare,12,13,14,15 and the NSW Ministry of Health were used.16 We quantified health outcomes by combining baseline incidence rates12,13,14,15 for each health outcome with daily exposure data and applying the relevant exposure–response risk coefficients for each outcome.17,18 We also conducted sensitivity analyses with different PM2.5 thresholds for defining bushfire smoke‐affected days. Further methodological details, including underlying assumptions and limitations, are included in the online Supporting Information. Our analysis of publicly available aggregated data did not require ethics approval.
During the study period, PM2.5 concentrations exceeding the 95th percentile of historical daily mean values were recorded by at least one monitoring station in the study area on 125 of 133 days (Box 1). We estimated that bushfire smoke was responsible for 417 (95% CI, 153–680) excess deaths, 1124 (95% CI, 211–2047) hospitalisations for cardiovascular problems and 2027 (95% CI, 0–4252) for respiratory problems, and 1305 (95% CI, 705–1908) presentations to emergency departments with asthma (Box 2). Applying lower thresholds for defining bushfire smoke‐affected days (no threshold, 90th percentile of historical values) did not markedly alter our findings; a higher threshold (99th percentile) reduced the estimates by about 20%. The highest population‐weighted PM2.5 exposure level, 98.5 μg/m3 on 14 January 2020 (Box 1), exceeded the national air quality 24‐hour standard (25 μg/m3)19 and was more than fourteen times the historical population‐weighted mean 24‐hour PM2.5 value of 6.8 μg/m3.
We have estimated the excess health burden during 19 weeks’ continuous fire activity in the states most severely affected by smoke. Our estimates are based on air quality data from monitoring stations in the four eastern states — that is, we did not include data for smoke from all extreme fires in Australia during the study period — and we did not attempt to estimate health effects for which exposure–response relationships are less well characterised, such as primary health care attendances and ambulance calls. Detailed epidemiological analysis of more comprehensive exposure estimation and empirical health data will provide more complete information about the harms attributable to the severe air pollution associated with these unprecedented fires, but our findings indicate that the smoke‐related health impact was substantial. Smoke is just one of many problems that will intensify with the increasing frequency and severity of major bushfires associated with climate change. Expanded and diversified approaches to bushfire mitigation and adaptation to living in an increasingly hot and fire‐prone country are urgently needed.20
Box 1 – Population‐weighted PM2.5 levels, New South Wales, Queensland, the Australian Capital Territory and Victoria, 1 October 2019 – 10 February 2020*
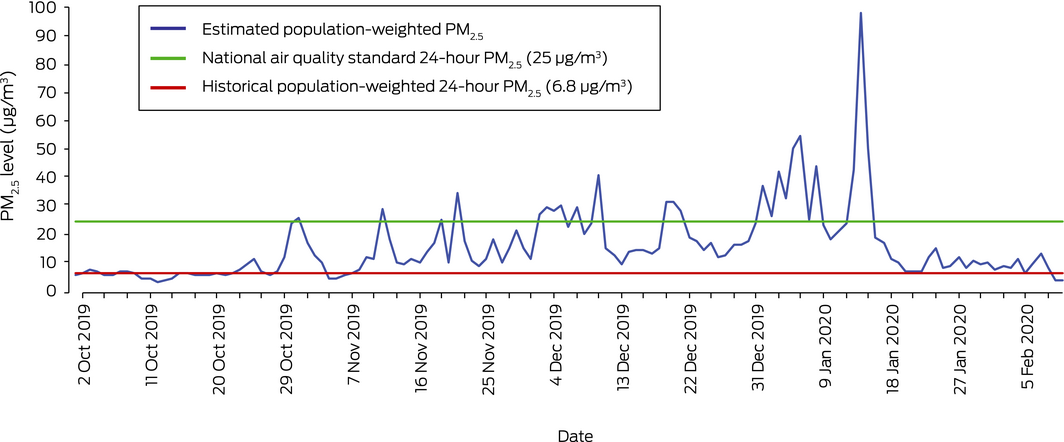
* Data by state are included in the online Supporting Information.
Box 2 – Estimated health burden attributable to bushfire smoke, Queensland, New South Wales, the Australian Capital Territory and Victoria, 1 October 2019 – 10 February 2020
|
Outcome |
Estimated number of cases (95% confidence intervals) |
||||||||||||||
|
Queensland |
New South Wales |
Australian Capital Territory |
Victoria |
Total |
|||||||||||
|
|
|||||||||||||||
|
Excess deaths (any cause) |
47 (17–77) |
219 (81–357) |
31 (12–51) |
120 (44–195) |
417 (153–680) |
||||||||||
|
Hospital admissions, cardiovascular |
135 (25–246) |
577 (108–1050) |
82 (15–149) |
331 (62–602) |
1124 (211–2047) |
||||||||||
|
Hospital admissions, respiratory |
245 (0–513) |
1050 (0–2204) |
147 (0–308) |
585 (0–1227) |
2027 (0–4252) |
||||||||||
|
Emergency department attendances, asthma |
113 (61–165) |
702 (379–1026) |
89 (48–131) |
401 (217–586) |
1305 (705–1908) |
||||||||||
|
|
|||||||||||||||
|
|
|||||||||||||||
Received 13 January 2020, accepted 18 February 2020
- 1. Bowman DMJS, Williamson G, Abatzoglou J, et al. Human exposure and sensitivity to globally extreme wildfire events. Nat Ecol Evol 2017; 1: 58.
- 2. Cornwall W. Scientists race to reveal how surging wildfire smoke is affecting climate and health. Science [online], 31 May 2018. https://www.sciencemag.org/news/2018/05/scientists-race-reveal-how-surging-wildfire-smoke-affecting-climate-and-health (viewed Jan 2020).
- 3. Black C, Tesfaigzi Y, Bassein JA, Miller LA. Wildfire smoke exposure and human health: significant gaps in research for a growing public health issue. Environ Toxicol Pharmacol 2017; 55: 186–195.
- 4. Héroux ME, Anderson HR, Atkinson R, et al. Quantifying the health impacts of ambient air pollutants: recommendations of a WHO/Europe project. Int J Public Health 2015; 60: 619–627.
- 5. NSW Department of Planning, Industry and Environment. Search for and download air quality data. https://www.dpie.nsw.gov.au/air-quality/search-for-and-download-air-quality-data (viewed Feb 2020).
- 6. Queensland Government. Download air data. https://apps.des.qld.gov.au/air-quality/download (viewed Feb 2020).
- 7. ACT Government. Open data portal dataACT. Air quality monitoring data. https://www.data.act.gov.au/Environment/Air-Quality-Monitoring-Data/94a5-zqnn/data (viewed Feb 2020).
- 8. Environmental Protection Authority Victoria. EPA AirWatch. https://www.epa.vic.gov.au/EPAAirWatch (viewed Feb 2020).
- 9. Xie X, Semanjski I, Gautama S, et al. A review of urban air pollution monitoring and exposure assessment methods. ISPRS Int J Geo‐Inf 2017; 6: 389.
- 10. Australian Bureau of Statistics. Deaths, year of occurrence, age at death, age‐specific death rates, sex, states, territories and Australia. http://stat.data.abs.gov.au/Index.aspx?DataSetCode=DEATHS_AGESPECIFIC_OCCURENCEYEAR (viewed Jan 2020).
- 11. Australian Bureau of Statistics. ERP by SA2 (ASGS 2016), age and sex, 2001 onwards. http://stat.data.abs.gov.au/Index.aspx?DataSetCode=ABS_ERP_ASGS2016 (viewed Jan 2020).
- 12. Australian Institute of Health and Welfare. Aboriginal and Torres Strait Islander health performance framework (Cat. no. IHW 194). Updated 5 Dec 2018. https://www.aihw.gov.au/reports/indigenous-health-welfare/health-performance-framework-new/contents/tier-1-health-status-outcomes (viewed Jan 2020).
- 13. Australian Institute of Health and Welfare. Emergency department care 2014–15: Australian hospital statistics (Health services series no. 65; Cat. no. HSE 168). Canberra: AIHW, 2015.
- 14. Australian Institute of Health and Welfare. Emergency department care 2015–16: Australian hospital statistics (Health services series no. 72; Cat. no. HSE 182). Canberra: AIHW, 2016.
- 15. Australian Institute of Health and Welfare. Emergency department care 2016–17: Australian hospital statistics (Health services series no. 80; Cat. no. HSE 194). Canberra: AIHW, 2017.
- 16. NSW Ministry of Health. Emergency department presentations for asthma like illness. http://www.healthstats.nsw.gov.au/Indicator/res_asted/res_asted?&topic=Asthma&topic1=topic_ast&code=res_ast (viewed Jan 2020).
- 17. World Health Organization. Health risks of air pollution in Europe: HRAPIE project. Recommendations for concentration–response functions for cost–benefit analysis of particulate matter, ozone and nitrogen dioxide. Copenhagen: WHO Regional Office for Europe, 2013. http://www.euro.who.int/__data/assets/pdf_file/0006/238956/Health_risks_air_pollution_HRAPIE_project.pdf?ua=1 (viewed Dec 2019).
- 18. Borchers‐Arriagada N, Horsley JA, Palmer AJ, et al. Association between fire smoke fine particulate matter and asthma‐related outcomes: systematic review and meta‐analysis. Environ Res 2019; 179: 108777.
- 19. Australian Department of Agriculture, Water and the Environment. National standards for criteria air pollutants in Australia. 2005. https://www.environment.gov.au/protection/publications/factsheet-national-standards-criteria-air-pollutants-australia (viewed Feb 2020).
- 20. Watts N, Amann M, Arnell N, et al. The 2019 report of The Lancet Countdown on health and climate change: ensuring that the health of a child born today is not defined by a changing climate. Lancet 2019; 394: 1836–1878.
Nicolas Borchers Arriagada is supported by a Tasmania Graduate Research Scholarship from the University of Tasmania, a top‐up scholarship from Asthma Australia, and a top‐up scholarship from the New South Wales Department of Planning, Industry and Environment through the New South Wales Bushfire Risk Management Research Hub.
No relevant disclosures.