


The known: Aboriginal and Torres Strait Islander (Indigenous) Australians admitted to intensive care are typically younger and have a heavier burden of chronic disease than non‐Indigenous patients, but in‐hospital mortality is similar for the two groups.
The new: In the largest study of long term outcomes for Indigenous Australians after intensive care in hospital, differences between long term survival for Indigenous and non‐Indigenous patients were largely explained by underlying differences in population survival patterns.
The implications: Rigorous follow‐up of Indigenous patients recovering from critical illness, particularly those who have discharged themselves from hospital, is essential.
The health‐related disadvantages experienced by Aboriginal and Torres Strait Islander Australians (Indigenous Australians) have been well described.1 Rates of chronic disease are higher among Indigenous Australians than other Australians,2,3,4 and they have greater difficulties accessing health care.5 Not only are Indigenous Australians more frequently admitted to intensive care units (ICUs),2 the mean age of Indigenous people admitted to intensive care is lower, their burdens of chronic metabolic, renal, and hepatic disease on admission greater than for non‐Indigenous ICU patients, and they are more frequently admitted as emergency cases following trauma, sepsis, or exacerbation of chronic disease.1,6,7,8
Nevertheless, short term outcomes, including hospital survival, are reported to be similar for Indigenous and non‐Indigenous patients admitted to intensive care.2 However, most studies have assessed outcomes only until discharge from hospital, and estimates of hospital survival may be inaccurate if patients from remote or regional areas are transferred from a central ICU to hospitals nearer home, as the ultimate outcome for these patients will be unknown.
The only data on outcomes after intensive care for Indigenous Australians beyond the index hospital admission were collected in a prospective cohort study of 25 patients (including 19 Indigenous patients) in Alice Springs Hospital.9
An episode of critical illness is often a pivotal change in the trajectory of a person's health.10 For example, early post‐discharge mortality was reported to be higher for people with diabetes admitted to intensive care, so that they lost a greater number of life‐years than patients without pre‐existing chronic disease.11
Given the generally poorer long term outcomes for ICU patients with chronic disease, the larger proportion of Indigenous ICU patients with chronic disease, and the sparsity of longitudinal data on Indigenous people discharged from intensive care, we conducted a data linkage cohort study to evaluate the admission and discharge patterns and long term outcomes for Indigenous Australians admitted non‐electively to ICUs in South Australia.
Methods
We undertook a data linkage study that included data from all university‐affiliated level 3 ICUs in South Australia. Tertiary referral intensive care services in South Australia (population, 1.7 million) are provided by four public hospitals, all in metropolitan Adelaide: Flinders Medical Centre, Lyell McEwin Hospital, Queen Elizabeth Hospital, and Royal Adelaide Hospital. The study was conducted in accordance with STROBE guidelines.12
Demographic, hospital episode, and intensive care admission data for patients were extracted for the period 1 January 2007 – 31 December 2016. The data, collected prospectively at each ICU, had been submitted to the Australian and New Zealand Intensive Care Society Adult Patient Database (ANZICS APD).13 The ANZICS APD captures clinical, physiological, and laboratory data for the initial 24 hours of ICU admissions, as well as admission, discharge, and hospital outcome data for all patients admitted to ICUs in Australia and New Zealand. APD data are collected by trained collectors who classify patients as Indigenous, non‐Indigenous, or of unknown Indigenous status according to information in the ICU admission summary and progress notes.
The APD data were linked with four population‐level datasets (Supporting Information, table 1):
- the Department for Health and Wellbeing (SA Health) Integrated South Australian Activity Collection (ISAAC): for Aboriginal or Torres Strait Islander status, mechanical ventilation data, known diabetes mellitus status, and International Classification of Diseases (ICD‐10) coding for each hospital episode;14
- the South Australian Registry of Births, Deaths and Marriages: for date of death;
- the Australian Bureau of Statistics (ABS) Socio‐Economic Indexes for Areas, Index of Relative Socio‐Economic Advantage and Disadvantage (IRSAD): for socio‐economic status;15 and
- ABS life tables for states, territories, and Australia16 and for Aboriginal and Torres Strait Islander Australians.17
ICU episodes were excluded from our analysis if they were non‐index admissions (that is, repeat ICU episodes within a single hospital admission), planned elective admissions, or the patients were less than 16 years of age (and consequently unable to provide consent for medical procedures in SA). For our analysis of long term outcomes, the first non‐elective hospital encounter was included. Coding for Aboriginal or Torres Strait Islander status in the ISAAC dataset follows the ABS metadata standard for defining Indigenous status;18 patients were deemed to be Indigenous if the Indigenous status field in either the APD or ISAAC datasets recorded this as their status.
Statistical analysis
Data are reported as frequencies and proportions (categorical variables), or as means with standard deviations (SDs) or medians with interquartile ranges (IQRs) (continuous variables). The significance of between group differences was assessed in χ2 tests (or Fisher exact tests when cell counts were 5 or less), Student t tests, or Wilcoxon rank sum tests as appropriate. Concordance of Indigenous status classification in the APD and ISAAC was expressed with the Krippendorff α coefficient.
The primary outcomes were in‐hospital mortality and mortality 12 months and 8 years after admission to intensive care. As death registry data were available only for South Australia, long term follow‐up was limited to patients with South Australian residential postcodes. Mortality was analysed by univariate and multiple variable logistic regression, with robust standard errors adjusted for clustering by ICU and effect estimates reported as odds ratios (ORs) with 95% confidence intervals (CIs). Covariate models were constructed by step‐forward regression, retaining covariates for which P < 0.1 in univariate analyses and P < 0.05 in the final model, as well as variables deemed clinically important, such as diabetes status.
Changes over time were assessed for non‐linearity, and study year was then entered as a continuous variable, together with an interaction term for Indigenous status. Survival is depicted in Kaplan–Meier curves; the significance of between‐group differences was assessed in log‐rank tests. Adjusted analyses used Cox proportional hazards models with ICU site as a shared frailty; the effect estimates are reported as hazard ratios (HRs) with 95% CIs.
Secondary outcomes included relative survival (at 1, 4, 8 years after discharge from hospital), potential years of life lost, lengths of ICU and hospital stays, mechanical ventilation, ICU and hospital discharge destinations, and numbers of hospital and ICU admissions. Relative survival, referenced to ABS life tables for the general and Indigenous South Australian populations, was used to estimate the residual effect of ICU admission on subsequent life expectancy for patients who survived to hospital discharge; cumulative relative survival was expressed as proportions with 95% CIs. Potential years of life lost were calculated using group‐specific ABS life tables, with an upper reference age of 75 years.
Missing data were not imputed, and the proportion of missing data reported only when it exceeded 10%. P‐values were not adjusted for multiple comparisons. All analyses were performed in Stata/MP 16.0.
Ethics approval
The study was approved by the Aboriginal Health Council of South Australia Research Ethics Committee (AHREC protocol 04‐17‐716) and the South Australia Department for Health and Ageing Human Research Ethics Committee (HREC/17/SAH/58).
Results
A total of 62 371 patient episodes were recorded for the four ICUs during 2007–2016, of which 39 784 were non‐elective index ICU admissions, including 2035 of patients who identified as Indigenous Australians (5.1%; 1837 in ISAAC, 1007 in the APD). Of these patients, 1461 (72%) had South Australian residential postcodes (Box 1; Supporting Information, table 2); most other Indigenous patients had home addresses in the Northern Territory (472, 23%) or New South Wales (65, 3.2%) (Supporting Information, table 3). The overall proportions of patients admitted to individual South Australian ICUs who identified as Indigenous Australians ranged between 3.3% and 6.8%. Concordance of Indigenous status classification in the APD and ISAAC datasets was weak (α = 0.55).
Baseline characteristics
The median age of Indigenous patients (45 years; IQR, 34–57 years) was lower than for non‐Indigenous ICU patients (64 years; IQR, 47–76 years). Larger proportions of Indigenous patients were admitted to intensive care following trauma (15% v 8.7%), were transferred from other hospitals (21% v 11%), or resided outside South Australia (28% v 4%), and their median IRSAD score was lower (907; IQR, 868–967 v 960; IQR, 913–1010). Severity of illness and risk of death, as indicated by median Acute Physiological and Chronic Health Evaluation (APACHE) II and IIIj scores, were similar for Indigenous and non‐Indigenous patients; chronic liver and renal diseases more frequent in Indigenous patients (Box 2).
Outcomes: hospital care
Median ICU and hospital lengths of stay and number of ICU admissions per hospital episode were similar for Indigenous and non‐Indigenous patients. A larger proportion of Indigenous patients were mechanically ventilated (55% v 48%). The proportions of Indigenous patients who died during intensive care (9.7% v 13%) or their index hospitalisation (14% v 19%) were smaller than those for non‐Indigenous patients, and a larger proportion were discharged from hospital to another acute health care facility (31% v 25%) (Box 3). After adjustment for age and disease factors, in‐hospital mortality was similar for Indigenous and non‐Indigenous patients (OR, 0.95; 95% CI, 0.81–1.10) (Box 4).
Outcomes for Indigenous patients: self v medical discharge
A larger proportion of Indigenous than non‐Indigenous patients discharged themselves from hospital after intensive care (5.9% v 1.6%) (Box 3). The median age of Indigenous patients who discharged themselves (40 years; IQR, 33–47 years) was lower than that of other Indigenous patients who survived to hospital discharge (45 years; IQR, 33–56 years), but their median APACHE II scores were similar (13; IQR, 9–19 v 15; IQR, 11–21). Self‐discharge was more frequent for Indigenous patients with SA postcodes than for those with interstate postcodes (7.5% v 1.9%) (Supporting Information, table 2). Multiple hospital admissions including intensive care were more frequent for patients who discharged themselves (Supporting Information, table 4). Mortality 12 months after admission to hospital for Indigenous patients who discharged themselves was similar to that for those who were medically discharged (OR, 0.75; 95% CI, 0.39–1.45; adjusted for age, APACHE II score, and APACHE IIIj diagnostic group: OR, 1.19; 95% CI, 0.51–2.82). Unadjusted mortality at 8 years was also similar (HR, 1.02; 95% CI, 0.71–1.47); after adjusting for the same three variables, however, it was higher for patients who had discharged themselves (HR, 1.46; 95% CI, 1.01–2.11) (Supporting Information, figure 1).
Outcomes: Indigenous v non‐Indigenous patients
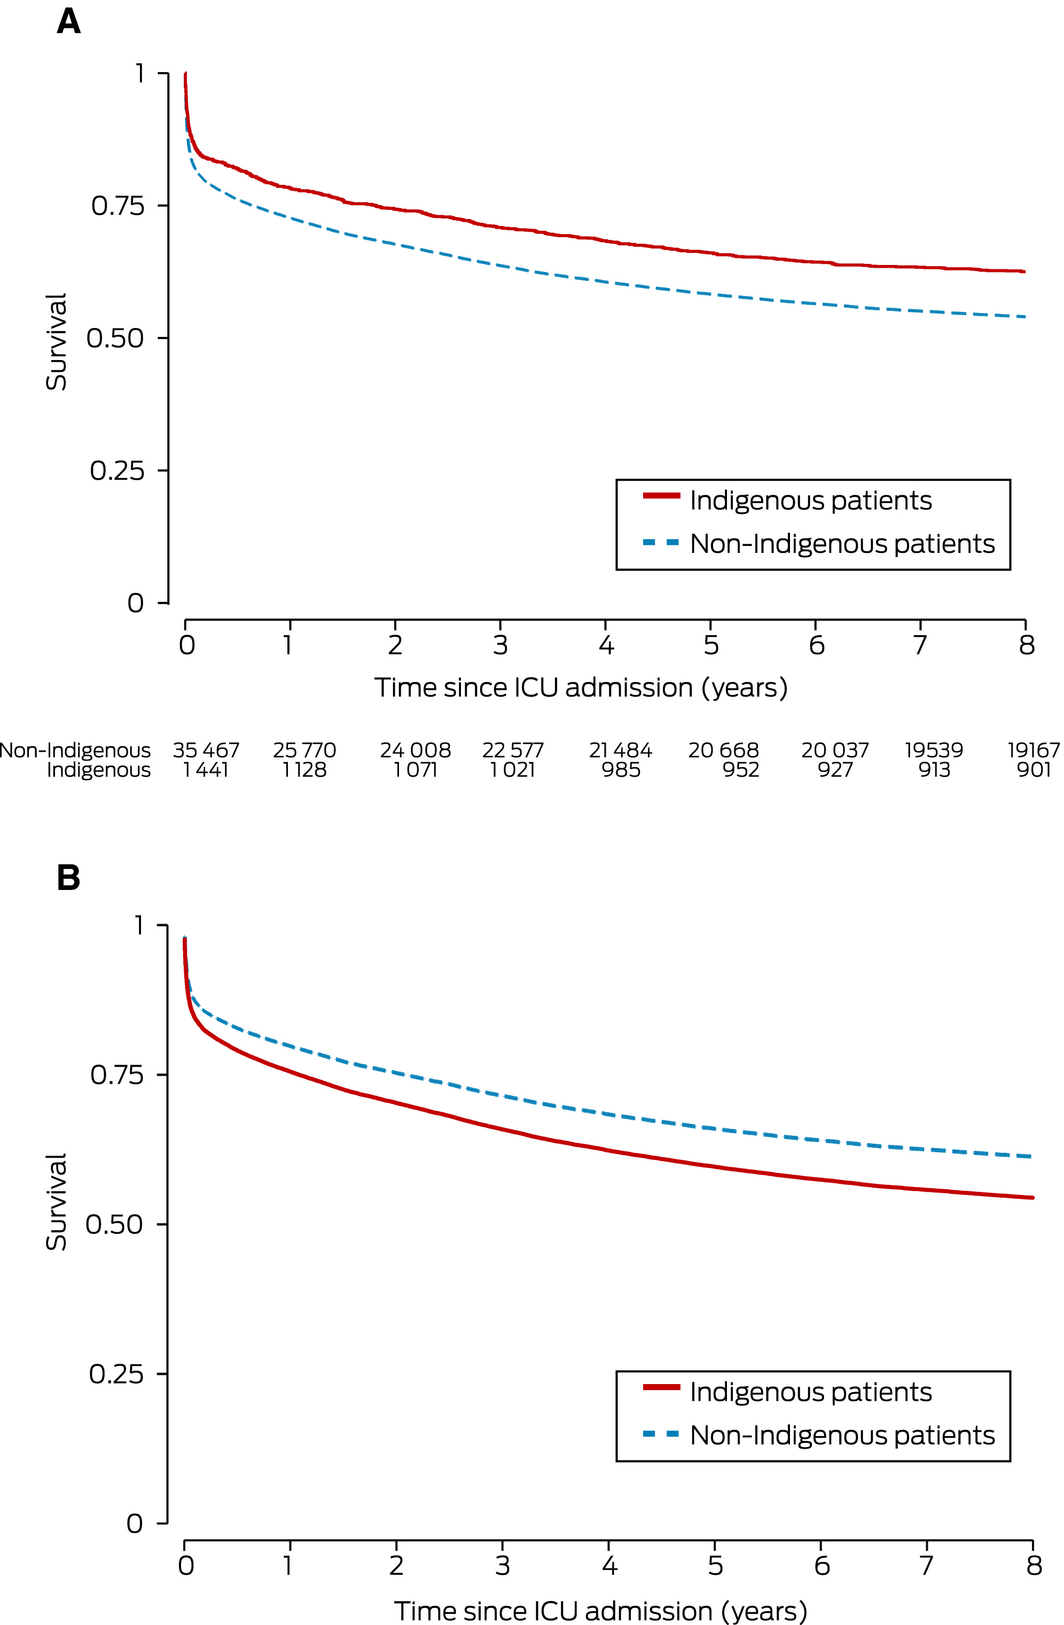
For patients with South Australian postcodes, unadjusted mortality at discharge, and at 12 months and 8 years after ICU admission was lower for Indigenous than non‐Indigenous patients. After adjusting for age, sex, diabetes, APACHE II score, and APACHE IIIj diagnostic group, however, mortality was similar for both groups at discharge, and greater for Indigenous patients at 12 months (adjusted OR, 1.14; 95% CI, 1.03–1.26) and 8 years after admission to intensive care (adjusted HR, 1.23; 95% CI, 1.13–1.35) (Box 4, Box 5).
The number of potential years of life lost was higher for Indigenous (median, 24.0 years; IQR, 15.8–31.8 years) than non‐Indigenous patients (median, 12.5 years; IQR, 0–22.3 years), consistent with the difference in median age of the two groups.
For patients who survived their index hospital admissions, relative survival (that is, compared with background population life expectancy) was similar for Indigenous and non‐Indigenous patients at 1, 4 and 8 years after discharge from hospital (Box 3; Supporting Information, figures 2 and 3).
Changes over time
The proportion of patients admitted to South Australian ICUs who identified as Indigenous Australians did not change significantly during the study period (2007, 4.2%; 2016, 5.8%; OR [per year], 1.04; 95% CI, 0.99–1.09) (Supporting Information, figure 4). There was no statistically significant interaction between Indigenous status and time with respect to in‐hospital mortality, which declined steadily for both Indigenous and non‐Indigenous patients during 2007–2016: for Indigenous patients, the marginal probability of death declined from 19% (95% CI, 17–21%) to 9.8% (95% CI, 7.6–12%), and for non‐Indigenous patients from 24% (95% CI, 21–27%) to 14% (95% CI, 13–15%) (Supporting Information, figure 5).
Discussion
Our major findings are that, after adjusting for major demographic and clinical factors, in‐hospital mortality was similar for Indigenous and non‐Indigenous intensive care patients, but mortality at 12 months and 8 years after admission was greater for Indigenous patients. Higher levels of chronic disease, remoteness, lower socio‐economic status, and difficult access to health care for Indigenous patients20,21 are probable contributors to higher long term mortality. Comparable studies have reported similar differences in age, chronic disease status, and intensive care admission diagnoses for critically ill Indigenous Australians,3,4,6,12 as well as a greater burden of chronic disease after episodes of critical illness.9
The higher proportion of Indigenous intensive care patients with peri‐partum admissions may similarly indicate that remoteness and chronic disease contribute to difficulties in accessing primary and subspecialist health care. The higher proportion of Indigenous intensive care patients who required mechanical ventilation may partly reflect the higher rate of inter‐hospital transfer and elective ventilation during transport.
Self‐discharge rates for Indigenous hospital patients are the highest in the world22 and may reflect unfavourable patient perceptions of the hospital environment, institutionalised racism, perceived differences in care,23,24 or communication problems. The median age of Indigenous patients who discharged themselves from hospital was lower than that of those medically discharged, their hospital re‐admission rate was higher, and their 8‐year mortality, after adjusting for age, disease severity, and diagnostic group, was greater. This subgroup of patients is at particular risk of higher mortality after a critical illness.
Our findings underline how pivotal an episode of critical illness can be for Indigenous people, and how health outcomes and mortality risk are affected beyond the end of their hospital admission. While in‐hospital mortality is similar for Indigenous and non‐Indigenous Australians, the difference in long term mortality shows the importance of community‐level health care after non‐elective admissions to intensive care.25 Rigorous follow‐up of Indigenous patients recovering from critical illness, particularly those who have discharged themselves from hospital, is essential.
Strengths and limitations
We have described the largest study of long term outcomes for critically ill Aboriginal or Torres Strait Islander patients. Classification of patients was rigorous, Indigenous status being ascertained and cross‐referenced in complementary datasets (the APD and ISAAC). In our study, fewer than 50% of Indigenous people were identified as such in the APD, and this shortcoming may have influenced findings that have relied on this dataset for identifying Indigenous patients.1,6 Linkage with ABS datasets allowed comparison of post‐hospital survival with underlying population life expectancy.
As with all retrospective data linkage studies, missing and inaccurate data may limit the robustness of our conclusions. However, the proportions of missing data were small, typically less than 5%, and several demographic fields were cross‐checked by linkage between the ICU and ISAAC datasets; fewer than 2% of ICU admissions were unmatched.
Death registry data were available only for South Australia, limiting long term follow‐up to patients with South Australian residential addresses. Not only did this reduce the analysis dataset size, but movement of South Australian patients interstate after discharge from hospital may have biased our 12‐month and 8‐year mortality estimates. The uncertainty of ABS life tables with respect to Indigenous people has been documented;26 these tables were nonetheless the best available data sources for our analysis.
Conclusion
After adjusting for age and disease‐related factors, hospital outcomes for Indigenous and non‐Indigenous patients admitted to intensive care were similar, and hospital mortality rates declined for both groups during the study period. Estimated mortality at 12 months and 8 years after admission to hospital, adjusted for demographic and clinical factors, was higher for Indigenous patients, but the differences appear to parallel overall population survival patterns. Accordingly, the factors underlying the general gap in life expectancy between Indigenous and non‐Indigenous Australians are more important than the impact of the ICU admission itself for determining long term outcomes for Indigenous patients.
Box 1 – Selection of patients for analysis of non‐elective, index intensive care unit (ICU) episodes
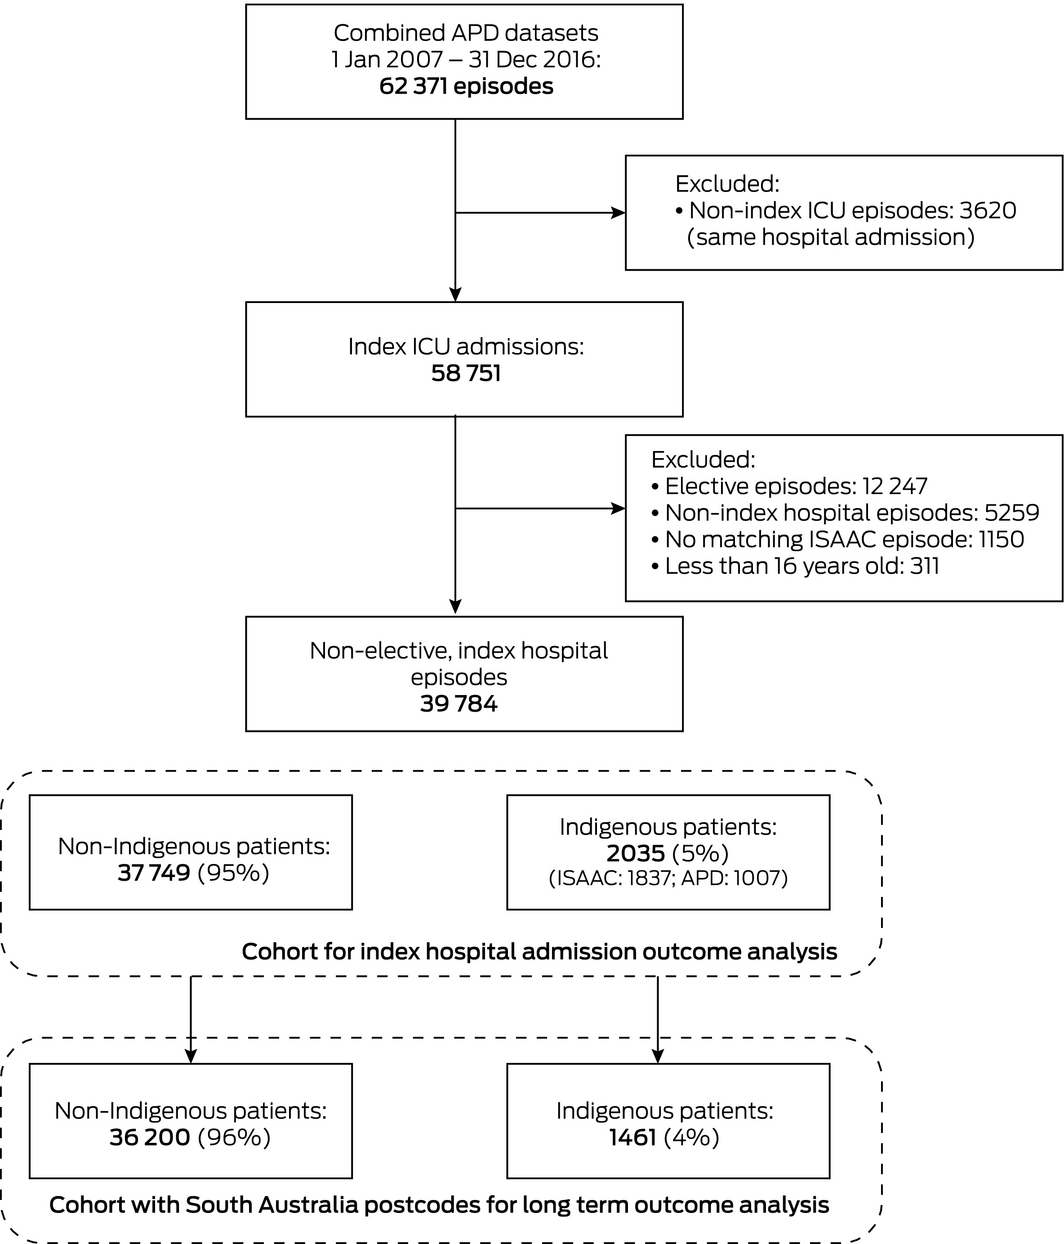
APD = Adult Patient Database (Australian and New Zealand Intensive Care Society); ISAAC = Integrated South Australian Activity Collection (SA Health).
Box 2 – Baseline demographic characteristics of 39 784 patients admitted to intensive care units (ICUs) in South Australia, 2007–2016, by Indigenous status
|
Characteristic |
Non‐Indigenous |
Indigenous |
|||||||||||||
|
|
|||||||||||||||
|
Number of patients |
37 749 |
2035 |
|||||||||||||
|
Age, median (IQR) |
64 (47–76) |
45 (34–57) |
|||||||||||||
|
Sex (men) |
21 696 (58%) |
1098 (54%) |
|||||||||||||
|
South Australian postcode |
36 200 (96%) |
1461 (72%) |
|||||||||||||
|
APACHE II score, median (IQR) |
18 (13–24) |
17 (11–23) |
|||||||||||||
|
Without age component |
14 (10–20) |
15 (10–21) |
|||||||||||||
|
APACHE IIIj risk of death score |
|
|
|||||||||||||
|
Median (IQR) |
0.14 (0.04–0.39) |
0.10 (0.02–0.33) |
|||||||||||||
|
Mean (SD) |
0.25 (0.27) |
0.22 (0.26) |
|||||||||||||
|
IRSAD, median (IQR)* |
960 (913–1010) |
907 (868–967) |
|||||||||||||
|
Diabetes |
7606 (20%) |
657 (32%) |
|||||||||||||
|
Pregnant or post partum |
442 (1.2%) |
56 (2.8%) |
|||||||||||||
|
Chronic health flags (APACHE II/IIIj) |
|||||||||||||||
|
Immunosuppressed (disease) |
333 (0.9%) |
15 (0.7%) |
|||||||||||||
|
Immunosuppressed (drugs) |
2013 (5.3%) |
60 (2.9%) |
|||||||||||||
|
HIV/AIDS |
60 (0.2%) |
5 (0.2%) |
|||||||||||||
|
Chronic liver disease |
994 (2.6%) |
127 (6.2%) |
|||||||||||||
|
Acute hepatic failure |
167 (0.4%) |
15 (0.7%) |
|||||||||||||
|
Metastatic cancer |
960 (2.5%) |
20 (1.0%) |
|||||||||||||
|
Haematological malignancy |
485 (1.3%) |
12 (0.6%) |
|||||||||||||
|
Lymphoma |
405 (1.1%) |
6 (0.3%) |
|||||||||||||
|
Respiratory |
2749 (7.3%) |
96 (4.7%) |
|||||||||||||
|
Cardiac |
3026 (8.0%) |
122 (6.0%) |
|||||||||||||
|
Renal |
1109 (2.9%) |
172 (8.5%) |
|||||||||||||
|
ICU admission: source |
|
|
|||||||||||||
|
Accident and emergency |
17 116 (45%) |
852 (42%) |
|||||||||||||
|
Operating theatre |
8208 (22%) |
413 (20%) |
|||||||||||||
|
General ward |
7593 (20%) |
302 (15%) |
|||||||||||||
|
Other ICU (any hospital) |
177 (0.5%) |
18 (0.9%) |
|||||||||||||
|
Other hospital |
4295 (11%) |
431 (21%) |
|||||||||||||
|
Other |
354 (0.9%) |
19 (0.9%) |
|||||||||||||
|
ICU admission: diagnostic group |
|
|
|||||||||||||
|
Post‐operative |
9123 (24%) |
460 (23%) |
|||||||||||||
|
Cardiothoracic surgery |
801 (2.1%) |
77 (3.8%) |
|||||||||||||
|
Trauma |
3270 (8.7%) |
296 (15%) |
|||||||||||||
|
Sepsis |
3522 (9.3%) |
224 (11%) |
|||||||||||||
|
Post‐arrest |
2613 (6.9%) |
127 (6.2%) |
|||||||||||||
|
|
|||||||||||||||
|
APACHE = Acute Physiology and Chronic Health Evaluation; HIV/AIDS = human immunodeficiency virus infection/acquired immunodeficiency syndrome; IQR = interquartile range; IRSAD = Index of Relative Socio‐economic Advantage and Disadvantage; SD = standard deviation. * Lower score indicates greater disadvantage. In 2016, the lowest IRSAD decile comprised (approximately) the scores 400–871, the second decile 872–918, the third decile 919–953, the fourth 954–982, and the fifth decile 983–1008.19 |
|||||||||||||||
Box 3 – Patient processes of care and outcomes for 39 784 patients admitted to intensive care units (ICUs) in South Australia, 2007–2016, by Indigenous status
|
Characteristic |
Non‐Indigenous |
Indigenous |
P |
||||||||||||
|
|
|||||||||||||||
|
Number of patients |
37 749 |
2035 |
|
||||||||||||
|
Hospital (with ICU) admissions |
|
|
0.66 |
||||||||||||
|
1 |
33 245 (88%) |
1785 (88%) |
|
||||||||||||
|
2 |
3414 (9.0%) |
191 (9.4%) |
|
||||||||||||
|
3 |
696 (1.8%) |
42 (2.1%) |
|
||||||||||||
|
4 or more |
394 (1.0%) |
17 (0.8%) |
|
||||||||||||
|
ICU admissions in index hospital episode |
|
|
0.53 |
||||||||||||
|
1 |
35 699 (95%) |
1929 (95%) |
|
||||||||||||
|
2 |
1822 (4.8%) |
92 (4.5%) |
|
||||||||||||
|
3 |
191 (0.5%) |
10 (0.5%) |
|
||||||||||||
|
4 or more |
37 (0.1%) |
4 (0.2%) |
|
||||||||||||
|
Length of stay (days), median (IQR) |
|
|
|
||||||||||||
|
ICU |
2.2 (1.1–4.8) |
2.4 (1.0–5.3) |
0.09 |
||||||||||||
|
Hospital |
9.9 (4.8–19.9) |
10.0 (4.8–21.0) |
0.50 |
||||||||||||
|
Mechanical ventilation required |
18 027 (48%) |
1113 (55%) |
< 0.001 |
||||||||||||
|
ICU discharge destination |
|
|
< 0.001 |
||||||||||||
|
Died |
4867 (13%) |
198 (9.7%) |
|
||||||||||||
|
Home |
991 (2.6%) |
73 (3.6%) |
|
||||||||||||
|
Ward |
30 687 (81%) |
1706 (84%) |
|
||||||||||||
|
Other ICU (any hospital) |
627 (1.7%) |
28 (1.4%) |
|
||||||||||||
|
Other hospital |
556 (1.5%) |
29 (1.4%) |
|
||||||||||||
|
Other/unknown |
21 (0.06%) |
1 (0.05%) |
|
||||||||||||
|
Hospital separation type |
|
|
< 0.001 |
||||||||||||
|
Died |
7001 (19%) |
275 (14%) |
|
||||||||||||
|
Home |
19 145 (51%) |
973 (48%) |
|
||||||||||||
|
Other acute care |
9255 (25%) |
626 (31%) |
|
||||||||||||
|
Residential aged care |
568 (1.5%) |
11 (0.5%) |
|
||||||||||||
|
Self‐discharge |
608 (1.6%) |
120 (5.9%) |
|
||||||||||||
|
Other |
1172 (3.1%) |
30 (1.5%) |
|
||||||||||||
|
Deaths |
|
|
|
||||||||||||
|
ICU |
4867 (13%) |
198 (9.7%) |
< 0.001 |
||||||||||||
|
Hospital |
7001 (19%) |
275 (14%) |
< 0.001 |
||||||||||||
|
At 12 months (SA postcode only) |
10 430 (29%) |
333 (23%) |
< 0.001 |
||||||||||||
|
Potential years of life lost* |
|
|
|
||||||||||||
|
Median (IQR) |
12.5 (0–22.3) |
24.0 (15.8–31.8) |
< 0.001 |
||||||||||||
|
Mean (SD) |
13.3 (14.4) |
24.0 (12.8) |
< 0.001 |
||||||||||||
|
Relative survival, proportion (95% CI)† |
|
|
|
||||||||||||
|
At 1 year |
0.89 (0.89–0.90) |
0.90 (0.89–0.92) |
|
||||||||||||
|
At 4 years |
0.79 (0.78–0.80) |
0.81 (0.79–0.84) |
|
||||||||||||
|
At 8 years |
0.77 (0.76–0.78) |
0.78 (0.75–0.80) |
|
||||||||||||
|
|
|||||||||||||||
|
IQR = interquartile range; SD = standard deviation. * Upper reference age: 75 years. † Based on patients surviving to hospital discharge. |
|||||||||||||||
Box 4 – Mortality at hospital discharge, and at 12 months and 8 years after admission to intensive care units (ICUs) in South Australia, 2007–2016: univariate and adjusted analyses, Indigenous v non‐Indigenous patients with South Australian postcodes
|
Variable |
Effect estimate (95% CI) |
P |
|||||||||||||
|
|
|||||||||||||||
|
Hospital mortality: logistic regression |
|||||||||||||||
|
Univariate odds ratio* |
0.69 (0.59–0.80) |
< 0.001 |
|||||||||||||
|
Adjusted odds ratio† |
0.95 (0.81–1.10) |
0.47 |
|||||||||||||
|
12‐month mortality (SA postcodes only): logistic regression |
|||||||||||||||
|
Univariate odds ratio* |
0.73 (0.60–0.88) |
0.001 |
|||||||||||||
|
Adjusted odds ratio† |
1.14 (1.03–1.26) |
0.011 |
|||||||||||||
|
8‐year mortality (SA postcodes only): Cox proportional hazards model |
|||||||||||||||
|
Univariate hazard ratio |
0.78 (0.72–0.85) |
< 0.001 |
|||||||||||||
|
Adjusted hazard ratio†,‡ |
1.23 (1.13–1.35) |
< 0.001 |
|||||||||||||
|
|
|||||||||||||||
|
CI = confidence interval. * Standard errors adjusted for clustering by ICU. † Adjusted for age, sex, diabetes mellitus, severity of illness (APACHE II score, without age component), and admission diagnostic group (APACHE IIIj); standard errors adjusted for clustering by ICU. ‡ Adjusted models with ICU as shared frailty. |
|||||||||||||||
Received 10 October 2019, accepted 10 February 2020
- William G Mitchell1
- Adam Deane2
- Alex Brown3,4
- Shailesh Bihari5,6
- Hao Wong4,7
- Rajaram Ramadoss8
- Mark Finnis4,9
- 1 Harvard University, Boston, MA, United States of America
- 2 University of Melbourne, Melbourne, VIC
- 3 South Australian Health and Medical Research Institute, Adelaide, SA
- 4 University of Adelaide, Adelaide, SA
- 5 Flinders Medical Centre, Adelaide, SA
- 6 College of Medicine and Public Health, Flinders University, Adelaide, SA
- 7 Queen Elizabeth Hospital, Adelaide, SA
- 8 Lyell McEwin Hospital, Adelaide, SA
- 9 Royal Adelaide Hospital, Adelaide, SA
No relevant disclosures.
- 1. Trout MI, Henson G, Senthuran S. Characteristics and outcomes of critically ill Aboriginal and/or Torres Strait Islander patients in North Queensland. Anaesth. Intensive Care 2015; 43: 216–223.
- 2. Stephens D. Critical illness and its impact on the Aboriginal people of the Top End of the Northern Territory, Australia. Anaesth. Intensive Care 2003; 31: 294–299.
- 3. McDonald SP, Russ GR. Burden of end‐stage renal disease among Indigenous people in Australia and New Zealand. Kidney Int Suppl 2003; S123–S127.
- 4. Zhao Y, Connors C, Wright J, et al. Estimating chronic disease prevalence among the remote Aboriginal population of the Northern Territory. Aust N Z J Public Health 2008; 32: 307–313.
- 5. Australian Institute of Health and Welfare. Indigenous Australians: overview. Updated Jan 2020. https://www.aihw.gov.au/reports-data/population-groups/indigenous-australians/overview (viewed Jan 2020).
- 6. Ho KM, Finn J, Dobb GJ, Webb SAR. The outcome of critically ill Indigenous patients. Med J Aust 2006; 184: 496–499. https://www.mja.com.au/journal/2006/184/10/outcome-critically-ill-indigenous-patients.
- 7. Davis JS, Cheng AC, McMillan M, et al. Sepsis in the tropical Top End of Australia's Northern Territory: disease burden and impact on Indigenous Australians. Med J Aust 2011; 194: 519–524. https://www.mja.com.au/journal/2011/194/10/sepsis-tropical-top-end-australias-northern-territory-disease-burden-and-impact.
- 8. Magee F, Wilson A, Bailey MJ, et al. Trauma‐related admissions to intensive care units in Australia: the influence of Indigenous status on outcomes. Med J Aust 2019; 210: 493–498. https://www.mja.com.au/journal/2019/210/11/trauma-related-admissions-intensive-care-units-australia-influence-indigenous.
- 9. Secombe PJ, Stewart P. Long‐term morbidity and mortality in survivors of critical illness: a 5‐year observational follow‐up study. Rural Remote Health 2017; 17: 3908.
- 10. Darvall JN, Boonstra T, Normal J, et al. Persistent critical illness: baseline characteristics, intensive care course, and cause of death. Crit Care Resusc 2019; 21: 110–118.
- 11. Ali Abdelhamid Y, Plummer MP, Finnis ME, et al. Long‐term mortality of critically ill patients with diabetes who survive admission to the intensive care unit. Crit Care Resusc 2017; 19: 303–309.
- 12. von Elm E, Altman DG, Egger M, et al. The Strengthening the Reporting of Observational Studies in Epidemiology (STROBE) statement: guidelines for reporting observational studies. PLoS Med 2007; 4: e296.
- 13. Stow PJ, Hart GK, Higlett T; ANZICS Database Management Committee. Development and implementation of a high‐quality clinical database: the Australian and New Zealand Intensive Care Society Adult Patient Database. J Crit. Care 2006; 21: 133–141.
- 14. SA Health. Integrated South Australian Activity Collection (ISAAC). Updated Dec 2019. https://www.sahealth.sa.gov.au/wps/wcm/connect/public+content/sa+health+internet/about+us/our+performance/our+data+collections/admitted+patient+care (viewed Jan 2020).
- 15. Australian Bureau of Statistics. Socio‐Economic Indexes For Areas (SEIFA). Updated Mar 2018. https://www.abs.gov.au/websitedbs/censushome.nsf/home/seifa (viewed Jan 2019).
- 16. Australian Bureau of Statistics. 3302.0.55.001. Life tables, states, territories, Australia, 2016–2018. Updated Oct 2019. https://www.abs.gov.au/AUSSTATS/abs@.nsf/Lookup/3302.0.55.001Main+Features12016-2018?OpenDocument (viewed Jan 2020).
- 17. Australian Bureau of Statistics. 3302.0.55.003. Life tables for Aboriginal and Torres Strait Islander Australians, 2015–2017. Updated Nov 2018. https://www.abs.gov.au/AUSSTATS/abs@.nsf/Lookup/3302.0.55.003Main+Features12015-2017?OpenDocument (viewed Jan 2019).
- 18. SA Health. ISAAC reference manual: South Australian Admitted Patient Activity Data standards, version 11. Updated July 2016. https://www.santdatalink.org.au/files/PDF_Files/2016_ISAAC_Reference_Manual_v11.pdf (viewed Jan 2019).
- 19. Australian Bureau of Statistics. 2033.0.55.001. Census of population and housing: Socio‐Economic Indexes for Areas (SEIFA), Australia, 2016. Mar 2018. https://www.abs.gov.au/AUSSTATS/abs@.nsf/DetailsPage/2033.0.55.0012016?OpenDocument (viewed Jan 2019).
- 20. Hyde Z, Smith K, Flicker L. Mortality in a cohort of remote‐living Aboriginal Australians and associated factors. PLoS One 2018; 13: s0195030.
- 21. Ho KM, Dobb GJ, Knuiman M, et al. The effect of socioeconomic status on outcomes for seriously ill patients: a linked data cohort study. Med J Aust 2008; 189: 36–30. https://www.mja.com.au/journal/2008/189/1/effect-socioeconomic-status-outcomes-seriously-ill-patients-linked-data-cohort.
- 22. Einsiedel L, van Iersel E, Macnamara R, et al. Self‐discharge by Aboriginal patients at Alice Springs Hospital, Central Australia: insights from a prospective cohort study. Aust Health Rev 2013; 37: 239–245.
- 23. Durey A, Thompson AS, Wood M. Time to bring down the twin towers in poor Aboriginal hospital care: addressing institutional racism and misunderstandings in communication. Intern Med J 2012; 41: 17–22.
- 24. Henry BR, Houston S, Mooney GH. Institutional racism in Australian healthcare: a plea for decency. Med J Aust 2004; 180: 517–520. https://www.mja.com.au/journal/2004/180/10/institutional-racism-australian-healthcare-plea-decency.
- 25. Zhao Y, Thomas SL, Guthridge SL, Wakerman J. Better health outcomes at lower costs: the benefits of primary care utilisation for chronic disease management in remote Indigenous communities in Australia's Northern Territory. BMC Health Serv Res 2014; 14: 463.
- 26. Australian Bureau of Statistics. 3302.0.55.003. Life tables for Aboriginal and Torres Strait Islander Australians, 2015–2017. Updated Nov 2018. https://www.abs.gov.au/ausstats/abs@.nsf/Lookup/by%20Subject/3302.0.55.003~2015-2017~Main%20Features~Frequently%20asked%20questions~14 (viewed Mar 2019).
Abstract
Objectives: To assess long term outcomes for Aboriginal and Torres Strait Islander (Indigenous) Australians admitted non‐electively to intensive care units (ICUs).
Design: Data linkage cohort study; analysis of ICU patient data (Australian and New Zealand Intensive Care Society Adult Patient Database), prospectively collected during 2007–2016.
Setting: All four university‐affiliated level 3 ICUs in South Australia.
Main outcomes: Mortality (in‐hospital, and 12 months and 8 years after admission to ICU), by Indigenous status.
Results: 2035 of 39 784 non‐elective index ICU admissions (5.1%) were of Indigenous Australians, including 1461 of 37 661 patients with South Australian residential postcodes. The median age of Indigenous patients (45 years; IQR, 34–57 years) was lower than for non‐Indigenous ICU patients (64 years; IQR, 47–76 years). For patients with South Australian postcodes, unadjusted mortality at discharge and 12 months and 8 years after admission was lower for Indigenous patients; after adjusting for age, sex, diabetes, severity of illness, and diagnostic group, mortality was similar for both groups at discharge (adjusted odds ratio [aOR], 0.95; 95% CI, 0.81–1.10), but greater for Indigenous patients at 12 months (aOR, 1.14; 95% CI, 1.03–1.26) and 8 years (adjusted hazard ratio, 1.23; 95% CI, 1.13–1.35). The number of potential years of life lost was greater for Indigenous patients (median, 24.0; IQR, 15.8–31.8 v 12.5; IQR, 0–22.3), but, referenced to respective population life expectancies, relative survival at 8 years was similar (proportions: Indigenous, 0.78; 95% CI, 0.75–0.80; non‐Indigenous, 0.77; 95% CI, 0.76–0.78).
Conclusions: Adjusted long term mortality and median number of potential life years lost are higher for Indigenous than non‐Indigenous patients after intensive care in hospital. These differences reflect underlying population survival patterns rather than the effects of ICU admission.