


Intensive care unit (ICU) care is expensive.1 We estimated the financial costs, from an operational perspective, of providing care to patients admitted to Australian ICUs and how they vary according to bed number, unit occupancy, and ICU type (tertiary, metropolitan, and rural/regional public hospitals, and private hospitals).
The Australian and New Zealand Intensive Care Society (ANZICS) Centre for Outcomes and Resources Evaluation (CORE) Critical Care Resources (CCR) registry collects information and each financial year reports aggregate data on ICU activities and resources, a declared quality assurance activity under the federal Health Insurance (Quality Assurance Confidentiality) Amendment Act 1992. The annual survey for collecting these data is completed by ICU heads of department or their nominated representatives.2 We analysed data for Australian ICUs from the 2013/14 CCR survey, which included questions (additional to those in the regular survey) on the major components of expenditure (cost blocks).3 Participating ICUs reported annual costs for selected budget items and total ICU expenditure (Supporting Information, table 1); capital expenditure, organisational overhead costs, and equipment costs were not included.3 The cost per patient bed‐day, the annual cost per ICU bed, and total annual costs were calculated (further details: Supporting Information). The study was approved by the Alfred Health Human Research Ethics Committee (reference, 449/19).
The survey was forwarded to 181 Australian ICUs in October 2014. Complete costing data were received from 36 ICUs in 36 hospitals, accounting for 500 ICU beds (about 25% of ICU beds in Australia).4 The characteristics of contributing and non‐responding ICUs were similar (Supporting Information, tables 2 and 3).
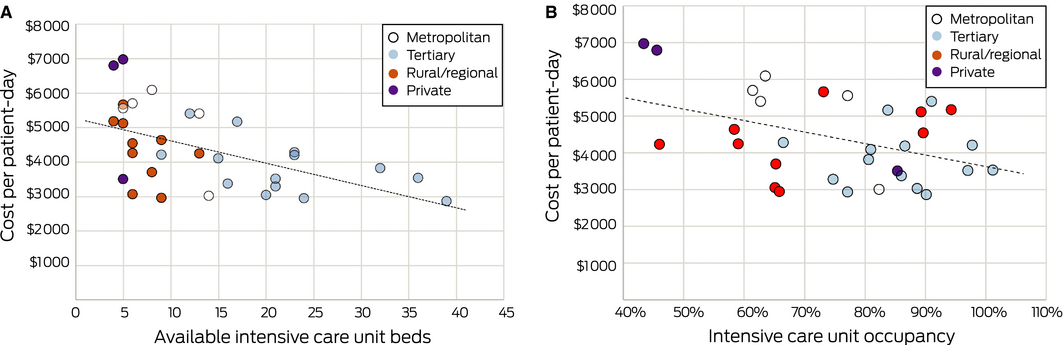
The mean cost per patient bed‐day for all contributing ICUs was $4375 (standard deviation, $1157; 2019 consumer price index equivalent, $4875), the median cost was $4221 (interquartile range, $3436–$5286) (Box 1). Higher ICU bed number (R2 = 0.23; P = 0.004) and occupancy (R2 = 0.28; P = 0.002) were each significantly associated with lower costs per patient bed‐day (Box 2); bed number did not influence annual cost per bed (Supporting Information, figure 1).
The estimated total annual operational cost for ICU care in Australia was $2119 million, about 0.15% of gross domestic product (GDP) and 1.4% of total health care costs (Supporting Information, tables 4 and 5). Staffing accounted for about 80% of ICU operational costs (Supporting Information, table 6). Larger ICUs were associated with lower costs for medical staff (P = 0.023) but not for nursing staff (P = 0.05) (Supporting Information, figures 2 and 3).
Our estimated mean cost per ICU patient bed‐day is similar to the mean total cost of acute hospital separations in Australia during 2013/14 (about $5000).5 ICU per patient‐day costs have been reported to be lower in France and Germany, similar in the United Kingdom, and higher in the United States (Supporting Information, table 7). In the United States, critical care accounts for 4.1% of all private and government health expenditure and 0.66% of GDP,6 a difference that may be attributable to the difference in ICU bed numbers (Australia, 8.1 per 100 000 population;2 United States, 20 per 100 000 population7).
We analysed self‐reported ICU operational costs for 36 of 181 Australian ICUs. Costs related to specific diseases, treatments, and lengths of ICU stay could not be investigated. We included six ICUs in which fewer than 20% of patients required artificial ventilation and a high proportion of tertiary ICUs, which have somewhat lower per patient‐day costs. This may explain why our estimate was slightly lower than the 2019 Independent Hospital Pricing Authority estimate, based on patient‐level data, of $210 per bed‐hour, or $5040 per ICU bed‐day.8 As ICU costs declined with size and occupancy, increasing ICU size may have improved health care system efficiency.
Box 1 – Intensive care unit (ICU) costs (in Australian dollars), as reported to the Critical Care Resources (CCR) survey for the financial year 2013/14, by hospital type
|
ICU costs |
Total for ICU category |
Mean (standard deviation) |
Median (interquartile range) |
P * |
|||||||||||
|
|
|||||||||||||||
|
Costs per patient‐day† |
|
|
|
0.05 |
|||||||||||
|
All ICUs (N = 32) |
— |
4375 (1157) |
4221 (3436–5286) |
|
|||||||||||
|
Tertiary (N = 14) |
53 679 |
3834 (777) |
3677 (3279–4206) |
|
|||||||||||
|
Metropolitan (N = 5) |
25 747 |
5149 (1221) |
5554 (5404–5693) |
|
|||||||||||
|
Rural/regional (N = 10) |
43 318 |
4331 (893) |
4395 (3696–5114) |
|
|||||||||||
|
Private (N = 3) |
17 265 |
5755 (1954) |
6792 (3501–6972) |
|
|||||||||||
|
Annual cost per ICU bed |
|
|
|
0.29 |
|||||||||||
|
All ICUs (N = 36) |
— |
1 121 282 (361 277) |
1 114 557 (900 455–1 368 277) |
|
|||||||||||
|
Tertiary (N = 15) |
17 976 794 |
922 995 (372 650) |
1 145 595 (981 908–1 325 552) |
|
|||||||||||
|
Metropolitan (N = 5) |
6 395 359 |
1 198 453 (269 569) |
1 276 226 (1 237 993–1 411 002) |
|
|||||||||||
|
Rural/regional (N = 12) |
12 302 014 |
1 279 072 (244 759) |
898 712 (710 564–1 499 988) |
|
|||||||||||
|
Private (N = 4) |
3 691 980 |
1 025 168 (468 336) |
1 098 207 (728 231–1 117 760) |
|
|||||||||||
|
Total annual costs per ICU |
|
|
|
< 0.001 |
|||||||||||
|
All ICUs (N = 36) |
548 110 317 |
15 225 287 (11 260 910) |
10 270 060 (6 715 261–20 686 033) |
|
|||||||||||
|
Tertiary (N = 15) |
391 053 462 |
26 070 231 (9 335 511) |
23 912 556 (18 794 430–35 513 473) |
|
|||||||||||
|
Metropolitan (N = 5) |
55 543 440 |
11 108 688 (3 538 508) |
11 288 017 (7 821 000–12 683 143) |
|
|||||||||||
|
Rural/regional (N = 12) |
80 538 967 |
6 711 581 (2 134 632) |
7 086 844 (5 200 420–8 618 090) |
|
|||||||||||
|
Private (N = 4) |
20 974 448 |
5 243 612 (480 521) |
5 463 930 (4 991 789–5 495 435) |
|
|||||||||||
|
|
|||||||||||||||
|
Mann–Whitney test for differences in median costs across the four hospital types. Four sites were excluded from this analysis because of incomplete information on total number of hours of ICU care delivered. |
|||||||||||||||
Received 24 May 2019, accepted 16 July 2019
- 1. Thompson K, Taylor C, Forde K, Hammond N. The evolution of Australian intensive care and its related costs: a narrative review. Aust Crit Care 2018; 31: 325–330.
- 2. Australian and New Zealand Intensive Care Society, Centre for Outcome and Resource Evaluation. Intensive care resources and activity annual report 2013/14. Melbourne: ANZICS CORE, 2015. https://www.anzics.com.au/wp-content/uploads/2018/09/2013-14-CCR-Activity-Report.pdf (viewed Apr 2019).
- 3. Edbrooke D, Hibbert C, Ridley S, et al. the Intensive Care Working Group on Costing. The development of a method for comparative costing of individual intensive care units. Anaesthesia 1999; 54: 110–120.
- 4. Australian and New Zealand Intensive Care Society Centre for Outcome and Resources Evaluation. Annual report 2013/14. Melbourne: ANZICS, 2014. https://www.anzics.com.au/wp-content/uploads/2018/08/ANZICS-CORE-Annual-Report-2013-14.pdf (viewed Apr 2019).
- 5. Independent Hospital Pricing Authority. National Hospital Cost Data Collection, public hospitals cost report, round 18 (financial year 2013–14). 11 Feb 2016. https://www.ihpa.gov.au/publications/australian-public-hospitals-cost-report-2013-2014-round-18 (viewed Apr 2019).
- 6. Halpern NA, Pastores SM. Critical care medicine in the United States 2000–2005: an analysis of bed numbers, occupancy rates, payer mix, and costs. Crit Care Med 2010; 38: 65–71.
- 7. Wunsch H, Angus DC, Harrison DA, et al. Variation in critical care services across North America and Western Europe. Crit Care Med 2008; 36: 2787–2793, e1–e9.
- 8. Independent Hospital Pricing Authority. National pricing model: technical specifications 2019–20. 5 Mar 2019. https://www.ihpa.gov.au/sites/default/files/publications/national_pricing_model_technical_specifications_2019-20.pdf (viewed Apr 2019).
We dedicate this work to the late Peter Hicks, a leader, friend, and extraordinary individual. We acknowledge the staff and patients of all intensive care units that contributed to the ANZICS CORE Critical Care Resources Registry. Edward Litton is supported by a National Health and Medical Research Council Early Career Fellowship (APP1164160).
No relevant disclosures.