


Diabetes is emerging as one of the greatest health care challenges of the 21st century. In 2014, more than 1.2 million Australians had been diagnosed with diabetes,1 and the number was expected to double during the following decade.2 Diabetes increases the likelihood of needing hospital care;3 25–30% of inpatients have diabetes,4 and a further 5–10% have undiagnosed diabetes.5,6 The direct and indirect costs of diabetes in Australian adults were nearly $11 billion in 2005;7 inpatient care is a major contributor to the overall costs of diabetes in the United States.8
Although the importance of long term glycaemic control is recognised, that of acute glycaemic control during a hospital stay is often underappreciated. Acute hyperglycaemia in hospital is linked with hospital‐acquired infections because of the associated neutrophil and macrophage dysfunction, as well as with cardiovascular and renal disease secondary to pro‐thrombotic changes, osmotic diuresis, and endothelial dysfunction.9,10 Similarly, acute hypoglycaemia in hospital can lead to neuroglycopenia, causing seizures, falls, and neurological injury, as well as cardiac ischaemia and arrhythmia.11 Adverse glycaemia is a term used to describe both hyperglycaemia and hypoglycaemia; both are associated with pathophysiology and adverse clinical outcomes,12 and optimising glycaemic control in hospital patients is essential.13 Glucometric reporting and benchmarking standards for optimal diabetes care, however, have not been standardised in Australian hospitals.
The National Safety and Quality Health Service (NSQHS) has published standards for Australian hospitals for reporting and benchmarking important adverse outcomes in hospital, including staphylococcal blood stream infections, falls, and pressure injuries.14 A key recommendation in the Australian National Diabetes Strategy 2016–202015 was that the NSQHS standards be expanded to encompass diabetes care for hospital patients. Auditing and benchmarking of glucose control in inpatients is receiving increasing attention around the world,16 and hospital glucometrics have been developed for systematically analysing and reporting inpatient glucose data17 and assessing diabetes management programs.18
Efficient acquisition of point‐of‐care blood glucose (BG) measurements is essential for glucometric assessment, but has been limited in Australia by the lack of automated technologies for capturing patient‐level glucose data. Glucose monitoring in Australian hospitals typically involves nurses performing bedside capillary glucose measurements with point‐of‐care glucose meters and manually recording the results on paper observation charts or in electronic clinical records. Although data from glucose meters can be downloaded manually, BG measurements are not linked with unique patient identifiers, making patient‐level analysis impossible. Investigations of inpatient glucose control have therefore required labour‐intensive manual auditing of clinical records.19
Networked glucose meters have recently become available in Australia, enabling electronic capture of patient BG measurements, with the data readily available in searchable databases. Networked meters have facilitated hospital‐wide glycaemic management programs18 and inter‐hospital benchmarking of glucose control in the US.20 As this approach will be important for establishing standards of diabetes care in Australian hospitals, we undertook detailed glucometric assessments of consecutive inpatients at a major metropolitan hospital, with the aim of reporting glucometric outcomes and the incidence of hypo‐ and hyperglycaemia.
Methods
We undertook an observational study in the non‐critical care wards of a tertiary referral hospital, the Royal Melbourne Hospital. We installed thirty networked blood glucose meters (StatStrip, Australasian Medical and Scientific [AMSL]) in eight wards during January 2016; the installation was accompanied by a comprehensive staff education program. The meters were connected to the hospital information system and the Health Level 7: Admission, Discharge and Transfer (HL7‐ADT) messaging system for instant transfer of patient information and glucose data. The patient unique record number and time of measurement were recorded with each point‐of‐care BG measurement, allowing analysis of patient‐level glucose data.
Inpatient diabetes care in our hospital is primarily the responsibility of the medical officers of the admitting unit; a diabetes referrals team is available for consultations on a formal referral basis. Patients are treated with various combinations of glucose‐lowering medications and insulin as appropriate. At the time of the study, the hospital had guidelines for inpatient diabetes management, but no dedicated insulin prescription charts or order sets. Patients with diabetes routinely had four capillary BG measurements each day (before each meal and before going to bed).
Participants
We included consecutive inpatients with pre‐existing diabetes or newly detected hyperglycaemia (patients with random capillary BG levels exceeding 11.1 mmol/L but without a history of diabetes) admitted to a study ward during the 10‐week study period (7 March – 22 May 2016). The eight study wards included two general medical, two general surgical, and single cardiology, neurology, neurosurgery, and orthopaedic surgery wards (a total of 220 beds, or 50% of all acute non‐critical care beds); the patients were thus representative of the non‐critical care hospital population. We excluded patients hospitalised for less than 24 hours and those receiving palliative care. Patients were identified and included prospectively at admission, and patient‐ and admission‐related data were extracted from progress notes, discharge summaries, and pathology systems after their discharge.
Glucometric outcomes
We analysed point‐of‐care BG measurements for each patient from ward admission until discharge. We excluded BG measurements after admission day 14 (to avoid skewing by data from the few patients with prolonged hospital stays), BG measurements during intensive care admissions or intravenous insulin infusions, and closely repeated measurements following episodes of hypoglycaemia or hyperglycaemia, as previously described.21
We assessed glycaemic control with the glucometric models described by Goldberg and colleagues:17
- by population: all BG measurements for all patients were included and equally weighted;
- by patient stay: all BG measurements during the hospital stay of a patient were aggregated and weighted equally, irrespective of length of stay;
- by patient‐day: BG measurements were grouped by each calendar day for each patient, and the key glucometric measure is the patient‐day mean glucose level (mean glucose measurement per patient per calendar day).
We compared the glucometric outcomes with a US benchmark based on all BG measurements for the more than 2.4 million people admitted to 635 hospitals during the 2012 calendar year,20 and with United Kingdom National Diabetes Inpatient Audit (NaDIA) data for 15 774 people with diabetes admitted to 209 hospitals during a single day in 2016.16
In addition, we evaluated a novel measure of inpatient glucose control: the adverse glycaemic day (AGD), defined as a patient‐day for which the BG level was below 4.0 mmol/L or above 15.0 mmol/L, extremes that should be avoided in hospital patients.22 The incidence of AGDs (per 1000 patient‐days) is reported, and is the converse of the “good diabetes day” (patient‐day without hypoglycaemia and no more than one measurement exceeding 11 mmol/L) used by NaDIA.16 We compared AGD incidence for medical and surgical patients, and evaluated the temporal distribution of hypoglycaemia or severe hyperglycaemia across the day. Differences between groups were assessed in non‐parametric tests, Fisher exact tests, or χ2 tests, conducted in Minitab 17.2.1 (Minitab).
Ethics approval
The investigation was approved by the Melbourne Health Human Research Ethics Committee (reference, 2015.126), with a waiver of the requirement for individual patient consent.
Results
During the 10‐week study period, there were 465 consecutive admissions of 441 patients with diabetes or newly detected hyperglycaemia; 22 people were admitted twice, one person was admitted three times. Most patients had type 2 diabetes (383, 87%); 130 (29%) had been treated with insulin prior to admission. Patients were treated with insulin during 249 admissions (54%) and with glucocorticoid medications during 74 admissions (16%). The median length of hospital stay was 5 days (interquartile range, 3–9 days) (Box 1).
Primary glucometric outcomes
A total of 9817 BG measurements were made over 2953 patient‐days; the mean number of BG observations was 21 (standard deviation [SD], 16) per patient stay, and 3.3 (SD, 1.7) per patient‐day. A total of 394 patients (85%) had at least one measurement exceeding 10 mmol/L and 206 (44%) had at least one exceeding 15 mmol/L during their stay; 75 people (16%) had at least one episode of hypoglycaemia (BG < 4 mmol/L) and 27 (5.8%) episodes of severe hypoglycaemia (BG < 3 mmol/L). The mean BG level by patient stay was 9.5 mmol/L (SD, 2.8 mmol/L) (Box 2).
In the patient‐day analysis, the mean patient‐day glucose level was 9.5 mmol/L (SD, 3.3 mmol/L). The mean BG level exceeded 10 mmol/L for 1083 (37%) and 15 mmol/L for 216 patient‐days (7.3%); hypoglycaemia and severe hypoglycaemia were respectively recorded for 136 (4.6%) and 38 (1.3%) patient‐days (Box 2).
Adverse glucometric days
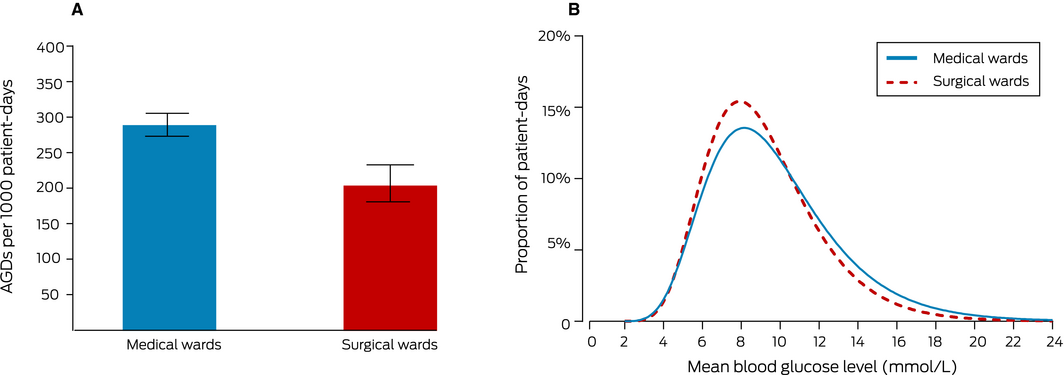
The overall incidence of AGDs was 260 per 1000 patient‐days (95% confidence interval [CI], 245–277 per 1000 patient‐days); of the 769 AGDs, 633 (82%) were related to hyperglycaemia, 113 (15%) to hypoglycaemia, and 23 (3%) to both. There were no AGDs for half the patient admissions (228 of 465); the 121 patients (26%) with one or two AGDs accounted for 165 (21%) of all AGDs, while the 116 patients (25%) who had three or more AGDs accounted for 604 (79%). AGDs were more frequent among medical than surgical ward patients (290 [95% CI, 270–310] v 205 [95% CI, 181–230] AGDs per 1000 patient‐days) (Box 3, A).
The patient‐day mean BG level was also higher for medical than surgical patients (9.7 mmol/L [SD, 3.5 mmol/L] v. 9.2 mmol/L [SD, 3.0 mmol/L] (Box 3, B). The median number of comorbid conditions was higher for medical than surgical patients, and the distribution of estimated glomerular filtration rates at admission was shifted to lower values; glucocorticoid treatment during admission was more frequent among medical ward patients (20% v 9%) (Box 4).
Diurnal distribution of episodes of hypo‐ and hyperglycaemia
Hyperglycaemia was most frequent during the day, with three peaks before lunch, dinner, and bedtime, coinciding with three of the peak times for BG measurements. Hypoglycaemia was most frequent overnight, before breakfast, and before dinner (Box 5). BG measurements were performed between 11 pm and 8 am on 2217 (75%) of patient‐days; 94 of 187 hypoglycaemic episodes (50%) were during this period.
Discussion
Benchmarking of key hospital clinical outcomes is essential for improving the quality of care and patient safety. We anticipate that our detailed study of glucometric outcomes in an Australian hospital will initiate a systematic approach to auditing and benchmarking glycaemic control in Australia.
Our patient‐day mean glucose level was marginally higher than for the US hospital benchmark20 (9.5 mmol/L v 9.3 mmol/L); the incidence of hyperglycaemia was higher (37% v 32%), but that of hypoglycaemia lower (4.1% v 6.1%) in our sample (Box 6). The patients in the British NaDIA had similar characteristics to our patients (90% with type 2 diabetes, 29% treated with insulin prior to admission);16 the incidence of hypoglycaemia was, however, lower in our group: BG level under 4 mmol/L, 16% v 20%; BG level below 3 mmol/L, 5.8% v 8.4%. As NaDIA does not collect detailed glucometric data, comparing the incidence of hyperglycaemia with our findings was not possible.
Comparisons with the American benchmark may be limited by differences in patient selection and hospital management practices. The US benchmarking study, despite comprehensive glucose data, did not include patient‐level clinical information,20 so it was not possible to ascertain whether the characteristics of the Australian and American cohorts were similar. We included patients with diabetes or newly detected hyperglycaemia, whereas the US benchmarking study included all patients whose blood glucose levels were monitored, including for reasons unrelated to diabetes. Further, we did not include all patients with diabetes in our study, excluding, for example, those admitted as nephrology or cardiothoracic surgery patients. These differences may restrict the direct comparison of glucose outcomes. Further, like most Australian hospitals, our hospital has not adopted basal–bolus insulin treatment for all inpatients with diabetes, an approach that is widely promoted in the US. The incidence of hyperglycaemia among our patients was similar to that found by a study in western Sydney,19 but the glucometric outcomes in Australian hospitals that regularly employ basal–bolus insulin treatment23,24 may be more comparable with those of American hospitals. In the absence of standardised glucometric analyses by Australian hospitals, this question remains open, but we have shown that glucometric analysis and benchmarking is possible in an Australian hospital.
Optimal glycaemic management requires a balance between reducing hyperglycaemia and avoiding hypoglycaemia, and a complete glucometric analysis therefore concurrently assesses and reports both conditions. The traditional glucometric outcome of patient‐day mean BG level does not reflect the two extremes; further, a lower mean BG level may not reflect safer glycaemic control if the hospital rate of hypoglycaemia is also high. Accordingly, the AGD, encompassing both hyperglycaemia and hypoglycaemia, could become an important index of glycaemic control and a useful concept for educating health professionals about unsafe glycaemia in hospital patients. Guidelines for inpatients recommend avoiding BG levels below 4 mmol/L or above 10 mmol/L, but the level of the upper threshold depends on the clinical context.13 We chose 15 mmol/L because it pragmatically defined an unsafe hyperglycaemic extreme that should generally be avoided, regardless of clinical context, but does not require aggressive treatment that could increase the risk of hypoglycaemia. The impact of hospital diabetes care quality improvement programs can be assessed with the AGD concept; a recent cluster randomised trial found that AGD incidence, as a primary outcome measure, was reduced by an early intervention model of inpatient diabetes care.25
The incidence rate of 260 AGDs per 1000 patient‐days indicates excursions of BG levels into the unsafe extreme ranges for a substantial proportion of patient‐days. The incidence was higher for medical than surgical patients, perhaps reflecting greater complexity of their diabetes and hospital treatment. The peak periods for hyperglycaemia were before lunch, dinner and bedtime, suggesting that the prandial insulin regimen was inadequate; more standardised insulin treatment at meal times could reduce the incidence of hyperglycaemia. In contrast, hypoglycaemia was more frequent overnight, as also reported by another study.26 This suggests that insulin and sulphonylurea treatment should be employed at night with caution, and that carbohydrate snacks at bedtime might be helpful, especially for people with risk factors for hypoglycaemia. Further, as one‐quarter of patients contributed 81% of AGDs, management strategies should focus on identifying and targeting this subset of individuals at greater risk of glycaemic extremes.
Networked glucose meter technology was fundamental to our study, as it facilitated the automated collection of complete patient‐level, point‐of‐care BG data. Its implementation required multidisciplinary cooperation between nursing, medical, diabetes education, information technology, and biomedical engineering teams. Glucometric assessment might be possible without networked meter technology, but it would require more resources, and incomplete or inaccurate data would be more likely. Most importantly, networked meters contribute to improved glycaemic and clinical outcomes by enabling remote surveillance of BG measurements and proactive glycaemic management programs.12,18,25
Conclusion
Auditing and benchmarking BG outcomes in hospital patients is essential for improving glycaemic control and ultimately for improving patient outcomes. We undertook a detailed glucometric study of consecutive inpatients in an Australian hospital that was supported by point‐of‐care networked glucose meter technology. We propose that AGD incidence is a suitable measure of safe glucose control in hospital patients for future benchmarking. With the increasing availability of networked glucose meters, more health services in Australia will be able to implement this technology for local auditing and benchmarking of safe diabetes care for hospital patients.
Box 1 – Characteristics of the 441 patients with pre‐existing diabetes or newly detected hyperglycaemia admitted to the eight study wards
|
Characteristics: patients |
|
||||||||||||||
|
|
|||||||||||||||
|
Total number of patients |
441 |
||||||||||||||
|
Age (years), mean (SD) |
70 (15) |
||||||||||||||
|
Sex (men) |
247 (56%) |
||||||||||||||
|
Modified Charlson comorbidity score,* median (IQR) |
2 (0–3) |
||||||||||||||
|
Diabetes type |
|||||||||||||||
|
Type 2 diabetes |
383 (87%) |
||||||||||||||
|
Type 1 diabetes |
19 (4%) |
||||||||||||||
|
Other (including pancreatogenic and steroid‐induced) |
15 (3%) |
||||||||||||||
|
Newly detected hyperglycaemia |
24 (5%) |
||||||||||||||
|
Diabetes treatment prior to admission |
|||||||||||||||
|
Diet only |
99 (23%) |
||||||||||||||
|
Glucose‐lowering medications only† |
212 (48%) |
||||||||||||||
|
Insulin |
130 (29%) |
||||||||||||||
|
Glycated haemoglobin (HbA1c) (mmol/mol), median (IQR) |
54 (45–65) |
||||||||||||||
|
Estimated glomerular filtration rate (mL/min/1.73 m2) (admission) |
|||||||||||||||
|
≤ 30 |
49 (11%) |
||||||||||||||
|
31–59 |
139 (32%) |
||||||||||||||
|
60–89 |
139 (32%) |
||||||||||||||
|
≥ 90 |
104 (24%) |
||||||||||||||
|
Missing data |
10 (2%) |
||||||||||||||
|
Characteristics: admissions |
|||||||||||||||
|
Total number of admissions |
465 |
||||||||||||||
|
Admission to medical unit |
293 (63%) |
||||||||||||||
|
General medicine |
117 (25%) |
||||||||||||||
|
Cardiology |
71 (15%) |
||||||||||||||
|
Neurology and stroke |
49 (11%) |
||||||||||||||
|
Respiratory |
21 (4%) |
||||||||||||||
|
Gastroenterology |
22 (5%) |
||||||||||||||
|
Other medical |
13 (3%) |
||||||||||||||
|
Surgical unit |
172 (37%) |
||||||||||||||
|
General surgery |
70 (15%) |
||||||||||||||
|
Neurosurgery |
49 (11%) |
||||||||||||||
|
Orthopaedic and trauma |
47 (10%) |
||||||||||||||
|
Other surgical |
6 (1%) |
||||||||||||||
|
Elective admission |
59 (13%) |
||||||||||||||
|
Length of stay (days), median (IQR) |
5 (3–9) |
||||||||||||||
|
Insulin treatment during hospital admission |
|||||||||||||||
|
No insulin |
216 (46%) |
||||||||||||||
|
Basal (with or without prandial insulin) |
105 (23%) |
||||||||||||||
|
Pre‐mixed insulin |
59 (13%) |
||||||||||||||
|
Supplemental insulin only |
85 (18%) |
||||||||||||||
|
Glucocorticoid treatment‡ |
74 (16%) |
||||||||||||||
|
Managed by inpatient diabetes team |
48 (10%) |
||||||||||||||
|
|
|||||||||||||||
|
IQR = interquartile range; SD = standard deviation. * Items related to diabetes excluded. † Including glucagon‐like peptide‐1 agonists. ‡ Treatment with glucocorticoid medications (dose equivalent: at least 7.5 mg prednisolone) for at least 24 hours. |
|||||||||||||||
Box 2 – Glucometric data for 441 patients (465 admissions) with pre‐existing diabetes or newly detected hyperglycaemia admitted to the eight study wards
|
|
Model |
||||||||||||||
|
By population |
By patient stay |
By patient‐day |
|||||||||||||
|
|
|||||||||||||||
|
Number of samples |
9817 |
465 |
2953 |
||||||||||||
|
Blood glucose observations per unit, mean (SD) |
9817 |
21 (16) |
3.3 (1.7) |
||||||||||||
|
Blood glucose level (mmol/L), mean (SD) |
9.9 (4.3) |
9.5 (2.8) |
9.5 (3.3) |
||||||||||||
|
Mean blood glucose level > 10 mmol/L |
NA |
171 (37%) |
1083 (37%) |
||||||||||||
|
Mean blood glucose level > 15 mmol/L |
NA |
27 (5.8%) |
216 (7.3%) |
||||||||||||
|
Any measurement < 4 mmol/L |
187 (1.9%) |
75 (16%) |
136 (4.6%) |
||||||||||||
|
Any measurement < 3 mmol/L |
47 (0.5%) |
27 (5.8%) |
38 (1.3%) |
||||||||||||
|
Any measurement > 10 mmol/L |
3945 (40%) |
394 (85%) |
1672 (57%) |
||||||||||||
|
Any measurement > 15 mmol/L |
1254 (13%) |
206 (44%) |
656 (22%) |
||||||||||||
|
Adverse glycaemia (< 4 mmol/L or > 15 mmol/L) |
1441 (15%) |
237 (51%) |
769 (26%) |
||||||||||||
|
|
|||||||||||||||
|
NA = not applicable; SD = standard deviation. |
|||||||||||||||
Box 3 – Glycaemic control in patients admitted to medical and surgical units. A. Patient‐days with any blood glucose measurement below 4 mmol/L or above 15 mmol/L), with 95% confidence intervals. B. Distribution of patient‐day mean blood glucose level measurements
Box 4 – Patient and treatment characteristics for medical and surgical ward patients
|
|
Medical wards |
Surgical wards |
P * |
||||||||||||
|
|
|||||||||||||||
|
Number of patients |
282 |
159 |
|
||||||||||||
|
Age (years), mean (SD) |
72 (15) |
68 (14) |
0.008 |
||||||||||||
|
Sex (men) |
155 (55%) |
92 (58%) |
0.62 |
||||||||||||
|
Modified Charlson comorbidity score,† median (IQR) |
2 (1–4) |
1 (0–2) |
< 0.001 |
||||||||||||
|
Patients with type 2 diabetes |
246 (87%) |
137 (86%) |
0.77 |
||||||||||||
|
Insulin treatment prior to admission |
89 (32%) |
41 (26%) |
0.23 |
||||||||||||
|
Glycated haemoglobin (HbA1c) level (mmol/mol), median (IQR) |
54 (45–67) |
52 (44–61) |
0.12 |
||||||||||||
|
Estimated glomerular filtration rate (mL/min/1.73 m2) (admission) |
|
|
< 0.001 |
||||||||||||
|
≤ 30 |
39 (14%) |
9 (6%) |
|
||||||||||||
|
31–59 |
98 (36%) |
41 (26%) |
|
||||||||||||
|
60–89 |
88 (32%) |
51 (33%) |
|
||||||||||||
|
≥ 90 |
49 (18%) |
55 (35%) |
|
||||||||||||
|
Glucocorticoid treatment‡ |
55 (20%) |
14 (9%) |
0.002 |
||||||||||||
|
Managed by inpatient diabetes team |
26 (9%) |
20 (13%) |
0.33 |
||||||||||||
|
|
|||||||||||||||
|
IQR = interquartile range; SD = standard deviation. *Kruskal–Wallis test for continuous variables, Fisher exact or χ2 tests for categorical variables. † Items related to diabetes excluded. ‡ Treatment with glucocorticoid medications (dose equivalent: at least 7.5 mg prednisolone) for at least 24 hours. |
|||||||||||||||
Box 5 – The diurnal distribution of blood glucose measurements (A), blood glucose measurements exceeding 15 mmol/L (B), and blood glucose measurements below 4 mmol/L (C)*
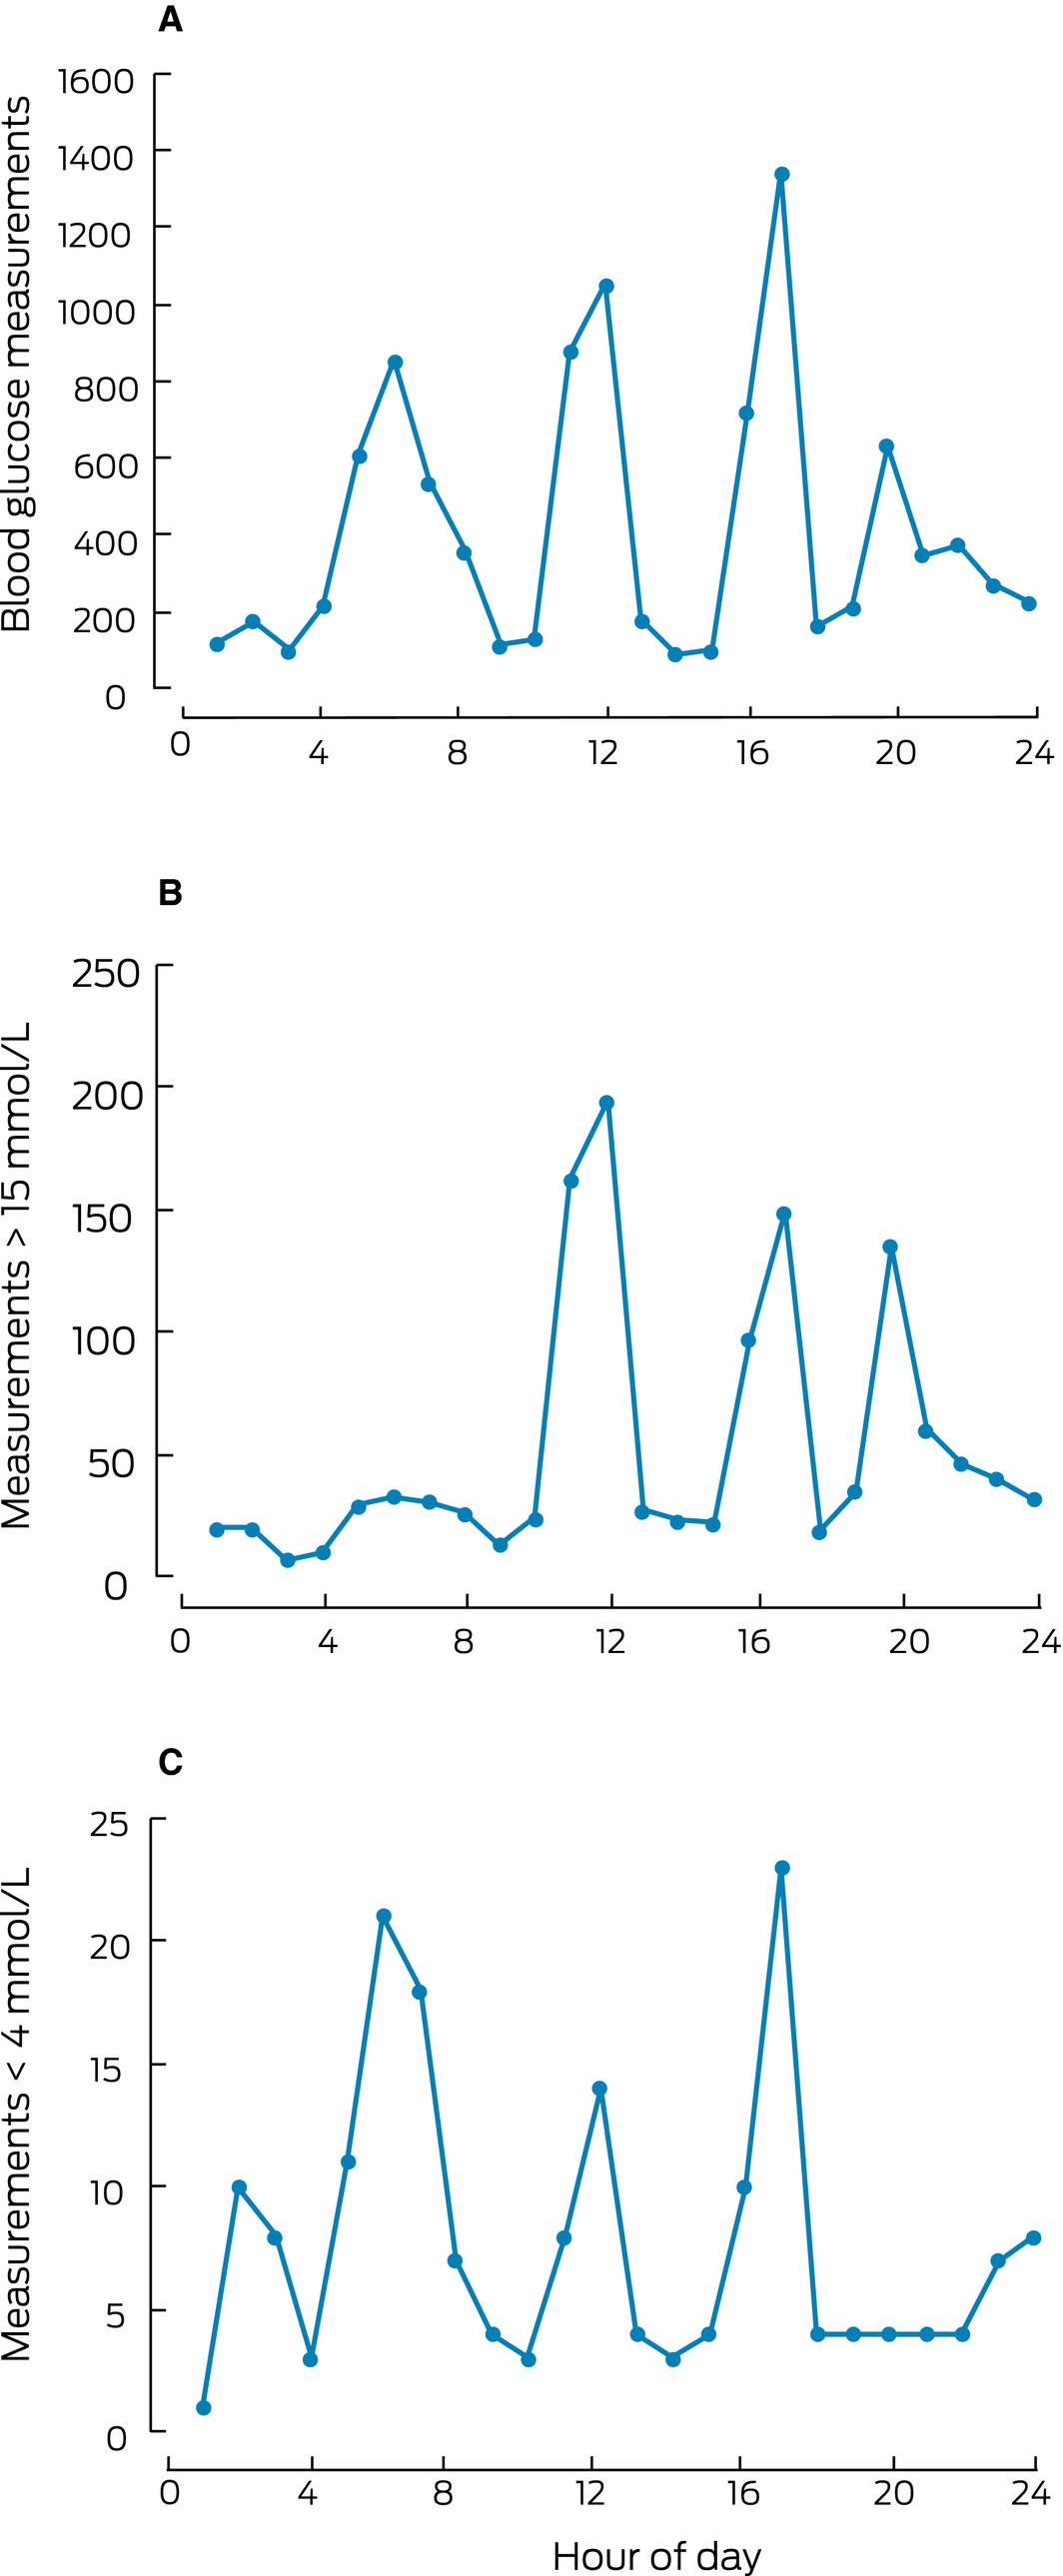
* Meals are routinely provided at 8 am (breakfast), noon (lunch), and 5 pm (dinner); bedtime is usually at 9 pm.
Box 6 – Glucometric data (patient‐day model) for our sample of patients and for the United States hospitals benchmark19
|
|
Our sample* |
US hospital benchmark† |
P ‡ |
||||||||||||
|
|
|||||||||||||||
|
Number of patient admissions |
465 |
2.4 million |
|
||||||||||||
|
Number of patient‐days |
2953 |
about 17 million |
|
||||||||||||
|
Blood glucose (mmol/L), mean (SD) |
9.5 (3.3) |
9.3 (0.8) |
0.001 |
||||||||||||
|
Hyperglycaemia |
|||||||||||||||
|
Mean glucose > 10.0 mmol/L (> 180 mg/dL), patient‐days |
1083 (37%) |
32.3% |
< 0.001 |
||||||||||||
|
Mean glucose > 13.9 mmol/L (> 250 mg/dL), patient‐days |
314 (11%) |
7.4% |
< 0.001 |
||||||||||||
|
Mean glucose > 16.7 mmol/L (> 300 mg/dL), patient‐days |
110 (3.7%) |
2.3% |
< 0.001 |
||||||||||||
|
Hypoglycaemia |
|||||||||||||||
|
Glucose < 3.9 mmol/L (< 70 mg/dL), patient‐days |
120 (4.1%) |
6.1% |
< 0.001 |
||||||||||||
|
Glucose < 2.8 mmol/L (< 50 mg/dL), patient‐days |
26 (0.9%) |
1.7% |
< 0.001 |
||||||||||||
|
|
|||||||||||||||
|
SD = standard deviation. * Consecutive patients with diabetes admitted to non‐critical care wards over 10 weeks. † Consecutive patients admitted to non‐critical care wards (635 hospitals) over one calendar year. ‡ Kruskal–Wallis test for continuous variables, Fisher exact test for categorical variables. |
|||||||||||||||
Received 22 February 2019, accepted 29 March 2019
- Mervyn Kyi1,2
- Peter G Colman1
- Lois M Rowan1
- Katie A Marley1
- Paul R Wraight1
- Spiros Fourlanos1,2
- 1 Royal Melbourne Hospital, Melbourne, VIC
- 2 University of Melbourne, Melbourne, VIC
This investigator‐initiated study was supported by an Australian Diabetes Society–Sanofi Diabetes Research Grant and a Royal Melbourne Hospital Lottery grant. Mervyn Kyi was supported by a National Health and Medical Research Council postgraduate scholarship. We acknowledge the support of Australasian Medical and Scientific (in particular, Emma Farrugia, Martin Rocliffe and Hari Chandra) for installing the networked blood glucose meters, and for training and technical support.
No relevant disclosures.
- 1. Australian Institute of Health and Welfare. Australia's health 2016 (Cat. No. AUS 199; Australia's Health series no. 15). Canberra: AIHW, 2016.
- 2. Magliano DJ, Peeters A, Vos T, et al. Projecting the burden of diabetes in Australia: what is the size of the matter? Aust N Z J Public Health 2009; 33: 540–543.
- 3. Jiang HJ, Stryer D, Friedman B, et al. Multiple hospitalizations for patients with diabetes. Diabetes Care 2003; 26: 1421–1426.
- 4. Bach LA, Ekinci EI, Engler D, et al. The high burden of inpatient diabetes mellitus: the Melbourne Public Hospitals Diabetes Inpatient Audit. Med J Aust 2014; 201: 334–338. https://www.mja.com.au/journal/2014/201/6/high-burden-inpatient-diabetes-mellitus-melbourne-public-hospitals-diabetes.
- 5. Nanayakkara N, Nguyen H, Churilov L, et al. Inpatient HbA1c testing: a prospective observational study. BMJ Open Diabetes Res Care 2015; 3: e000113.
- 6. Valentine NA, Alhawassi TM, Roberts GW, et al. Detecting undiagnosed diabetes using glycated haemoglobin: an automated screening test in hospitalised patients. Med J Aust 2011; 194: 160–164. https://www.mja.com.au/journal/2011/194/4/detecting-undiagnosed-diabetes-using-glycated-haemoglobin-automated-screening.
- 7. Lee CM, Colagiuri R, Magliano DJ, et al. The cost of diabetes in adults in Australia. Diabetes Res Clin Pract 2013; 99: 385–390.
- 8. American Diabetes Association. Economic costs of diabetes in the US in 2017. Diabetes Care 2018; 41: 917–928.
- 9. Clement S, Braithwaite SS, Magee MF, et al. Management of diabetes and hyperglycemia in hospitals. Diabetes Care 2004; 27: 553–591.
- 10. Umpierrez GE, Isaacs SD, Bazargan N, et al. Hyperglycemia: an independent marker of in‐hospital mortality in patients with undiagnosed diabetes. J Clin Endocrinol Metab 2002; 87: 978–982.
- 11. Brutsaert E, Carey M, Zonszein J. The clinical impact of inpatient hypoglycemia. J Diabetes Complications 2014; 28: 565–572.
- 12. Kyi M, Wraight PR, Rowan LM, et al. Glucose alert system improves health professional responses to adverse glycaemia and reduces the number of hyperglycaemic episodes in non‐critical care inpatients. Diabet Med 2018; 35: 816–823.
- 13. Australian Diabetes Society. Guidelines for routine glucose control in hospitals. 2012. http://diabetessociety.com.au/documents/ADSGuidelinesforRoutineGlucoseControlinHospitalFinal2012_000.pdf (viewed Dec 2018).
- 14. Australian Commission on Safety and Quality in Health Care. National safety and quality health service standards: guide for hospitals. Second edition. Sydney: ASCQHC, 2017. https://www.safetyandquality.gov.au/wp-content/uploads/2017/12/National-Safety-and-Quality-Health-Service-Standards-Guide-for-Hospitals.pdf (viewed Dec 2018).
- 15. Australian Department of Health. Australian National Diabetes Strategy 2016–2020. Updated 12 Jan 2018. http://www.health.gov.au/internet/main/publishing.nsf/content/nds-2016-2020 (viewed Dec 2018).
- 16. NHS Digital. National Diabetes Inpatient Audit (NaDIA) 2016. Mar 2017. http://www.digital.nhs.uk/pubs/nadia2016 (viewed Dec 2018).
- 17. Goldberg PA, Bozzo JE, Thomas PG, et al. “Glucometrics”: assessing the quality of inpatient glucose management. Diabetes Technol Ther 2006; 8: 560–569.
- 18. Mendez CE, Ata A, Rourke JM, et al. Daily Inpatient Glycemic Survey (DINGS): a process to remotely identify and assist in the management of hospitalized patients with diabetes and hyperglycemia. Endocr Pract 2015; 21: 927–935.
- 19. Cheung NW, Cinnadaio N, O'Neill A, et al. Implementation of a dedicated hospital subcutaneous insulin prescription chart: effect on glycaemic control. Diabetes Res Clin Pract 2011; 92: 337–341.
- 20. Bersoux S, Cook CB, Kongable GL, et al. Benchmarking glycemic control in US hospitals. Endocr Pract 2014; 20: 876–883.
- 21. Weinberg ME, Bacchetti P, Rushakoff RJ. Frequently repeated glucose measurements overestimate the incidence of inpatient hypoglycemia and severe hyperglycemia. J Diabetes Sci Technol 2010; 4: 577–582.
- 22. Wagstaff AE, Cheung NW. Diabetes and hyperglycemia in the critical care setting: has the evidence for glycemic control vanished? (Or … is going away?). Curr Diab Rep 2014; 14: 444.
- 23. Perera NJ, Harding AJ, Constantino MI, et al. Triple‐B (basal‐bolus‐booster) subcutaneous insulin regimen: a pragmatic approach to managing hospital inpatient hyperglycaemia. Practical Diabetes 2011; 28: 266–269.
- 24. Roberts GW, Aguilar‐Loza N, Esterman A, et al. Basal–bolus insulin versus sliding‐scale insulin for inpatient glycaemic control: a clinical practice comparison. Med J Aust 2012; 196: 266–269. https://www.mja.com.au/journal/2012/196/4/basal-bolus-insulin-versus-sliding-scale-insulin-inpatient-glycaemic-control.
- 25. Kyi M, Colman PG, Wraight PR, et al. Early intervention for diabetes in medical and surgical inpatients decreases hyperglycemia and hospital‐acquired infections: a cluster randomized trial. Diabetes Care 2019; 42: 832–840.
- 26. Rajendran R, Kerry C, Rayman G, et al. Temporal patterns of hypoglycaemia and burden of sulfonylurea‐related hypoglycaemia in UK hospitals: a retrospective multicentre audit of hospitalised patients with diabetes. BMJ Open 2014; 4: e005165.
Abstract
Objective: To assess glucometric outcomes and to estimate the incidence of hypo‐ and hyperglycaemia among non‐critical care inpatients in a major Australian hospital.
Design, setting and participants: A prospective 10‐week observational study (7 March – 22 May 2016) of consecutive inpatients with diabetes or newly detected hyperglycaemia admitted to eight medical and surgical wards at the Royal Melbourne Hospital. Point‐of‐care blood glucose (BG) data were collected with networked glucose meters.
Main outcome measures: Glycaemic control, as assessed with three glucometric models (by population, by patient, by patient‐day); incidence of adverse glycaemic days (AGDs; patient‐days with BG levels below 4 mmol/L or above 15 mmol/L).
Results: During the study period, there were 465 consecutive admissions of 441 patients with diabetes or newly detected hyperglycaemia, and 9817 BG measurements over 2953 patient‐days. The mean patient‐day BG level was 9.5 mmol/L (SD, 3.3 mmol/L). The incidence of hyperglycaemia was higher than for a United States hospital benchmark (patient‐days with mean BG level above 10 mmol/L, 37% v 32), and that of hypoglycaemia lower (proportion of patient‐days with mean BG level below 3.9 mmol/L, 4.1% v 6.1%). There were 260 (95% CI, 245–277) AGDs per 1000 patient‐days; the incidence was higher in medical than surgical ward patients (290 [CI, 270–310] v 206 [CI, 181–230] per 1000 patient‐days). 604 AGDs (79%) were linked with 116 patients (25%). Episodes of hyperglycaemia (BG above 15 mmol/L) were more frequent before lunch, dinner, and bedtime; 94 of 187 episodes of hypoglycaemia (BG below 4 mmol/L) occurred between 11 pm and 8 am.
Discussion: Glucometric analysis supported by networked glucose meter technology provides detailed inpatient data that could enable local benchmarking for promoting safe diabetes care in Australian hospitals.