


The known A variety of options for rehabilitation are available to patients who have undergone total knee replacements (TKRs).
The new The inpatient rehabilitation rate after TKRs in private hospitals increased between 2009 and 2016. Interhospital variation in rates persisted after adjusting for patient-related factors, suggesting that some inpatient rehabilitation is low value care. Provider-related factors were three times as important as patient factors for predicting inpatient rehabilitation.
The implications The use of inpatient rehabilitation after TKR can be substantially reduced to improve health care efficiency without any detriment to health outcomes.
The rate of total knee replacement (TKR) in Australia is among the highest in the world.1 More than 50 000 TKRs were performed in Australia during 2016;2 about 70% were delivered in private hospitals.3 Post-surgery rehabilitation is a core component of the care pathway for facilitating functional recovery after a TKR,4 including inpatient, home-based, community-based, and outpatient rehabilitation. It was recently reported that 43% of patients who underwent a TKR funded by Medibank Private (a large private health insurer in Australia) during 2014–16 were referred for inpatient rehabilitation.5 However, functional improvements in patients who received inpatient rehabilitation after TKR have not generally been superior in randomised controlled trials to those achieved with home- or community-based rehabilitation.6,7 In North America, rates of inpatient rehabilitation declined during the 2000s.8,9
Inpatient rehabilitation referral rates in Australia during 2014–16 varied between surgeons from 0 to 100%,5 but the relevant data were not adjusted for patient characteristics that predict inpatient rehabilitation, such as age, comorbid conditions, living alone, and surgical complications.10 In Australia, routinely collected outcomes data that could be analysed to evaluate the benefits of rehabilitation are limited. The Australasian Rehabilitation Outcomes Centre (https://ahsri.uow.edu.au/aroc/index.html) records data for a functional measure after inpatient rehabilitation, but corresponding data for patients who undergo other forms of rehabilitation are not routinely collected. As an alternative approach, Duckett and colleagues11 have promoted analysis of variation for similar patients at the hospital level; variation at this level that persists after adjusting for patient factors may indicate low value care.
Our study had three aims. The first was to investigate changes since 2009 in the rate of inpatient rehabilitation after TKR in Australia, and to quantify the degree to which any change might be explained by patient-related factors (demography, comorbid conditions, complications of surgery) or reducing the average acute length of stay in hospital (LOS). The second was to identify potentially low value care by quantifying hospital inpatient rehabilitation rates, adjusted for patient characteristics. Third, we quantified the relative contributions of hospital- and surgeon-related factors and of patient-related characteristics to variation in inpatient rehabilitation rates.
Methods
Dataset
We analysed de-identified Medibank administrative claims data and hospital casemix protocol data for 35 389 patients aged 40–89 years who had not previously undergone hip or knee replacement, who had received an acute primary, unilateral TKR during January 2009 – December 2016. Patient information included age, sex, socio-economic status (Index of Relative Socio-economic Advantage and Disadvantage, IRSAD12), living alone, smoking, comorbid conditions (as evaluated with the Charlson comorbidity index13), and hospital claims during the 12 months preceding surgery. LOS data for the acute TKR procedure and the associated inpatient rehabilitation admission were also included. Provider information included unique identifiers for each of the 170 hospitals in which the surgery was performed and the 1254 surgeons who performed the TKRs (further details in the online Appendix, table 1). All patient-, surgeon-, and hospital-related data were de-identified prior to analysis.
Statistical analysis
All analyses were conducted in Stata 14.2 (StataCorp). Five linear probability regression models were generated (Box 1; online Appendix, table 2). The proportion of patients who underwent inpatient rehabilitation was the dependent variable in all models. Data were adjusted for patient and surgical complexity using the socio-demographic and surgical factors listed above. All adjusted rates were computed relative to the covariate means with the margins, atmeans Stata command.
Funnel plots of the outcome rate (hospital inpatient rehabilitation rate) against the sample volume or population (hospital TKR volume) highlighted variation between hospitals in inpatient rehabilitation rates. Two sets of hospital data were included in each funnel plot. The first set depicted the inpatient rehabilitation rate and TKR volume for each hospital during the study period. As the rate would be higher for hospitals that received relatively large proportions of patients more likely to require inpatient rehabilitation (eg, older patients; people with comorbid conditions), we also plotted hospital rates adjusted for patient-related factors by econometric modelling; that is, the estimated rate for each hospital had they received an average mix of patient types.
In each plot, 95% confidence intervals (CIs) around the mean inpatient rehabilitation rate were calculated, forming a funnel that narrows as TKR volume increases. At higher TKR volumes, it is less likely that variations are due to chance. As the overall mean inpatient rehabilitation rate for our private hospital dataset was not necessarily clinically optimal, CIs were also calculated for the post-TKR inpatient rehabilitation rate of 17% reported for a sample of public hospitals.14
The upper outlier count metric was defined as the number of hospitals with inpatient variation that placed them above the mean and beyond the 95% CI. Shapley decomposition of model 5 (Box 1) was computed with the REGO Stata module (http://research.uni-leipzig.de/rego/) to investigate the relative contribution of patient-, surgeon- and hospital-related factors to variation in rehabilitation destination. Multicollinearity between factors is discussed in the online Appendix.
Ethics approval
Ethics approval was granted by the Monash University Human Research Ethics Committee (project number, 9729).
Results
During 2009–2016, 35 389 people underwent Medibank-funded TKRs. Their mean age was 68.7 years (standard deviation [SD], 8.7 years); 20 721 (58.6%) were women; 20 667 (58.4%) were from metropolitan areas. The mean age of patients who underwent inpatient rehabilitation was higher than for those who did not (71.0 years [SD, 8.7] v 67.3 years [SD, 8.4]), the distribution of Charlson comorbidity scores was shifted to higher values, and larger proportions had had surgical complications (1.6% v 1.1%) or lived alone (7.6% v 1.1%) (Box 2).
Inpatient rehabilitation rate over time (models 1 and 2)
The inpatient rehabilitation rate increased from 31% in 2009 to 45% in 2016 (mean increase, 14 percentage points; 95% CI, 12–16 percentage points). Over the same period, the proportions of patients who were aged 70 or more, lived alone, or had comorbid conditions also increased. These latter changes accounted for almost one-third of the total increase in inpatient rehabilitation rate (Box 3).
Mean LOS for the acute surgery episode declined from 7.1 days (SD, 1.4 days) in 2009 to 5.4 days (SD, 1.0 days) in 2016 (mean decrease, 1.7 days; 95% CI, 1.5–1.8 days) (Box 2). The reduction in acute LOS during the study period accounted for almost 15% of the increase in inpatient rehabilitation rate (Box 3). The changes in patient-related factors and LOS together explained about half of the increase in inpatient rehabilitation rate. The association between LOS and inpatient rehabilitation is further discussed in the online Appendix.
Variation in rehabilitation practices (models 3–5)
The funnel plot of inpatient rehabilitation rates by hospital during 2009–2016 indicated there was significant variation between hospitals (Box 4, Box 5). An association between TKR volume and inpatient rehabilitation rate was not apparent; the five hospitals with the greatest volumes included two sites with inpatient rehabilitation rates below 20% and two with rates exceeding 60%. A few hospitals had zero inpatient rehabilitation rates, suggesting that they did not have rehabilitation facilities. Excluding these hospitals from supplementary analyses did not substantially change the overall results (data not shown).
Marked variation in hospital inpatient rehabilitation rates persisted after adjusting for patient-related factors; the average magnitude of the effect of adjustment on inpatient rehabilitation rates was 4 percentage points (Box 4, Box 5), suggesting that these patient-related factors did not explain a large proportion of interhospital variation.
Actual inpatient rehabilitation rates for 46 of 170 hospitals (27%) were above the 95% CI for the mean private inpatient rehabilitation rate of 38%; after adjusting for patient-related factors, 44 hospitals remained outliers and two other hospitals became outliers (Box 4, Box 6). After adjusting for patient-related factors, inpatient rehabilitation rates for 79 of 170 hospitals (46%) were above the 95% CI for the mean public hospital inpatient rate of 17% (Box 5, Box 6). The adjusted R2 (goodness-of-fit) values increased with the addition of patient- and surgeon-related factors, indicating that each explains some of the variation in inpatient rehabilitation rate; however, more than half the variation was not explained by these factors.
Contributions to variation (model 5)
The Shapley decomposition results suggested that hospital-related factors (46.9%) made the largest contribution of the factors included to variation in inpatient rehabilitation rates; together with surgeon-related factors (28.5%), provider-related factors explained three times as much of the variation as patient-related factors (24.6%).
Discussion
A recent MJA editorial noted that simply identifying variation in health is not enough to facilitate change without further careful analysis.15 In response, we analysed more than 35 000 admissions to private hospitals for TKRs in Australia during 2009–2016. We made three key findings. Firstly, inpatient rehabilitation rates increased from 31% to 45% during the study period, while mean acute surgery admission LOS declined and the complexity of the patients (aged 70 years or more, lived alone, or had comorbid conditions) increased. However, these changes explained only about half the increase in inpatient rehabilitation rate. Secondly, marked variation between private hospitals in inpatient rehabilitation rates persisted after adjusting for patient-related factors; the rates at more than one-quarter of hospitals significantly exceeded the mean private inpatient rehabilitation rate, and almost half the hospitals significantly exceeded the mean public hospital rate. Finally, provider-related factors (hospital- and surgeon-related) explained three times as much of the variation between hospitals as did patient characteristics (demographic, clinical and surgical attributes); hospital-related factors constituted the major driver category.
Comparison with previous reports
Patients require some form of rehabilitation after complex surgery such as TKR, but clinical evidence does not support the need for in-hospital rehabilitation. A recent analysis of 258 privately insured patients in 12 Australian hospitals found that care pathways incorporating inpatient rehabilitation were significantly more expensive for uncomplicated patients than those that did not (mean difference, $9500; interquartile range, $7000–$11 497) but were not associated with improved patient-reported outcomes.16 Randomised controlled trials that evaluated inpatient rehabilitation6,7 and a systematic review by the Royal Australasian College of Surgeons17 also concluded that outcomes for patients who had outpatient or home-based care after TKR were comparable with those of patients who attended inpatient rehabilitation.18 Our study extends the evidence base for examining this question by analysing a large administrative dataset and investigating the drivers of inpatient rehabilitation in the private health care sector.
We found that the inpatient rehabilitation rate in Australian private hospitals increased by almost 50% between 2009 and 2016, contrasting with the reported substantial declines in inpatient rehabilitation rates overseas during the 2000s. Inpatient rehabilitation rates in the United States decreased from a peak of 35% in 2003 to 11% in 2009,8 with a mean rate during 2009–2014 of 15%;17 in Ontario, Canada, rates dropped from 25% in 2009–10 to less than 10% in 2012–13.9 Our analysis suggests that less than half of the increase in Australia can be explained by a higher proportion of complex patients and reduced acute surgery admission LOS; 50% of the increase was therefore unexplained. Improved techniques for TKR, including computer-assisted navigation19 and perioperative analgesia,20 would be expected to reduce rather than increase the need for inpatient rehabilitation.
We found substantial variation between private hospitals in inpatient rehabilitation rates that was not explained by patient-related factors. Patients in hospitals with high rates of inpatient rehabilitation were similar to those in hospitals with low rates, eliminating patient complexity as the reason. When combined with clinical findings that inpatient rehabilitation provides no more clinical benefit for uncomplicated patients than home or community rehabilitation, our results provide compelling evidence that at least some of inpatient rehabilitation in hospitals with high rates is low value care.
We found that the most important determinant of whether a patient is admitted to inpatient rehabilitation was the hospital where the TKR procedure was undertaken. This factor was substantially more important than the clinical profile of the patient; that is, the same patient may enter different rehabilitation pathways according to the hospital in which they were operated. Potential systematic reasons for some private hospitals encouraging inpatient rehabilitation include the fact that it is often funded on a per diem basis, whereby the hospital receives an additional payment per rehabilitation day in addition to the initial TKR surgery payment. From a hospital perspective, offering a service that delivers benefits to patients for which it is well remunerated is consequently attractive. However, it is less so from the health system perspective: home- and community-based rehabilitation deliver similar outcomes at much lower cost. As noted in another recent MJA editorial,18 inpatient rehabilitation has become an industry, with hospitals offering new and undoubtedly excellent facilities, but at a cost that, for many patients, is not justified by better outcomes.
Implications for clinical practice
Our findings indicate that the proportion of patients who receive inpatient rehabilitation after a TKR can be reduced, improving health care efficiency without harming health outcomes. There is no consensus regarding the ideal rate of inpatient rehabilitation, but the public health system rate in Australia of 17%, rates under 11% in the United States and Canada, and the clinical evidence discussed above suggest that the private inpatient rehabilitation rate in Australia of 45% is too high. Were it returned to the 2009 level (31%) — still higher than the cited comparison rates — net annual rehabilitation costs could be reduced by $50 million (according to the incremental cost differences reported by Naylor and colleagues16) and almost 60 000 hospital bed-days made available for other patients.
Improving system performance
Clear clinical guidelines are an evidence-based means for improving system performance, but there are no relevant guidelines in Australia regarding best practice for rehabilitation after TKR.17 Adoption of a clinical protocol by one hospital improved the odds of rehabilitation in the home rather than inpatient rehabilitation by 45%.20 Financial incentives and linking payments to outcomes are also widely promoted as methods for improving the cost-effectiveness of service delivery.21 Linking funding to patient outcomes, or at least to compliance with guidelines based on patient need, could help improve the use of inpatient rehabilitation. We also support recommendations that the Australian Commission on Safety and Quality in Health Care publish variation data at the hospital rather than the area level, and that outlier hospitals should be made aware of and encouraged to improve their relative performance.11
Limitations of our study
Data for some patient-related factors that influence rehabilitation decisions were not available, including obesity, pre-operative physical and mental health (although comorbid conditions were analysed when data were available), functional performance, physical gait aid, and home environment. Nonetheless, the dataset included a wide variety of socio-economic and health factors that are typically correlated with these factors; for example, obesity is related to comorbid conditions such as diabetes and cardiovascular disease22 and socio-economic status.23 It is therefore unlikely that the omitted patient factors would explain a substantial proportion of the interhospital variation in inpatient rehabilitation.
Large variations in inpatient rehabilitation rates after adjusting for patient-related factors suggest low value care. However, while the Australasian Rehabilitation Outcomes Centre collects data on a functional independence measure for some patients after inpatient rehabilitation, data on post-surgery outcomes for private TKR recipients that could provide more robust evidence of low value care are not routinely collected. We recommend that such information be collected, as it is in the United Kingdom.24
Finally, as a large proportion of the variation in inpatient rehabilitation rates was not explained by the hospital-, surgeon- or patient-related factors we examined, investigation of further elements is required.
Conclusion
Rates of inpatient rehabilitation after TKR are increasing in Australia at a time when they are declining overseas. Clinical outcomes evidence has consistently indicated that inpatient rehabilitation is not superior to community- and home-based rehabilitation, suggesting that health care system costs can be reduced without harming patient outcomes. Reducing low value care will require system-level changes to guidelines and incentives for hospitals, as hospital-related factors are the major driver of variation in inpatient rehabilitation practices.
Box 1 – The five linear probability regression models developed for our analysis
|
|
Model and research question |
||||||||||||||
|
1 |
2 |
3 |
4 |
5 |
|||||||||||
|
Change in rate over time |
Interhospital variation, low value care |
Contribution to variation |
|||||||||||||
|
|
|||||||||||||||
|
Explanatory variables |
|
|
|
|
|
||||||||||
|
Year |
X |
X |
|
|
|
||||||||||
|
Patient-related factors* |
|
X |
|
X |
X |
||||||||||
|
Hospital |
|
|
X |
X |
X |
||||||||||
|
Surgeon |
|
|
|
|
X |
||||||||||
|
|
|||||||||||||||
|
* Sex, age group, location of residence (remoteness), socio-economic index for areas (SEIFA) decile, ever smoker, Charlson comorbidity index, claims during previous year, acute surgery cost, lives alone flag, intensive care unit and hospital-acquired clinical complication flags (details: table 1 in the online Appendix). |
|||||||||||||||
Box 2 – Demographic information and other characteristics of 35 389 people who received Medibank-funded total knee replacements, 2009–2016
|
Patient characteristic |
No inpatient rehabilitation |
Inpatient rehabilitation |
All patients |
||||||||||||
|
2009–2016 |
2009 |
2016 |
|||||||||||||
|
|
|||||||||||||||
|
Total number of patients |
21 946 |
13 443 |
35 389 |
3870 |
4362 |
||||||||||
|
Sex (men) |
10 238 (46.7%) |
4430 (33.0%) |
14 668 (41.4%) |
1557 (40.2%) |
1836 (42.1%) |
||||||||||
|
Age (years), mean (SD) |
67.3 (8.4) |
71.0 (8.7) |
68.7 (8.7) |
68.7 (8.8) |
69.0 (8.7) |
||||||||||
|
40–49 |
355 (1.6%) |
111 (0.8%) |
466 (1.3%) |
52 (1.3%) |
63 (1.4%) |
||||||||||
|
50–59 |
3573 (16.3%) |
1245 (9.3%) |
4818 (13.6%) |
550 (14.2%) |
544 (12.5%) |
||||||||||
|
60–69 |
9212 (42.0%) |
4367 (32.5%) |
13 579 (38.4%) |
1444 (37.3%) |
1645 (37.7%) |
||||||||||
|
70–79 |
7107 (32.4%) |
5271 (39.2%) |
12 378 (35.0%) |
1375 (35.5%) |
1618 (37.1%) |
||||||||||
|
80–89 |
1699 (7.7%) |
2449 (18.2%) |
4148 (11.7%) |
449 (11.6%) |
492 (11.3%) |
||||||||||
|
Remoteness |
|
|
|
|
|
||||||||||
|
Metropolitan |
10 958 (49.9%) |
9709 (72.2%) |
20 667 (58.4%) |
2266 (58.6%) |
2617 (60.0%) |
||||||||||
|
Regional |
2979 (13.6%) |
1436 (10.7%) |
4415 (12.5%) |
525 (13.6%) |
512 (11.7%) |
||||||||||
|
Rural |
7783 (35.5%) |
2141 (15.9%) |
9924 (28.0%) |
1044 (27.0%) |
1179 (27.0%) |
||||||||||
|
Missing data |
226 (1.0%) |
157 (1.2%) |
383 (1.1%) |
35 (0.9%) |
54 (1.2%) |
||||||||||
|
Socio-economic status (IRSAD quintile) |
|
|
|
|
|
||||||||||
|
1 (most disadvantaged) |
4978 (22.7%) |
2147 (16.0%) |
7125 (20.1%) |
817 (21.1%) |
813 (18.6%) |
||||||||||
|
2 |
4588 (20.9%) |
2317 (17.2%) |
6905 (19.5%) |
751 (19.4%) |
838 (19.2%) |
||||||||||
|
3 |
4588 (20.9%) |
2449 (18.2%) |
7037 (19.9%) |
750 (19.4%) |
881 (20.2%) |
||||||||||
|
4 |
4148 (18.9%) |
2904 (21.6%) |
7052 (19.9%) |
798 (20.6%) |
909 (20.8%) |
||||||||||
|
5 (least disadvantaged) |
3419 (15.6%) |
3488 (25.9%) |
6907 (19.5%) |
726 (18.8%) |
874 (20.0%) |
||||||||||
|
Ever smoker |
225 (1.0%) |
138 (1.0%) |
363 (1.0%) |
28 (0.7%) |
47 (1.1%) |
||||||||||
|
Charlson comorbidity index |
|
|
|
|
|
||||||||||
|
0 |
15 706 (71.6%) |
8474 (63.0%) |
24 180 (68.3%) |
2750 (71.1%) |
2776 (63.6%) |
||||||||||
|
1 |
2431 (11.1%) |
1850 (13.8%) |
4281 (12.1%) |
427 (11.0%) |
570 (13.1%) |
||||||||||
|
2 or more |
3809 (17.4%) |
3119 (23.2%) |
6928 (19.6%) |
693 (17.9%) |
1016 (23.3%) |
||||||||||
|
Previous year claim expenditure |
|
|
|
|
|
||||||||||
|
$0 |
6087 (27.7%) |
3162 (23.5%) |
9249 (26.1%) |
2236 (57.8%) |
538 (12.3%) |
||||||||||
|
$1–$9999 |
10 469 (47.7%) |
5938 (44.2%) |
16 407 (46.4%) |
1407 (36.4%) |
1861 (42.7%) |
||||||||||
|
$10 000 or more |
5390 (24.6%) |
4343 (32.3%) |
9733 (27.5%) |
227 (5.9%) |
1963 (45.0%) |
||||||||||
|
Lives alone |
237 (1.1%) |
1020 (7.6%) |
1257 (3.6%) |
106 (2.7%) |
170 (3.9%) |
||||||||||
|
Admitted to intensive care unit |
638 (2.9%) |
747 (5.6%) |
1385 (3.9%) |
102 (2.6%) |
222 (5.1%) |
||||||||||
|
Hospital-acquired conditions category |
235 (1.1%) |
214 (1.6%) |
449 (1.3%) |
43 (1.1%) |
45 (1.0%) |
||||||||||
|
Acute hospital LOS (days), mean (SD) |
6.2 (1.4) |
6.2 (1.2) |
6.1 (1.2) |
7.1 (1.4) |
5.4 (1.0) |
||||||||||
|
Inpatient rehabilitation count (SD) |
NA |
13 443 (38) |
134 433 (38) |
1202 (31) |
1959 (45) |
||||||||||
|
Inpatient rehabilitation LOS, mean (SD) |
NA |
11.2 (5.2) |
11.2 (5.2) |
11.7 (5.3) |
10.7 (4.7) |
||||||||||
|
Procedures per hospital, median (IQR) |
— |
— |
106 (34–321) |
— |
— |
||||||||||
|
Procedures per surgeon, median (IQR) |
— |
— |
7 (1–36) |
— |
— |
||||||||||
|
|
|||||||||||||||
|
IQR = interquartile range; IRSAD = Index of Relative Socio-economic Advantage and Disadvantage; LOS = length of stay; NA = not applicable; SD = standard deviation. |
|||||||||||||||
Box 3 – Inpatient rehabilitation rates for 35 389 people who received Medibank-funded total knee replacements, 2009–2016*
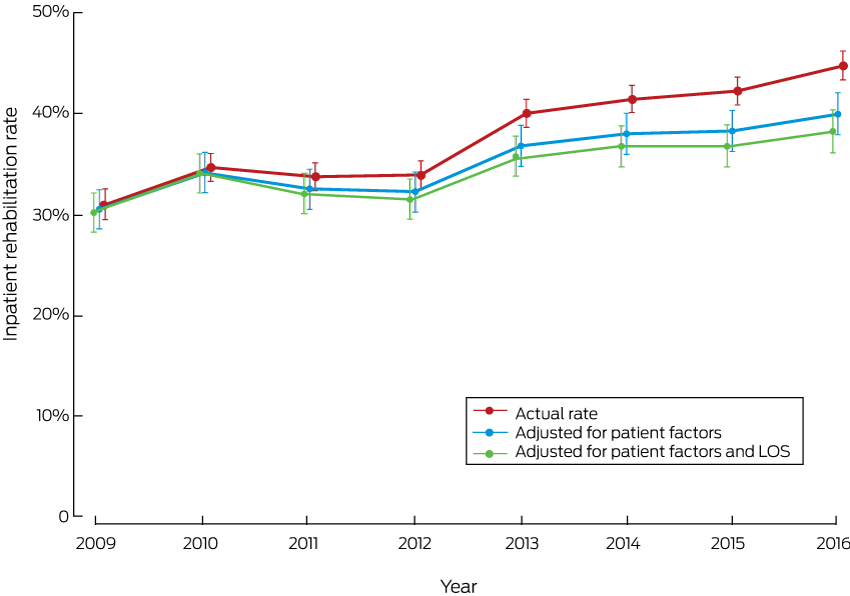
LOS = length of stay in hospital (acute admission). * Depicted are the actual rates, together with rates adjusted for patient-related factors or for patient-related factors and reduced LOS during the study period.
Box 4 – Funnel plot of hospital inpatient rehabilitation rates after total knee replacement, Australia, 2009–2016, with 95% confidence interval around the mean private hospital rate (38%)
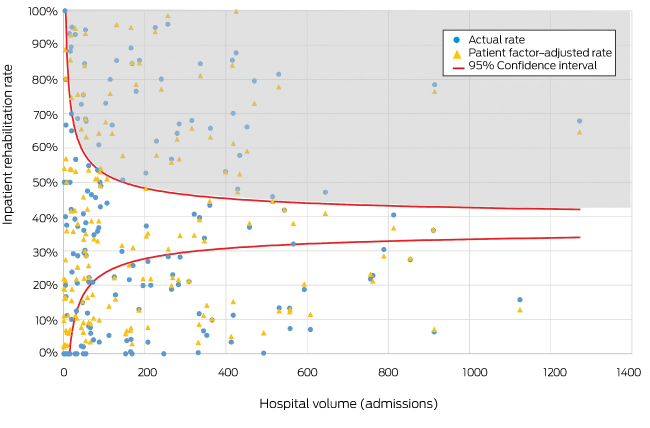
Each circle represents one hospital; each triangle indicates the inpatient rehabilitation rate after adjusting for patient-related factors. The shaded area indicates hospitals with inpatient rehabilitation rates above the upper 95% confidence limit.
Box 5 – Funnel plot of hospital inpatient rehabilitation rates after total knee replacement, Australia, 2009–2016, with 95% confidence interval around the mean public hospital rate (17%)
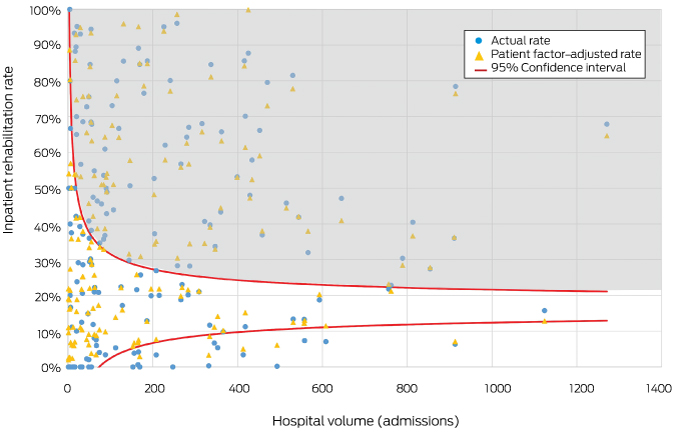
Each circle represents one hospital; each triangle indicates the inpatient rehabilitation rate after adjusting for patient-related factors. The shaded area indicates hospitals with inpatient rehabilitation rates above the upper 95% confidence limit.
Box 6 – Hospital inpatient rehabilitation rates after total knee replacement: upper outlier counts and adjusted R2 values for models 3–5
|
|
Model 3 |
Model 4 |
Model 5 |
||||||||||||
|
Unadjusted rates |
Adjusted for patient-related factors |
Adjusted for patient- and surgeon-related factors |
|||||||||||||
|
|
|||||||||||||||
|
Adjusted R2 |
0.31 |
0.38 |
0.42 |
||||||||||||
|
Upper outlier count* |
|
|
|
||||||||||||
|
Private hospital mean (38%) |
46 (27%) |
46 (27%) |
38 (22%) |
||||||||||||
|
Public hospital mean (17%) |
80 (47%) |
79 (46%) |
83 (49%) |
||||||||||||
|
|
|||||||||||||||
|
* Number of hospitals with an inpatient rehabilitation rate above the 95% confidence interval. |
|||||||||||||||
Received 11 December 2017, accepted 30 May 2018
- Chris Schilling1
- Catherine Keating2
- Anna Barker2
- Stephen F Wilson3
- Dennis Petrie4
- 1 KPMG Australia, Melbourne, VIC
- 2 Medibank Private, Melbourne, VIC
- 3 University of Sydney, Sydney, NSW
- 4 Centre for Health Economics, Monash University, Melbourne, VIC
Dennis Petrie is supported by Monash University and an Australian Research Council Discovery Early Career Researcher Award.
Catherine Keating and Anna Barker are employed by Medibank Private. Anna Barker receives salary support from Monash University. Chris Schilling is employed by KPMG and received consultancy fees from Medibank Private to undertake the analysis presented in this article. Stephen Wilson has previously received consultancy fees from Medibank Private in relation to development of rehabilitation in the home.
- 1. Organisation for Economic Co-operation and Development. Hip and knee replacement. In: Health at a glance 2015: OECD indicators. Paris: OECD, 2015; p. 112. http://www.oecd-ilibrary.org/social-issues-migration-health/health-at-a-glance-2015/hip-and-knee-replacement_health_glance-2015-36-en (viewed June 2017).
- 2. Australian Orthopaedic Association National Joint Replacement Registry. Hip, knee and shoulder arthroplasty: annual report 2016. Adelaide: AOA, 2016. https://aoanjrr.sahmri.com/annual-reports-2016 (viewed May 2017).
- 3. Private Healthcare Australia. Pre-Budget submission 2017–18. 19 Jan 2017. https://static.treasury.gov.au/uploads/sites/1/2017/06/C2016-052_Private-Healthcare-Australia.pdf (viewed Apr 2017).
- 4. Khan F, Ng L, Gonzalez S, et al. Multidisciplinary rehabilitation programmes following joint replacement at the hip and knee in chronic arthropathy. Cochrane Database Syst Rev 2008; (2): CD004957.
- 5. Royal Australasian College of Surgeons, Medibank. Surgical variance report 2017: orthopaedic surgery. 2017. https://www.surgeons.org/media/25492528/surgical-variance-reports-2017-orthopaedic-surgery.pdf (viewed May 2017).
- 6. Mahomed NN, Davis AM, Hawker G, et al. Inpatient compared with home-based rehabilitation following primary unilateral total hip or knee replacement: a randomized controlled trial. J Bone Joint Surg Am 2008; 90: 1673-1680.
- 7. Buhagiar MA, Naylor JM, Harris IA, et al. Effect of inpatient rehabilitation vs a monitored home-based program on mobility in patients with total knee arthroplasty: the HIHO randomized clinical trial. JAMA 2017; 317: 1037-1046.
- 8. Ong KL, Lotke PA, Lau E, et al. Prevalence and costs of rehabilitation and physical therapy after primary TJA. J Arthroplasty 2015; 30: 1121-1126.
- 9. Health Quality Ontario, Ministry of Health and Long-Term Care. Quality-based procedures: clinical handbook for primary hip and knee replacement. Toronto: Health Quality Ontario, 2014. http://www.hqontario.ca/Portals/0/Documents/evidence/clinical-handbooks/hip-knee-140227-en.pdf (viewed May 2017).
- 10. Barsoum WK, Murray TG, Klika AK, et al. Predicting patient discharge disposition after total joint arthroplasty in the United States. J Arthroplasty 2010; 25: 885-892.
- 11. Duckett SJ, Breadon P, Romanes D. Identifying and acting on potentially inappropriate care. Med J Aust 2015; 203: 183. <MJA full text>
- 12. Australian Bureau of Statistics. Socio-Economic Indexes for Areas 2013. Updated Mar 2018. http://www.abs.gov.au/websitedbs/censushome.nsf/home/seifa (viewed June 2018).
- 13. Charlson M, Szatrowski TP, Peterson J, Gold J. Validation of a combined comorbidity index. J Clin Epidemiol 1994; 47: 1245-1251.
- 14. Naylor J, Harris IA; ACORN Steering Committee. Arthroplasty Clinical Outcomes Registry National (ACORN) annual report: supplementary table. Sydney: Whitlam Orthopaedic Research Centre, 2017. http://www.acornregistry.org/images/2016%20ANNUAL%20REPORT%20SUPPLEMENTARY%20TABLE.pdf (viewed May 2017).
- 15. Madden RC, Wilson A, Hoyle P. Appropriateness of care: why so much variation. Med J Aust 2016; 205: 452-453. <MJA full text>
- 16. Naylor JM, Hart A, Mittal R, et al. The value of inpatient rehabilitation after uncomplicated knee arthroplasty: a propensity score analysis. Med J Aust 2017; 207: 250-255. <MJA full text>
- 17. Royal Australian College of Surgeons. Rehabilitation pathways following hip and knee arthroplasty. Final report, January 2018. Adelaide: RACP, 2018. https://www.surgeons.org/media/25621953/2018-01-29_mbp_arthroplasty_final.pdf (viewed June 2018).
- 18. Loefler A. Is inpatient rehabilitation after a routine total knee replacement justified? Med J Aust 2017; 207: 241-242. <MJA full text>
- 19. Novak EJ, Silverstein MD, Bozic KJ. The cost-effectiveness of computer-assisted navigation in total knee arthroplasty. J Bone Joint Surg Am 2007; 89: 2389-2397.
- 20. London DA, Vilensky S, O’Rourke C, et al. discharge disposition after joint replacement and the potential for cost savings: effect of hospital policies and surgeons. J Arthroplasty 2016; 31: 743-748.
- 21. Saini V, Garcia-Armesto S, Klemperer D, et al. Drivers of poor medical care. Lancet 2017; 390: 178-190.
- 22. Australian Institute of Health and Welfare. Australia’s health 2016 (AIHW Cat. No. AUS 199; Australia’s Health Series No. 15). Canberra: AIHW, 2016.
- 23. Ball K. Socioeconomic inequalities in obesity: why do they arise, and what can we do about them? [abstract] Obes Res Clin Pract 2014; 8 (Suppl 1): 5.
- 24. NHS Digital. Patient reported outcome measures (PROMs). 2017. https://digital.nhs.uk/data-and-information/data-tools-and-services/data-services/patient-reported-outcome-measures-proms (viewed June 2018).
Abstract
Objective: To investigate inpatient rehabilitation rates after private total knee replacements (TKRs) in Australia since 2009; to quantify the contributions of hospital-, surgeon- and patient-related factors to predicting inpatient rehabilitation.
Design: Retrospective cohort study; multivariate linear regression analysis of linked, de-identified Medibank administrative claims data and hospital casemix protocol data, adjusted for patient-related characteristics.
Setting, participants: 35 389 patients undergoing Medibank-funded TKRs in 170 private hospitals in Australia, 2009–2016.
Main outcome measures: Hospital inpatient rehabilitation rate; relative contributions of patient- and provider-related characteristics to variation in inpatient rehabilitation rates.
Results: The overall inpatient rehabilitation rate increased from 31% in 2009 to 45% in 2016, but varied between hospitals (range, 0–100%). The reduction in mean acute length of stay during this period explained about 15% of this increase, and about 30% was explained by patient-related factors; more than half of the increase was explained by neither reduced length of stay or patient-related factors. Patient-related characteristics explained little of the variation in rates between hospitals. Rates at 27% of hospitals lay above the 95% confidence limit for the mean inpatient rehabilitation rate in private hospitals (38%), both before and after adjusting for patient-related factors. Provider characteristics explained three times as much of the variation as patient characteristics (75% v 25%); hospital-related factors made the largest contribution to variation (47%).
Conclusion: Inpatient rehabilitation after TKR has increased in private health care during the past 8 years. Substantial variation in inpatient rehabilitation rates is not explained by patient-related factors, suggesting that some inpatient rehabilitation is low value care.