




Volume 208 - Issue 2
Salt consumption by Australian adults: a systematic review and meta-analysis
Authors: Mary-Anne Land, Bruce C Neal, Claire Johnson, Caryl A Nowson, Claire Margerison and Kristina S Petersen
Med J Aust 2018; 208 (2): 75-81. || doi: 10.5694/mja17.00394
Published online: 29 January 2018
Published online: 29 January 2018
Further action to reduce salt consumption in Australia and robust monitoring of population salt intake are needed
Abstract
Objective: Salt reduction is a public health priority because it is a leading contributor to the global burden of disease. As in Australia there is uncertainty about the current level of salt intake, we sought to estimate current levels.
Study design: Random effects meta-analysis of data from 31 published studies and one unpublished dataset that reported salt or sodium consumption by Australian adults on the basis of 24-hour urine collections or dietary questionnaires.
Data sources: MEDLINE (via Ovid) and EMBASE (to August 2016).
Data synthesis: Thirty-one published studies and one unpublished dataset (1989–2015; 16 836 individuals) were identified. The mean weighted salt consumption estimated from 24-hour urine collections was 8.70 g/day (95% CI, 8.39–9.02 g/day); after adjusting for non-urinary salt excretion, the best estimate of salt intake in Australia is 9.6 g/day. The mean weighted intake was 10.1 g/day (95% CI, 9.68–10.5 g/day) for men and 7.34 g/day (95% CI, 6.98–7.70 g/day) for women. Mean weighted consumption was 6.49 g/day (95% CI, 5.94–7.03 g/day) when measured with diet diaries, 6.76 g/day (95% CI, 5.48–8.05 g/day) when assessed with food frequency questionnaires, and 6.73 g/day (95% CI, 6.34–7.11) when assessed by dietary recall. Salt intake had not decreased between 1989 and 2015 (R2 = –0.02; P = 0.36).
Conclusion: Salt intake in Australian adults exceeds the WHO-recommended maximum of 5 g/day and does not appear to be declining. Measuring salt intake with methods based on self-reporting can substantially underestimate consumption. The data highlight the need for ongoing action to reduce salt consumption in Australia and robust monitoring of population salt intake.
Despite a steady improvement in mortality rates over the past three decades, cardiovascular disease remains the leading cause of death in Australia1 and elsewhere.2 Strong and consistent evidence indicates that a high dietary salt intake increases blood pressure, which in turn increases the risk of cardiovascular disease.3 Some observational studies have found that lower salt intake may increase all-cause mortality, but methodological flaws, including critical limitations in the measurement of salt intake, mean that their results should be interpreted with caution.4 The World Health Organization recommends a maximum salt intake of 5 g/day. However, salt intake in most countries far exceeds this level, and the global average is estimated to be 10 g/day.5 As reducing population salt intake is projected to be one of the most cost-effective strategies for reducing rates of premature death and disability attributable to high blood pressure and vascular disease,6 all WHO member states have agreed to the target of reducing the mean population salt intake by 30% by 2025.7
Surveillance is a key component of salt reduction strategies. A recent review of salt reduction in Australia found that a number of relevant activities are being implemented, but that further efforts and more robust national monitoring are required.8 To date, the only nationally representative survey of Australian adults found the average salt consumption to be 6.1 g/day in 2011–12.9 This survey was based on 24-hour dietary recall; as acknowledged by the authors of the survey, the Australian Bureau of Statistics, this approach underestimates salt intake because of incomplete reporting, a well described limitation of this method.9,10 Other methods for estimating salt intake include food frequency questionnaires (FFQs), multiple dietary recalls, and urinalysis, including spot, timed and 24-hour assessments. Measuring 24-hour urinary sodium excretion is considered the gold standard, as about 90% of ingested salt is excreted in the urine.11 However, 24-hour urine collections are burdensome for participants, and response rates are therefore typically low.12 In addition, incomplete sample collection and cost can affect the usefulness of this method; as a consequence, 24-hour urine collection is not often undertaken in large population studies.13
A number of programs for reducing dietary salt intake have been implemented in Australia, but there has been no robust assessment of national intake levels that would permit the success or failure of these programs to be quantified. To reliably estimate mean population salt consumption by Australian adults, we therefore undertook a systematic review and meta-analysis of the available data.
Methods
Search strategy
A systematic search of peer-reviewed publications identified articles that reported salt or sodium consumption by Australian adults (at least 18 years old) on the basis of 24-hour urine collections or dietary questionnaires. Relevant articles published before August 2016 were identified by searching MEDLINE via Ovid and EMBASE, combining the search words “sodium” or “salt”, “Australia”, and “intake”, “ingest*”, “eat*”, “consum*”, “diet*”, “urin*” or “excret*”. Reference lists from identified articles were scanned to identify further relevant articles. Australian dietary experts were also consulted to identify research not found by our literature search.
Inclusion and exclusion criteria
Included studies reported mean or median salt or sodium consumption by Australian adults. For intervention studies, we included only the baseline intake data. If both urinary analysis and dietary methods were reported for a study, all results were included in the review. Articles were not excluded because of language, age, sex, study design (including representativeness of the sample), or sample size.
Data extraction
Data for the following study characteristics were extracted from each article: population type, salt intake assessment method, sample size, sex, mean age, mean body mass index (BMI), study location, and mean salt intake (with standard deviation [SD]). If sodium intake (mg/day) was reported, it was converted to salt (g/day) by dividing by 1000 and multiplying by 2.54 (the ratio of the molecular weight of sodium chloride [58.44] to the atomic weight of sodium [23.0]). Titles and abstracts of retrieved articles were independently evaluated by two investigators (MAL, CJ), who were not blinded to authors, institutions, or manuscript journals. If an abstract did not provide adequate information about inclusion and exclusion criteria, the full text was independently evaluated to determine study eligibility. Disagreements were resolved by consensus and, if disagreement persisted, by a third reviewer (KSP). To avoid possible double-counting of patients included in more than one report by the same authors or working groups, patient characteristics and study recruitment dates were evaluated; if necessary, authors were contacted for clarification. Corresponding authors were also contacted to obtain data not included in their published report.
Outcomes
The primary analyses were of salt intake estimated on the basis of 24-hour urine collections. Subgroup analyses assessed differences in salt intake by sex and population type. In addition, the associations between salt intake and age, publication date, and BMI were investigated. Secondary analyses determined mean salt consumption on the basis of estimates derived from dietary assessments.
Data analysis
In the primary and secondary analyses, mean salt intake (with 95% confidence interval [CI]) was estimated using inverse variance random effects meta-analysis. If a study reported salt intake estimates based on 24-hour urine collection as well as dietary methods, the results of 24-hour urine collections were included in the primary analyses, and data for both methods were included in the subgroup analysis of measurement method. For the subgroup analysis by sex, studies that reported salt intake data by sex were pooled to provide salt intake estimates for males and females separately. Studies that did not provide salt intake data by sex were pooled and reported as mixed sex estimates. The proportion of variability attributable to heterogeneity between studies rather than sampling error was expressed as the I2 statistic. The t2 value quantified between-study variance and was used to weight studies in the random effects model. To explore sources of heterogeneity, subgroup analyses of method of salt intake measurement, sex, and health status were undertaken. Random effects meta-regression was performed to determine the relationship between salt intake and mean BMI, mean cohort age, and year of publication. Sensitivity analyses determined whether removal of an individual study altered the estimated mean intake. Statistical analysis was completed in Stata 13 (StataCorp); P < 0.05 was deemed statistically significant.
Results
Data from 31 published studies (including the ABS survey) and one unpublished set of data were included in the meta-analysis (Box 1, Box 2). Salt intake estimates were based on 24-hour urine collections in 26 studies (including 12 that also used dietary questionnaires or diaries), on FFQs in six studies, dietary recall in six studies, and on dietary diaries in eight. The 32 studies were conducted between 1989 and 2015, and included random or volunteer general population samples, or populations with specific disease states, such as hypertension, metabolic syndrome, and types 1 and 2 diabetes.
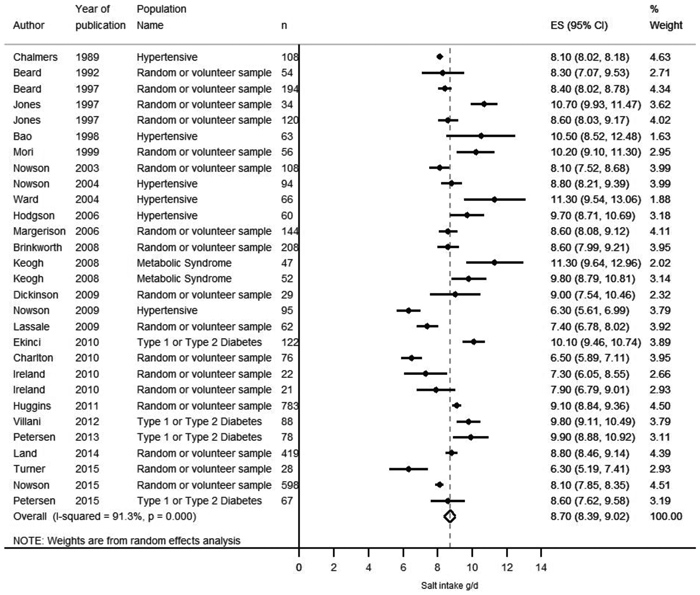
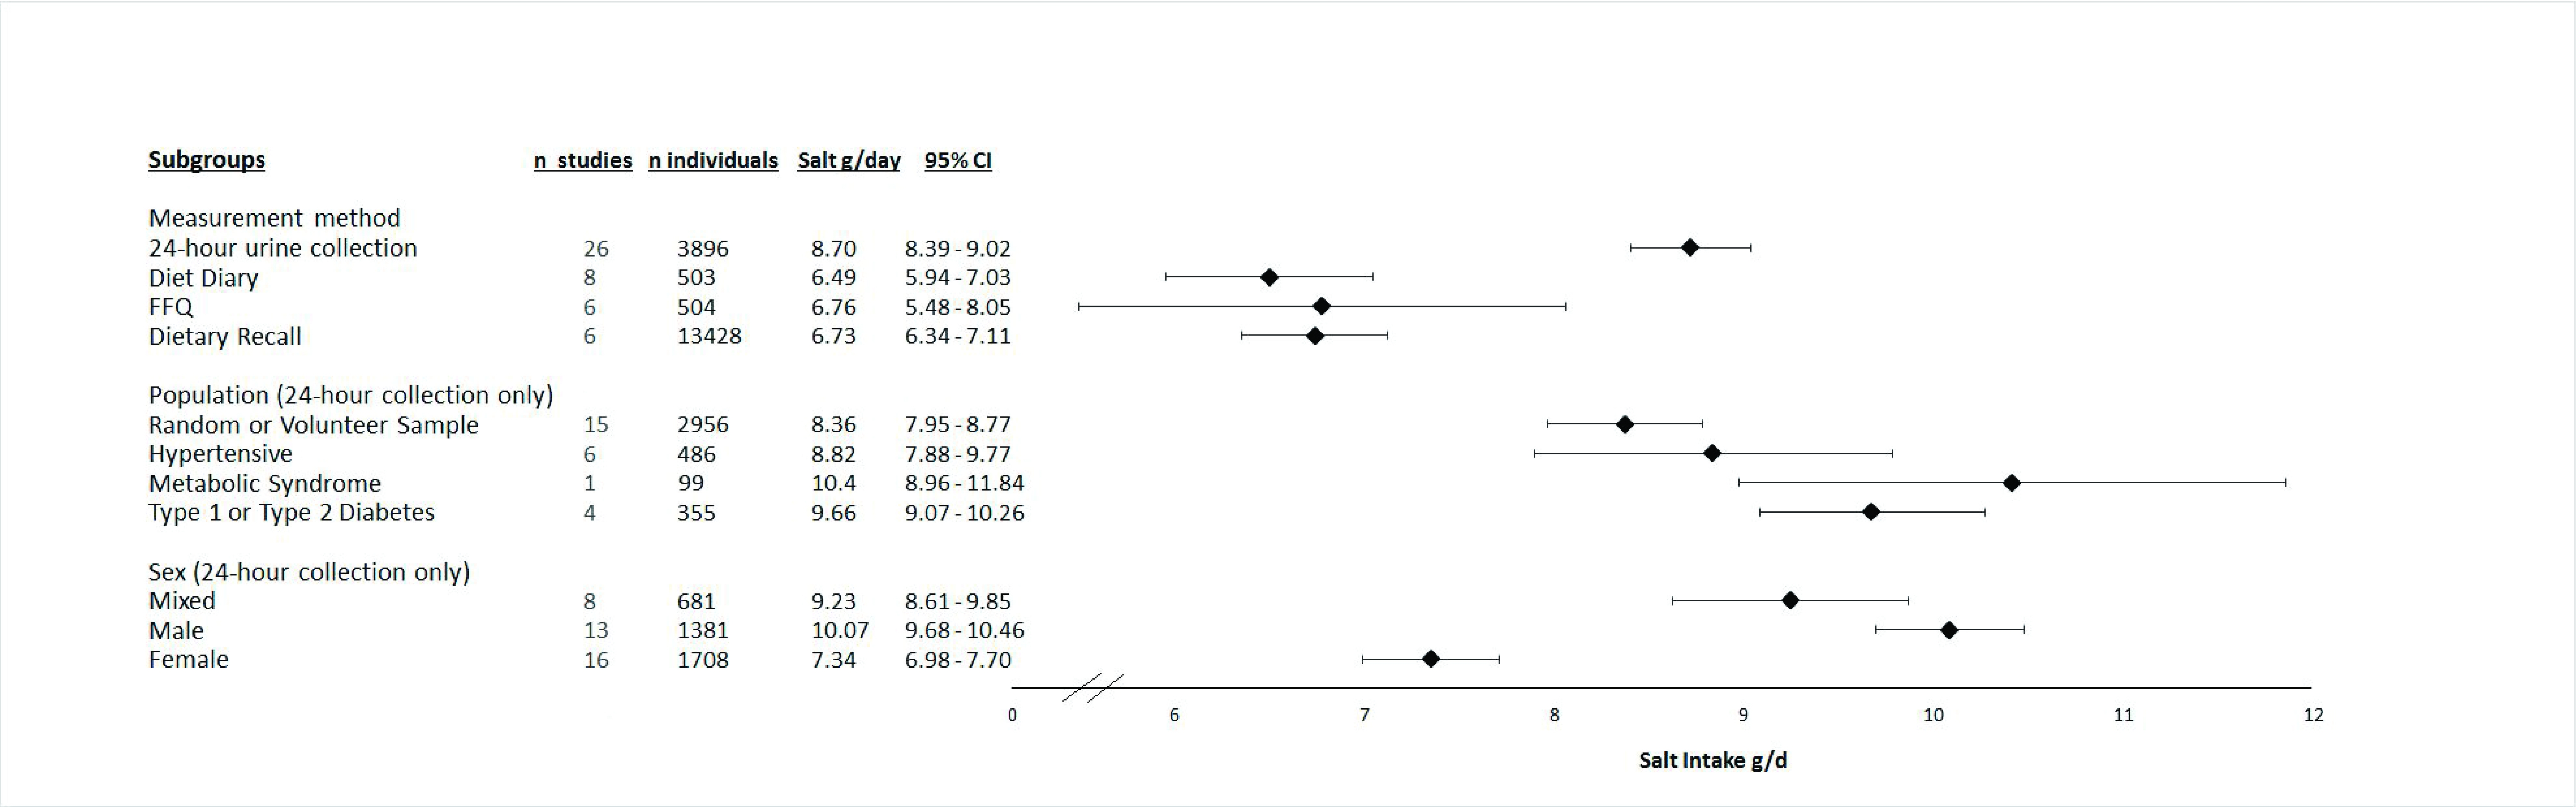
The 24-hour urine collection datasets included salt intake data for 3896 individuals. The mean weighted salt intake was 8.70 g/day (95% CI, 8.39–9.02 g/day; t2 = 0.55; I2 = 91% [P < 0.001]) (Box 3). Inflation of salt intake by 10% to account for non-urinary sodium excretion45 provides a best estimate of daily salt intake of 9.6 g/day. Removing each study individually did not substantially alter the estimate. The mean weighted intake for men (13 studies16,17,19,25,26,31,33,35,36,38,39,42,43, 1381 men) was 10.1 g/day (95% CI, 9.68–10.5 g/day; t2 = 0.32; I2 = 72% [P < 0.001]); for women (16 studies16,17,25,26,29-33,35,36,38,39,41-43, 1708 women) it was 7.34 g/day (95% CI, 6.98–7.70 g/day; t2 = 0.40; I2 = 82% [P < 0.001]) (Box 4).
For random or volunteer populations (15 studies15-17,19,21,25,26,28,30,32,33,35,39,41,42, 2956 individuals), the weighted mean salt intake was 8.36 g/day (95% CI, 7.95–8.77 g/day; t2 = 0.58; I2 = 89% [P < 0.001]). For people with hypertension (six studies14,18,22-24,29, 486 individuals) it was 8.82 g/day (95% CI, 7.88–9.77 g/day; t2 = 1.11; I2 = 92% [P < 0.001]), for those with type 1 or 2 diabetes (four studies31,36,38,43, 355 individuals) it was 9.66 g/day (95% CI, 9.07–10.3 g/day; t2 = 0.20; I2 = 54% [P = 0.09]), and for people with metabolic syndrome (one study27, 99 individuals) it was 10.4 g/day (95% CI, 8.96–11.8 g/day; t2 = 0.64; I2 = 56.5% [P = 0.13]) (Box 4).
The secondary analyses indicated that salt intake was 6.49 g/day (95% CI, 5.94–7.03 g/day; t2 = 0.55; I2 = 87% [P < 0.001]) when intake was measured with a diet diary (eight studies18-20,30,32,36,41,43, 503 individuals), 6.76 g/day (95% CI, 5.48–8.05g/day; t2 = 2.5; I2 = 97% [P < 0.001]) when measured with an FFQ (six studies20,30,34,40,43,44, 504 individuals), and 6.73 g/day (95% CI, 6.34-7.11 g/day; t2 = 0.21; I2 = 86% [P < 0.001]) when 24-hour recall was used (six studies25,33,37-39,42, 13 428 individuals) (Box 4).
Meta-regression found that salt intake estimated from 24-hour urine collections was significantly correlated with BMI (R2 = 0.35; P = 0.008), but not with mean age of the sample cohort (R2 = –0.02; P = 0.36) or with year of publication (R2 = –0.02; P = 0.36), indicating that population salt intake has not decreased across the study period (online Appendix).
Discussion
We found that the average salt consumption by Australian adults is well above the recommended maximum of 5 g/day. While estimates of salt intake varied according to the method for measuring consumption, all exceeded the WHO-recommended maximum. Our best estimate of 9.6 g salt per day, based on 24-hour urine collections and corrected for non-urinary sodium loss, is almost double the recommended limit. The mean weighted intake was 10.1 g/day for men and 7.3 g/day for women; this sex difference was anticipated, given the generally lower energy intake among women. These data reinforce the need for salt reduction strategies in Australia.
Reducing population salt intake has been on the health agenda in Australia for many years, but the impact of the strategies employed has been unclear because intake has not been monitored at the population level.8 The 2011–12 Australian Health Survey has been the only attempt to assess salt intake in a large representative sample of the population, albeit on the basis of 24-hour dietary recall. In our meta-analysis, we found no relationship between publication date and salt intake level, suggesting there has been no change in consumption since 1989. However, our analysis of change over time is limited by the data available, which are not based on repeat representative samples of the population; it is therefore possible that temporal changes in salt intake have been missed.
Although there was significant variation in the estimates of salt intake by studies that based their assessments on 24-hour urine collections, even the lower end of the prediction interval (mean ± 2 × SD)46 — 7.2–12.9 g/day — exceeds the WHO-recommended maximum. Salt intake in Australia is therefore almost certainly too high and needs to be reduced. The heterogeneity of study results was not unexpected, given the differences in sample characteristics, methods used to measure salt intake, and study designs. Salt intake varies significantly with characteristics such as age, BMI, and disease state,12 and meta-analyses of aggregated data cannot effectively control for such factors. Our meta-regression analysis found a relationship between salt intake and BMI, consistent with the recognised relationship between energy intake and salt intake, but not between salt intake and age.
Estimates of salt intake on the basis of assessment methods other than 24-hour urine collections were substantially lower: estimates based on diet diaries (2.2 g/day lower), FFQs (1.9 g/day lower), and dietary recall (2.0 g/day lower) were all below the estimate based on urinalysis. This is consistent with research that has documented under-reporting of total dietary intake, and consequently of salt intake, in dietary surveys.10 The accuracy of the assumed average values of salt content of processed and home-cooked foods and discretionary salt use also pose challenges that are difficult to overcome. The results of our meta-analysis suggest that when dietary methods are the primary basis for estimating salt intake in a study, 24-hour urine samples of a subsample of participants should be assessed to enable calibration of results. Further, our results highlight the need for careful interpretation of results gained with different methods for assessing salt intake.
A 2015 review found that most salt reduction campaigns in Australia have been led by non-government organisations, and that there is a need for stronger government intervention.8 One of the key federal government initiatives was the Food and Health Dialogue, introduced in 2009, which included voluntary salt reduction targets for several food categories. These targets resulted in minor reductions in the sodium content of breads (reduced by 39 mg/100 g, or 9%), ready-to-eat breakfast cereals (by 79 mg/100 g, or 25%) and processed meats (by 101 mg/100 g, or 8%).47 The Food and Health Dialogue has now been replaced by the Healthy Food Partnership, and it is unclear what the objectives of this initiative will be. However, the results of our meta-analysis indicate that salt reduction should remain a priority.
Modelling suggests that if sodium intake in Australia and New Zealand were reduced by 10% over 10 years by a national program, about 11 000 disability-adjusted life-years linked to cardiovascular disease could be averted each year.48 One of the most successful salt reduction strategies was implemented in the United Kingdom. Key components included determining and monitoring population salt intake, setting population salt intake targets, reducing the salt content of the food supply by setting progressively lower targets for various food categories, and moving industry to reformulate food products so that they contained less salt.47 In response to this action, salt intake in the UK decreased from 9.5 g/day in 2001 to 8.6 g/day in 2008, and to 8.1 g/day in 2011, an overall 15% reduction.49 It has been estimated that this campaign cost £15 million to implement, but there were 9000 fewer cardiovascular deaths and £1.5 billion saved each year as a result of the strategy.50
In Australia, a community-based intervention in a rural population showed that reducing population salt intake was possible (by 0.8 g/day between 2011 and 2014) with a multi-faceted approach that included education, community engagement, a smartphone application, provision of a salt substitute, and advertising.51 However, it is unlikely that a program of this type could be implemented nationally, and alternative approaches will be required.
Our meta-analysis is the first step to estimating population salt consumption in Australia by integrating all the relevant data that have been collected. While it was a novel investigation, our analyses were limited by the significant heterogeneity of the studies, most of which had small sample sizes. In addition, some studies included individuals with hypertension, diabetes or metabolic syndrome, and it is possible that some individuals changed their salt consumption after being diagnosed with such conditions, although estimates of salt intake were comparable across the subgroups included. In addition, most studies applied criteria for excluding incomplete 24-hour urine collections or implausible dietary intake data, and these criteria differed between studies.
Conclusion
Our systematic review and meta-analysis found that salt consumption by Australian adults probably exceeds the WHO-recommended maximum of 5 g/day, re-affirming the need for action to reduce salt intake in Australia. Our results also highlight the need for systematic, standardised and repeated assessments of a national sample of the population in order to determine whether salt reduction programs are achieving the target of a 30% reduction in intake by 2025.7
Box 1 – Preferred Reporting Items for Systematic Reviews and Meta-analyses (PRISMA) flow diagram for the selection of publications included in our analysis
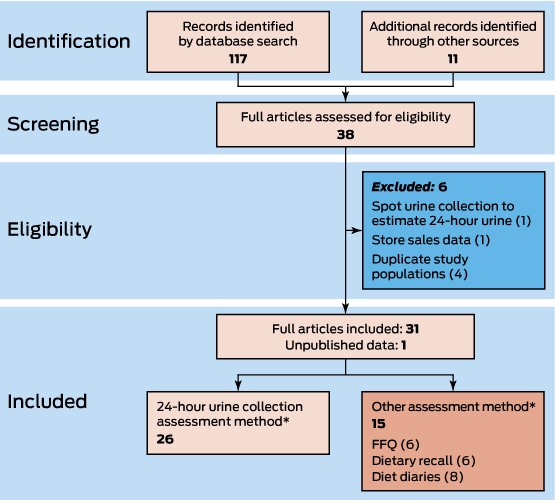
FFQ = food frequency questionnaires. * More than one method was employed in some studies.
Box 2 – The investigations of the salt intake of Australian adults, 1989–2015, included in our meta-analysis
|
Study |
State, year* |
Method of assessment |
Population |
n |
Men |
Mean age (years) |
Mean BMI (kg/m2) |
Mean salt intake (SD), g/day |
|||||||
|
All |
Men |
Women |
|||||||||||||
|
|
|||||||||||||||
|
NHMRC DSSMC14 |
NSW, 1989 |
24 h urine |
Diastolic blood pressure 90–100 mmHg |
108 |
83% |
58.4 |
— |
8.1 (0.4) |
— |
— |
|||||
|
Beard15 |
Tas, 1992 |
24 h urine |
Random sample |
54 |
41% |
49 |
— |
8.3 (4.6)† |
— |
— |
|||||
|
Beard16 |
Tas, 1997 |
24 h urine |
Random sample |
194 |
45% |
[range, 18–70] |
— |
8.4 (2.7) |
9.9 (3.0) |
6.9 (2.5) |
|||||
|
Jones17 |
Tas, 1997 |
24 h urine |
Random and volunteer sample |
154 |
22% |
46.9 |
— |
— |
10.7 (2.3)† |
8.6 (3.2)† |
|||||
|
Bao18 |
WA, 1998 |
24 h urine |
Overweight non-smoking men and postmenopausal women, taking antihypertensive medication (= 3 months) |
63 |
67% |
51.1 |
31.6 |
10.5 (8.0)† |
— |
— |
|||||
|
3-day diet diary |
7.7 (6.3)† |
— |
— |
||||||||||||
|
Mori19 |
WA, 1999 |
24 h urine |
Mildly hyperlipidaemic volunteers |
56 |
100% |
48.8 |
28.8 |
10.2 (4.2)† |
10.2 (4.2)† |
— |
|||||
|
3-day diet diary |
8.6 (0.6)† |
8.6 (0.6)† |
— |
||||||||||||
|
Hodge20 |
Vic, 2000 |
7-day diet diary |
Iron deficient volunteers |
63 |
0 |
33.3 |
— |
5.9 (1.4) |
|
5.9 (1.4) |
|||||
|
FFQ |
5.4 (1.6) |
|
5.4 (1.6) |
||||||||||||
|
Nowson21 |
Vic, 2003 |
24 h urine |
Twins (normotensive and hypertensive) |
108 |
41% |
47 |
26.1 |
8.1 (3.1) |
— |
— |
|||||
|
Nowson22 |
Vic, 2004 |
24 h urine |
Treated hypertensive and normotensive volunteers |
94 |
60% |
55.6 |
29.0 |
8.8 (2.9) |
— |
— |
|||||
|
Ward23 |
WA, 2004 |
24 h urine |
Untreated hypertensive and normotensive volunteers |
66 |
56% |
54.1 |
26.7 |
11.3 (7.5)† |
— |
— |
|||||
|
Hodgson24 |
WA, 2006 |
24 h urine |
Hypertensive volunteers |
60 |
63% |
58.5 |
27.7 |
9.7 (3.9) |
— |
— |
|||||
|
Margerison25 |
Vic, 2006 |
24 h urine |
Healthy volunteers |
144 |
55% |
55.2 |
29.2 |
8.6 (3.2) |
9.9 (2.8) |
7.0 (2.9) |
|||||
|
24 h dietary recall |
8.0 (3.3) |
6.2 (0.9) |
|||||||||||||
|
Brinkworth26 |
SA, 2008 |
24 h urine |
Overweight and obese volunteers |
208 |
33% |
52.4 |
33.6 |
8.6 (4.5)† |
10.6 (5.5)† |
7.9 (3.6)† |
|||||
|
Keogh27 |
SA, 2008 |
24 h urine |
Overweight and obese volunteers with at least one additional risk factor for metabolic syndrome |
99 |
— |
50 |
33.7 |
11.3 (5.8) |
— |
— |
|||||
|
Dickinson28 |
SA, 2009 |
24 h urine |
Overweight and obese volunteers |
29 |
24% |
52.7 |
31.6 |
9.0 (4.0) |
— |
— |
|||||
|
Nowson29 |
Vic, 2009 |
24 h urine |
Post-menopausal women with normal to high blood pressure |
95 |
0 |
59.2 |
29.6 |
6.3 (3.4)† |
— |
6.3 (3.4)† |
|||||
|
Lassale30 |
SA, 2009 |
24 h urine |
Healthy volunteers |
62 |
0 |
49.2 |
27.6 |
7.4 (2.5) |
— |
7.4 (2.5) |
|||||
|
4-day diet diary |
6.3 (1.7) |
— |
6.0 (1.7) |
||||||||||||
|
FFQ |
7.6 (3.0) |
— |
7.6 (3.0) |
||||||||||||
|
Ekinci31 |
Vic, 2010 |
24 h urine |
Patients with type 2 diabetes attending an outpatient clinic |
122 |
52% |
68.6 |
30.4 |
10.1 (3.6) |
9.9 (3.1) |
8.3 (3.0) |
|||||
|
Charlton32 |
NSW, 2010 |
24 h urine |
Healthy volunteers |
76 |
0 |
38.3 |
24.0 |
6.5 (2.7) |
— |
6.5 (2.7) |
|||||
|
3-day diet diary |
6.9 (4.4) |
— |
6.9 (4.4) |
||||||||||||
|
Ireland33 |
SA, 2010 |
24 h urine |
Healthy volunteers‡ |
43 |
23% |
56 |
— |
7.3 (3.0) |
7.2 (3.8) |
6.9 (3.0) |
|||||
|
24-hour dietary recall |
— |
8.7 (3.9) |
7.0 (4.2) |
||||||||||||
|
Keogh34 |
SA, 2010 |
FFQ 1 |
Healthy volunteers |
159 |
100% |
55 |
27.4 |
9.4 (3.4)† |
9.4 (3.4)† |
— |
|||||
|
FFQ 2 |
7.8 (3.2)† |
7.8 (3.2)† |
— |
||||||||||||
|
Huggins35 |
Vic, 2011 |
24 h urine |
Random sample |
783 |
48% |
64 |
28.4 |
9.1 (3.7)† |
10.4 (3.8)† |
7.8 (2.9)† |
|||||
|
Villani36 |
SA, 2012 |
24 h urine |
Overweight and obese volunteers with type 2 diabetes |
88 |
59% |
Men, 61.9 |
Men, 34.5 |
9.8 (3.3) |
11.4 (4.4) |
8.4 (2.4) |
|||||
|
4-day diet diary |
— |
7.2 (1.6) |
5.8 (1.3) |
||||||||||||
|
ABS [Australian Health Survey]37 |
All, 2011–2012 |
24-hour dietary recall |
Random sample |
12 153 |
47% |
40 |
25.7 |
6.0 (3.4) |
6.8 (3.8) |
5.2 (2.9) |
|||||
|
Petersen38 |
SA, 2013 |
24 h urine |
Volunteers with type 2 diabetes |
78 |
63% |
63 |
34.1 |
9.9 (4.6) |
11.0 (4.4) |
7.4 (3.6) |
|||||
|
24-hour dietary recall |
7.0 (3.2) |
7.3 (2.7) |
6.3 (2.7) |
||||||||||||
|
Land39 |
NSW, 2014 |
24 h urine |
Random and volunteer sampling |
419 |
45% |
55 |
29.3 |
8.8 (3.6) |
10.2 (3.7) |
7.6 (3.0) |
|||||
|
Land (unpublished data) |
|
24-hour dietary recall |
|
412 |
44% |
|
|
6.5 (2.9) |
7.5 (3.1) |
5.6 (2.4) |
|||||
|
Blanch40 |
SA, 2014 |
FFQ |
Healthy volunteers |
35 |
26% |
31 |
21.7 |
5.6 (2.1) |
— |
— |
|||||
|
Turner41 |
SA, 2015 |
24 h urine |
Volunteers with coeliac disease |
28 |
0 |
51 |
25 |
6.3 (3.0) |
— |
6.3 (3.0) |
|||||
|
3-day diet diary |
5.0 (1.7) |
— |
5.0 (1.7) |
||||||||||||
|
Nowson42 |
Vic, 2015 |
24 h urine |
Random sample |
598 |
46% |
57 |
26.6 |
8.1 (3.1) |
9.2 (2.6) |
6.7 (2.7) |
|||||
|
24-hour dietary recall |
6.8 (3.1)† |
6.1 (3.2)† |
7.7 (3.3)† |
||||||||||||
|
Petersen43 |
SA, 2015 |
24 h urine |
Volunteers with type 1 and type 2 diabetes |
67 |
57% |
56 |
31 |
8.6 (4.1) |
9.0 (4.0) |
8.1 (4.2) |
|||||
|
3-day diet diary |
6.3 (2.9) |
7.0 (3.2) |
5.3 (2.2) |
||||||||||||
|
FFQ |
6.2 (2.5) |
6.4 (2.3) |
6.0 (2.8) |
||||||||||||
|
Petersen44 |
SA, 2015 |
FFQ |
Volunteers with type 1 and type 2 diabetes |
118 |
63% |
57.5 |
32.6 |
6.4 (2.9) |
7.2 (3.1) |
5.1 (1.7) |
|||||
|
|
|||||||||||||||
|
ABS = Australian Bureau of Statistics. FFQ = food frequency questionnaire; NHMRC DSSMC = Australian National Health and Medical Research Council Dietary Salt Study Management Committee; — = not reported. * Year of publication. † Standard deviations calculated for meta-analysis. ‡ Two parallel groups of participants were followed in this study; the salt intake of each was reported separately. |
|||||||||||||||
Competing interests
No relevant disclosures.
Acknowledgements
Bruce Neal is supported by a National Health and Medical Research Council (NHMRC) Principal Research Fellowship. He holds an NHMRC Centre for Research Excellence grant (APP1117300) and an NHMRC program grant (APP1052555).
References
- Australian Institute of Health and Welfare. Cardiovascular disease: Australian facts 2011 (AIHW Cat. No. CVD 53). Canberra: AIHW, 2001.
- Lozano R, Naghavi M, Foreman K, et al. Global and regional mortality from 235 causes of death for 20 age groups in 1990 and 2010: a systematic analysis for the Global Burden of Disease Study 2010. Lancet 2012; 380: 2095-2128.
- Micha R, Penalvo JL, Cudhea F, et al. Association between dietary factors and mortality from heart disease, stroke, and type 2 diabetes in the United States. JAMA 2017; 317: 912-924.
- Neal B, Land MA, Woodward M. An update on the salt wars — genuine controversy, poor science, or vested interest? Curr Hypertens Rep 2013; 15: 687-693.
- Mozaffarian D, Fahimi S, Singh GM, et al. Global sodium consumption and death from cardiovascular causes. N Engl J Med 2014; 371: 624-634.
- Asaria P, Chisholm D, Mathers C, et al. Chronic disease prevention: health effects and financial costs of strategies to reduce salt intake and control tobacco use. Lancet 2007; 370: 2044-2045.
- World Health Organization. Global status report on noncommunicable diseases 2014. Geneva: WHO, 2014. http://apps.who.int/iris/bitstream/10665/148114/1/9789241564854_eng.pdf?ua=1 (viewed Nov 2017).
- Webster J, Trieu K, Dunford E, et al. Salt reduction in Australia: from advocacy to action. Cardiovasc Diagn Ther 2015; 5: 207-218.
- Australian Bureau of Statistics. 4364.0.55.007. Australian Health Survey: nutrition first results — food and nutrients, 2011–12. May 2014. http://www.abs.gov.au/AUSSTATS/abs@.nsf/Lookup/4364.0.55.007Main+Features12011-12?OpenDocument (viewed Nov 2017).
- Freedman LS, Commins JM, Moler JE, et al. Pooled results from 5 validation studies of dietary self-report instruments using recovery biomarkers for potassium and sodium intake. Am J Epidemiol 2015; 181: 473-487.
- Rhodes DG, Murayi T, Clemens JC, et al. The USDA automated multiple-pass method accurately assesses population sodium intakes. Am J Clin Nutr 2013; 97: 958-964.
- Brown IJ, Tzoulaki I, Candeias V, Elliott P. Salt intakes around the world: implications for public health. Int J Epidemiol 2009; 38: 791-813.
- Ji C, Sykes L, Paul C, et al. Systematic review of studies comparing 24-hour and spot urine collections for estimating population salt intake. Rev Panam Salud Publica 2012; 32: 307-315.
- Australian National Health and Medical Research Council Dietary Salt Study Management Committee. Fall in blood pressure with modest reduction in dietary salt intake in mild hypertension. Lancet 1989; 1: 399-402.
- Beard TC, Eickhoff R, Mejglo ZA, et al. Population-based survey of human sodium and potassium excretion. Clin Exp Pharmacol Physiol 1992; 19: 327-330.
- Beard TC, Woodward DR, Ball PJ, et al. The Hobart Salt Study 1995: few meet national sodium intake target. Med J Aust 1997; 166: 404-407.
- Jones G, Beard T, Parameswaran V, et al. A population-based study of the relationship between salt intake, bone resorption and bone mass. Eur J Clin Nutr 1997; 51: 561-565.
- Bao DQ, Mori TA, Burke V, et al. Effects of dietary fish and weight reduction on ambulatory blood pressure in overweight hypertensives. Hypertension 1998; 32: 710-717.
- Mori TA, Bao DQ, Burke V, et al. Docosahexaenoic acid but not eicosapentaenoic acid lowers ambulatory blood pressure and heart rate in humans. Hypertension 1999; 34: 253-260.
- Hodge A, Patterson AJ, Brown WJ, et al. The Anti Cancer Council of Victoria FFQ: relative validity of nutrient intakes compared with weighed food records in young to middle-aged women in a study of iron supplementation. Aust N Z J Public Health 2000; 24: 576-583.
- Nowson CA, Morgan TO, Gibbons C. Decreasing dietary sodium while following a self-selected potassium-rich diet reduces blood pressure. J Nutr 2003; 133: 4118-4123.
- Nowson CA, Worsley A, Margerison C, et al. Blood pressure response to dietary modifications in free-living individuals. J Nutr 2004; 134: 2322-2329.
- Ward NC, Rivera J, Hodgson J, et al. Urinary 20-hydroxyeicosatetraenoic acid is associated with endothelial dysfunction in humans. Circulation 2004; 110: 438-443.
- Hodgson JM, Burke V, Beilin LJ, Puddey IB. Partial substitution of carbohydrate intake with protein intake from lean red meat lowers blood pressure in hypertensive persons. Am J Clin Nutr 2006; 83: 780-787.
- Margerison C, Nowson CA. Dietary intake and 24-hour excretion of sodium and potassium. Asia Pac J Clin Nutr 2006; 15(Suppl 3): S37.
- Brinkworth GD, Wycherley TP, Noakes M, Clifton PM. Reductions in blood pressure following energy restriction for weight loss do not rebound after re-establishment of energy balance in overweight and obese subjects. Clin Exp Hypertens 2008; 30: 385-396.
- Keogh JB, Brinkworth GD, Noakes M, et al. Effects of weight loss from a very-low-carbohydrate diet on endothelial function and markers of cardiovascular disease risk in subjects with abdominal obesity. Am J Clin Nutr 2008; 87: 567-576.
- Dickinson KM, Keogh JB, Clifton PM. Effects of a low-salt diet on flow-mediated dilatation in humans. Am J Clin Nutr 2009; 89: 485-490.
- Nowson CA, Wattanapenpaiboon N, Pachett A. Low-sodium dietary approaches to stop hypertension-type diet including lean red meat lowers blood pressure in postmenopausal women. Nutr Res 2009; 29: 8-18.
- Lassale C, Guilbert C, Keogh J, et al. Estimating food intakes in Australia: validation of the Commonwealth Scientific and Industrial Research Organisation (CSIRO) food frequency questionnaire against weighed dietary intakes. J Hum Nutr Diet 2009; 22: 559-566.
- Ekinci EI, Cheong KY, Dobson M, et al. High sodium and low potassium intake in patients with type 2 diabetes. Diabetic Med 2010; 27: 1401-1408.
- Charlton K, Yeatman H, Houweling F, Guenon S. Urinary sodium excretion, dietary sources of sodium intake and knowledge and practices around salt use in a group of healthy Australian women. Aust N Z J Public Health 2010; 34: 356-363.
- Ireland DM, Clifton PM, Keogh JB. Achieving the salt intake target of 6 g/day in the current food supply in free-living adults using two dietary education strategies. J Am Diet Assoc 2010; 110: 763-767.
- Keogh JB, Lange K, Syrette J. Comparative analysis of two FFQ. Public Health Nutr 2010; 13: 1553-1558.
- Huggins CE, O’Reilly S, Brinkman M, et al. Relationship of urinary sodium and sodium-to-potassium ratio to blood pressure in older adults in Australia. Med J Aust 2011; 195: 128-132.
- Villani AM, Clifton PM, Keogh JB. Sodium intake and excretion in individuals with type 2 diabetes mellitus: a cross-sectional analysis of overweight and obese males and females in Australia. J Hum Nutr Diet 2012; 25: 129-139.
- Australian Bureau of Statistics. 4364.0.55.007. Australian Health Survey: nutrition first results — food and nutrients, 2011–12. Table 1: Mean daily energy and nutrient intake. May 2014. http://www.abs.gov.au/ausstats/subscriber.nsf/log?openagent&Table%201%20Mean%20daily%20energy%20and%20nutrient%20intake.xls&4364.0.55.007&Data%20Cubes&C53378E733B57D2CCA257CD200146C93&0&2011-12&09.05.2014&Latest (viewed Nov 2017).
- Petersen KS, Torpy DJ, Chapman IM, et al. Food label education does not reduce sodium intake in people with type 2 diabetes mellitus: a randomised controlled trial. Appetite 2013; 68: 147-151.
- Land MA, Webster J, Christoforou A, et al. Salt intake assessed by 24 h urinary sodium excretion in a random and opportunistic sample in Australia. BMJ Open 2014; 4: e003720.
- Blanch N, Clifton PM, Petersen KS, et al. Effect of high potassium diet on endothelial function. Nutr Metab Cardiovasc Dis 2014; 24: 983-989.
- Turner KM, Clifton PM, Keogh JB. Sodium and potassium excretion are related to bone mineral density in women with coeliac disease. Clin Nutr 2015; 34: 265-268.
- Nowson C, Lim K, Grimes C, et al. Dietary salt intake and discretionary salt use in two general population samples in Australia: 2011 and 2014. Nutrients 2015; 7: 10501-10512.
- Petersen KS, Smith JM, Clifton PM, Keogh JB. Dietary intake in adults with type 1 and type 2 diabetes: validation of the Dietary Questionnaire for Epidemiological Studies version 2 FFQ against a 3-d weighed food record and 24-h urinalysis. Br J Nutr 2015; 114: 2056-2063.
- Petersen KS, Clifton PM, Blanch N, Keogh JB. Effect of improving dietary quality on carotid intima media thickness in subjects with type 1 and type 2 diabetes: a 12-mo randomized controlled trial. Am J Clin Nutr 2015; 102: 771-779.
- Lerchl K, Rakova N, Dahlmann A, et al. Agreement between 24-hour salt ingestion and sodium excretion in a controlled environment. Hypertension 2015; 66: 850-857.
- Borenstein M, Higgins J, Hedges LV, Rothstein HR. Basics of meta-analysis: I2 is not an absolute measure of heterogeneity. Res Synth Methods 2017; 8: 5-18.
- Trevena H, Neal B, Dunford E, Wu J. An evaluation of the effects of the Australian Food and Health Dialogue targets on the sodium content of bread, breakfast cereals and processed meats. Nutrients 2014; 6: 3802-3817.
- Webb M, Fahimi S, Singh GM, et al. Cost effectiveness of a government supported policy strategy to decrease sodium intake: global analysis across 183 nations. BMJ 2017; 356: i6699.
- Sadler K, Nicholson S, Steer T, et al. National Diet and Nutrition Survey: assessment of dietary sodium levels among adults (aged 19–64) in England, 2011. London: Department of Health, 2012. https://www.gov.uk/government/uploads/system/uploads/attachment_data/file/213420/Sodium-Survey-England-2011_Text_to-DH_FINAL1.pdf (viewed Nov 2017).
- He FJ, Brinsden HC, MacGregor GA. Salt reduction in the United Kingdom: a successful experiment in public health. J Hum Hypertens 2014; 28: 345-352.
- Land MA, Wu JH, Selwyn A, et al. Effects of a community-based salt reduction program in a regional Australian population. BMC Public Health 2016; 16: 388.
Linked content
-
MJA InSight: Salt intake reduction: life-saving and cost-effective
-
MJA Podcast: Professor Bruce Neal
Provenance: Not commissioned; externally peer reviewed.
Fatty Liver Disease in Australia: A Narrative Review on the Epidemiology, Natural History, Prognostication and Management in People With Metabolic Dysfunction
Karl Vaz, Daniel Clayton-Chubb, William W. Kemp, Stuart K. Roberts, Ammar Majeed
Sex Differences in Management and Outcomes of People With ST-Elevation Myocardial Infarction, New South Wales, 2011–2020: A Retrospective Cohort Study
Adam C. Livori, Jedidiah I. Morton, Dianna J. Magliano, Jonathan E. Shaw
Rethinking Rheumatic Fever Diagnosis: Progress, Pitfalls and the Path Towards a Definitive Test
Anna P. Ralph, Rachel Webb, Tom Parks, Nicole J. Moreland, Asha C. Bowen, Benjamin Jones, Emma Ndagire, Andrea Z. Beaton
Sex Differences in Management and Outcomes of People With ST-Elevation Myocardial Infarction, New South Wales, 2011–2020: A Retrospective Cohort Study
Samia Kazi, Simone Marschner, Clara K. Chow
Distribution of Cardiovascular Disease Risk Based on the Updated 2023 Guideline-Recommended Australian Cardiovascular Disease Risk Algorithm and Comparison With the 2012 Algorithm: An Observational Study
Nina Lazarevic, Meghana Bhat, Grace Joshy, Danielle C. Butler, Mark Woodward, Anushka Patel, Rod T. Jackson, Garry Jennings, Rosemary Wyber, Ellie Paige, Emily Banks
They Brought the Hospital to Me
Hugh N. Burrill