


The known Methicillin-resistant Staphylococcus aureus (MRSA) is isolated from outpatients in Australia with increasing frequency, including a high proportion of non-multi-resistant MRSA strains.
The new In northeastern NSW, MRSA was predominantly isolated from patients who had not been hospitalised in the past year. Community-associated MRSA was more frequently isolated from younger people, Indigenous Australians, and residents of aged care facilities. The prevalence of multi-resistant S. aureus strains decreased between 2008 and 2014; more sensitive MRSA strains are now responsible for most infections in community and health care settings.
The implications The focus of infection control measures should shift to the community setting, including enhanced surveillance and better targeted antimicrobial therapy.
Staphylococcus aureus is a common cause of serious community- and health care-associated infection. In Australia, methicillin-susceptible S. aureus (MSSA) strains are persistently carried by about one-quarter of the adult population, while a much lower proportion (0.7–2.2%) carry methicillin-resistant S. aureus (MRSA).1,2 Despite this low carriage rate, about 20% of S. aureus bacteraemia events in Australia in 2015 were caused by MRSA.3 The all-cause 30-day mortality of bacteraemic staphylococcal infections is significant, and is higher for MRSA than MSSA infections;4 limited antimicrobial treatment options for MRSA infections make their management challenging.
The epidemiology of MRSA is changing in Australia, as are patterns of antibiotic resistance. Until the early 2000s, MRSA infections were predominately health care-associated. Recent studies have found increasing rates of community origin MRSA infections.5,6 A national biannual survey of S. aureus isolates documented an increase in the proportion of S. aureus from outpatients identified as MRSA, from 11.5% in 2000 to 17.9% in 2012.7 During the same period, the dominant multi-resistant MRSA strain was replaced by a broad range of non-multi-resistant clones.5,7 This increase in community-based MRSA infections has implications for control measures and empiric treatment options.
Longitudinal studies of MRSA in Australia are limited by the lack of data on recent hospitalisation as a potential explanation of infection. The United States Centers for Disease Control and Prevention (CDC) classify MRSA infections into three categories according to health care and aged care exposures during the past year.8 As most Australian longitudinal studies rely on laboratory data alone, community-associated infections have been classified by inpatient status or genotyping. However, the available hospitalisation data indicate that more than 35% of outpatients with MRSA infections had been hospitalised during the previous year, and that non-multi-resistant, community-associated MRSA clones accounted for more than 50% of MRSA infections of inpatients.5
The Hunter New England Local Health District (HNELHD) has a patient information management system that allows laboratory data to be linked with health care exposure data, essential for understanding the epidemiology of MRSA. We analysed these data with the aim of identifying groups at risk of MRSA infection, patterns of antimicrobial resistance, and the proportion of patients with MRSA infections but no history of recent hospitalisation.
Methods
This study was conducted across the HNELHD in northeastern New South Wales. The HNELHD includes a major metropolitan centre and a number of regional communities, with an estimated resident population (2014) of 903 099.9
Our case definition included all individuals providing specimens processed by Pathology North from which S. aureus was isolated during 1 January 2008 – 31 December 2014. Pathology North is a public pathology provider that services 34 of 38 hospitals in the HNELHD; many general practitioners in the region also use Pathology North. Data were also requested from private pathology providers in the region, but were not supplied.
For each case, the time and date of specimen collection, specimen type and site, and antimicrobial susceptibility data were available and linked with data in the HNELHD patient information management system (iSoft Patient Manager [iPM]) according to HNELHD medical record number and specimen date. iPM provided details on the most recent admission to an HNELHD facility, the Indigenous status of the patient, and their residential address on the specimen collection date. iPM does not contain private hospital admissions data. The geographic status of the residential address was classified according to 2011 Australian Statistical Geographical Standards Remoteness Area (RA) levels; postcodes were matched to RA level using the geographic correspondence of the Australian Bureau of Statistics.10 The addresses of aged care facilities in the region were linked with patient addresses; dialysis status was determined by linkage of the medical record number with data provided by the HNELHD dialysis unit.
MRSA infections were classified into three epidemiologic categories according to hospitalisation in a HNELHD facility, reflecting the classification by the CDC Active Bacterial Core Surveillance.8 In the absence of genotyping data, MRSA was also classified according to four antibiogram (antibiotic susceptibility) phenotypes used in previous Australian studies5 (Box 1). Inducible clindamycin resistance was not routinely assessed in this study, given the variation in testing between laboratories.
As recommended by the Clinical and Laboratory Standards Institute,11 only the first positive isolate of either MSSA or MRSA from a patient was included in our analysis. Screening specimens, identified by either specimen type or site (eg, nasal, perineum), were excluded.
Analysis was performed in Stata 14 (StataCorp). The significance of differences between groups was assessed in χ2 or Wilcoxon–Mann tests, as appropriate. Changes in proportions across the study period were assessed in a χ2 test for trend. Linear regression analysis of the rates of hospital-onset (HO) MRSA infections per 10 000 inpatient bed-days employed denominator data provided by the HNELHD information unit. Demographic factors associated with community-associated (CA) MRSA infections were analysed by logistic regression; their association with isolation of MRSA was examined by univariate logistic regression before including them in the multivariate model.
Ethics approval
Approval for the study was provided by the HNELHD Human Research Ethics Committee (reference, LNR/12/HNE/574).
Results
Pathology and iPM data were matched 1:1 by medical record number and date, with no records unmatched; 104 duplicate pathology records were deleted after review. A total of 81 133 positive S. aureus isolates were recorded during the study period; 9397 (11.6%) identified as screening specimens were excluded from analysis. The remaining 71 736 S. aureus isolates were from 39 231 people; both MSSA and MRSA were cultured from 1592 individuals.
The median age of the study sample was 45.8 years (interquartile range, 20.5–71.1 years); 54.1% were men (95% confidence interval [CI], 53.6–54.6%). Indigenous Australians constituted 9.9% (95% CI, 9.6–10.2%) of the sample, but only 5.6% of the HNELHD population.9
The median age of people infected with MRSA was significantly lower than for those infected with MSSA (35.8 v 47.8 years; P < 0.001); on the other hand, the proportion of MRSA isolates among those from residents of aged care facilities was higher than for the general population (36.8% v 18.6%). The proportion of MRSA isolates was also higher among Indigenous than non-Indigenous Australians (36.4% v 17.5%) (Box 2).
MRSA infections: patient characteristics
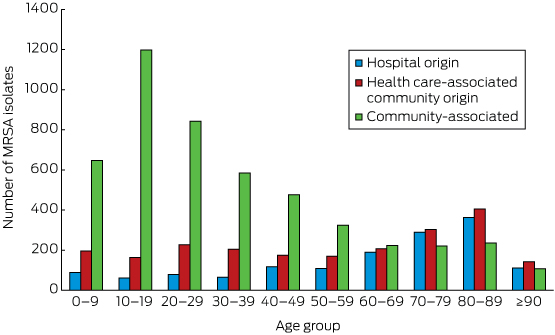
CA-MRSA accounted for 4850 of 8519 first positive MRSA isolates (56.9%; 95% CI, 55.9–58.0%). The age distribution of patients with CA-MRSA isolates differed markedly from those for HO- and health care-associated community origin (HACO) MRSA infections, with CA-MRSA predominating in those under 60 years of age (Box 3). The median age of people with CA-MRSA was significantly lower than for those with health care-associated (HCA) MRSA (ie, HO- and HACO-MRSA combined: 26.1 v 65.2 years; P < 0.001). The proportion of S. aureus isolates that were CA-MRSA was higher among Indigenous Australians (1064 of 1518, 70.1%) than non-Indigenous Australians (3737 of 6938, 53.7%; P < 0.001), as well as among people from rural areas (RA2–5: 3222 of 5542, 58.1%) compared with those from metropolitan areas (RA1: 1580 of 2912, 54.3%; P = 0.001).
MRSA infections: antimicrobial susceptibility
Antimicrobial susceptibility test results are summarised in Box 4. The differences in susceptibility between CA- and HCA-MRSA isolates were highly significant for all agents. Different panels of antimicrobial agents were employed for susceptibility testing at the two main laboratory sites. Testing uniformity improved over time, with the proportion of specimens tested for five or more non-β-lactam antimicrobial agents increasing from 67.7% (929 of 1372) in 2009 to 93.3% (898 of 963) in 2014 (P < 0.001). Data for gentamicin susceptibility were missing more frequently than for other agents (Box 4), but most such isolates were susceptible to all other non-β-lactam antimicrobial agents (1108 of 1489, 74.4%; 95% CI, 72.1–76.6%). Other non-multi-resistant phenotypes accounted for more than 50% of both CA- and HCA-MRSA first positive specimens (Box 5). The differences between CA- and HCA-MRSA isolates with regard to antibiogram phenotypes were highly significant for all phenotypes.
Among residents of aged care facilities, the frequency of EMRSA-15-like CA-MRSA isolates was markedly higher than for the general population (80 of 184, 44% v 260 of 461, 85.6%; P < 0.001). The highest proportion of other non-multi-resistant CA-MRSA isolates was in residents of major cities (1368 of 1580, 86.6% for RA1 v 2482 of 3222, 77.0% for RA2–5; P < 0.001).
Demographic factors of patients with community-associated MRSA infections
First positive S. aureus isolates were obtained from 23 220 patients who had not been hospitalised or received dialysis in HNELHD facilities during the previous 12 months (59.2% of all patients), of which 4593 (19.8%; 95% CI 19.3–20.3%) provided CA-MRSA isolates. There was significant seasonal variation in CA-MRSA infections, with higher proportions during summer and autumn. Multivariate analysis indicated that being younger age (under 40), Indigenous, or a resident in an aged care facility were each independently associated with an S. aureus isolate being MRSA (Box 6).
Stratified analysis found no significant association of age and CA-MRSA among residents of aged care facilities (data not shown).
Temporal trends in MRSA infections
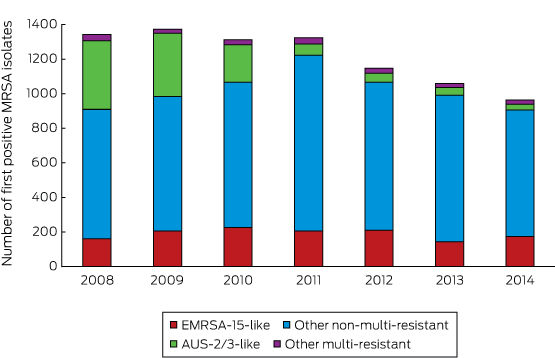
The number of first positive MRSA isolates decreased across the study period (Box 7), and the proportion of MRSA isolates declined significantly, from 22.8% (1372 of 6012) in 2009 to 17.8% (963 of 5401) in 2014 (P < 0.001). This was largely explained by the decrease in the numbers of both CA and HCA AUS-2/3-like MRSA isolates, from 397 of 1342 (29.6%) to 33 of 963 (3.4%; P < 0.001) across the study period. Among Indigenous people, the proportion of specimens that were AUS-2/3-like decreased from 40.4% (108 of 267) to 0 (0 of 167) (P < 0.001).
Hospital-onset MRSA infections
Five of six regional hospitals reported HO-MRSA rates at the end of the study period of two to three positive isolates per 10 000 bed-days. Three facilities reported declines across the study period. Linear regression identified significant rate reductions at two sites, the John Hunter Hospital (coefficient, –0.3 [95% CI, –0.5 to –0.1] isolates per 10 000 bed-days per year; R2 = 0.831; P = 0.007) and Tamworth Hospital (coefficient, –0.9 [95% CI, –1.6 to –0.3] isolates per 10 000 bed-days per year; R2 = 0.805; P = 0.02).
Discussion
We found that most MRSA infections in the HNELHD are now acquired in the community, and that young people, Indigenous Australians, and residents of aged care facilities are disproportionally affected by CA-MRSA infections (Box 6). Fewer than half the patients with MRSA isolates had been hospitalised during the preceding 12 months, and more than one-third of S. aureus isolates from residents of aged care facilities were MRSA (Box 2).
The prevalence of multi-resistant MRSA decreased significantly across the study period, and non-multi-resistant MRSA phenotypes predominated in both community and health care settings. EMRSA-15-like strains predominated in CA-MRSA isolates from people in aged care facilities, and the highest proportion of non-multi-resistant phenotypes was for CA-MRSA isolates from patients in major metropolitan areas.
Our findings reflect progress in reducing HO-MRSA rates, with MRSA isolation rates declining in the two largest hospitals. Reduced HO-MRSA rates have been documented elsewhere in Australia and attributed, in part, to the national hand hygiene initiative.12 Further control measures for limiting MRSA infections in HNELHD facilities include intensive care unit and pre-operation patient screening, with inpatient isolation of known carriers and contact precautions. Current health care control strategies appear to have been effective and may have contributed to the reduced presence of the AUS-2/3-like phenotype in the community, as community MRSA prevalence is correlated with its hospital prevalence.13 Our results suggest that, to reduce the prevalence of non-multi-resistant phenotypes, the focus of control measures should move from the health care setting to the community.
Antimicrobial resistance is increasingly recognised as a threat to global health;14 in response, Australia developed its first National Antimicrobial Resistance Strategy,15 one of the objectives of which is effective antimicrobial stewardship. Antimicrobial stewardship programs are required by current Australian hospital accreditation standards.16 In Scotland, restrictive antimicrobial agent guidelines, introduced in 2009, have been associated with further decreases in MRSA prevalence, by 54% in hospitals and 37% in the community.13 The evidence from Scotland and our study support recent calls to extend stewardship to aged care facilities and general practice settings.17
Coordinated surveillance is another component of the national strategy, and our study identified strengths and weaknesses of passive surveillance of MRSA. By linking pathology and hospital administration datasets, we were able to obtain relatively complete demographic information, including Indigenous status. Our data enabled classification of MRSA according to modified CDC criteria in a large longitudinal study. These criteria are of increasing importance, as non-multi-resistant MRSA phenotypes predominate in health care-associated infections, so that the origin of an infection can no longer be deduced from antimicrobial susceptibility or genotyping alone.
Our study was limited by the absence of interpretive clinical information; our data may therefore include S. aureus isolates unrelated to a clinically significant infection. Although screening specimens were excluded, it is likely that some isolates reflected colonisation rather than infection, and this may have affected our conclusions regarding the proportion of S. aureus isolates that was methicillin-resistant and the predominant MRSA phenotypes.
Our findings are also limited by the absence of data from private sector pathology services used by general practitioners in the Hunter New England region, potentially introducing a selection bias that could reduce the counts of CA-MRSA and non-multi-resistant phenotypes. Conversely, the absence of private hospital admissions data differentially affects health care-associated MRSA estimates, as isolates may have been incorrectly categorised as community-associated. While it is difficult to assess the impact of these biases, it is likely that people of higher socio-economic status were under-represented and patients from rural areas, where access to private pathology and hospitals are limited, were over-represented in our sample. However, the groups we identified as being at risk for CA-MRSA infection are less likely to have been admitted to private hospitals and thereby misclassified. It is clear that sharing data across the private and public sectors is required if we are to better understand the epidemiology of MRSA.
We used antimicrobial susceptibility phenotypes rather than genotyping to classify MRSA clones, as it is the most practical method for studying a large sample, and relevant data were readily available. While the phenotypes applied have shown high sensitivity and specificity for the equivalent genotypes in an Australian setting,5 the results were affected by variations in susceptibility testing. Improved national surveillance would require MRSA to be tested against a standardised panel of antimicrobial agents.
Our findings add to understanding of the characteristics of patients with CA-MRSA and non-multi-resistant MRSA infections in Australia. While a number of Australian studies have highlighted higher rates of CA-MRSA infections among Indigenous Australians,5,18 they did not find the higher MRSA rates among younger patients we describe. Previous studies have been restricted to smaller case–control studies, predominantly in major teaching hospitals, whereas our large sample included all remoteness areas. We also identified residents of aged care facilities as a high risk group, particularly for EMRSA-15-like infections, as also found in other regions of Australia.19 Similarly, our finding that EMRSA-15-like MRSA is now the most prevalent health care-associated clone (26.9% of health care-associated MRSA v 17.1% for AUS-2/3-like clones) is consistent with other recent reports for NSW and Australia.3
The identification of populations at high risk for CA-MRSA infection in the HNELHD has implications for managing MRSA in the region, possibly including amending treatment guidelines. Among Indigenous Australians and residents of aged care facilities, about one-third of S. aureus isolates were MRSA. Earlier Australian studies found that antimicrobial agents were inappropriately prescribed for 47% of non-multi-resistant MRSA infections.18 While incision and drainage is the first line treatment for abscesses,20 co-trimoxazole may be the most appropriate empiric therapy when antimicrobial agents are required (unless sepsis is present, in which case intravenous vancomycin should be prescribed20), especially for Indigenous patients. A recent study in Indigenous communities in the Northern Territory found that co-trimoxazole is as effective as conventional treatment for skin and soft tissue infections from which Streptococcus pyogenes or S. aureus are cultured.21 In our study, 98.5% of CA-MRSA infections were treatable with co-trimoxazole.
MRSA is an important community problem in the HNELHD. To meet the challenges of CA-MRSA, expanding infection control and antimicrobial stewardship measures beyond the hospital system is needed. National surveillance of MRSA is increasingly urgent, enabling reliable data from both public and private pathology providers to be collected and targeted and generalised control strategies to be identified and evaluated.
Box 1 – Epidemiologic categories of methicillin-resistant Staphylococcus aureus (MRSA) infections, and antibiogram phenotypes
|
|
|||||||||||||||
|
Epidemiologic categories
|
|||||||||||||||
|
|
|||||||||||||||
|
* Our definition of HACO differs from that of the Centers for Disease Control and Prevention because we did not have data on the presence of central vascular catheters. Further, we did not classify residential aged care facilities as health care facilities, given the lower level of medical care provided by aged care facilities in the Hunter New England Local Health District than in the United States. |
|||||||||||||||
Box 2 – Demographic data for patients with first positive isolates of methicillin-sensitive (MSSA) or methicillin-resistant Staphylococcus aureus (MRSA), Hunter New England Local Health District, 2008–2014
|
|
MSSA |
MRSA |
P |
||||||||||||
|
|
|||||||||||||||
|
Number of individuals providing first positive S. aureus isolates* |
31 668 (80.7%) |
7563 (19.3%) |
|
||||||||||||
|
Age (years), median (IQR) |
47.8 (21.6–71.7) |
35.8 (17.9–67.3) |
< 0.001 |
||||||||||||
|
Sex |
|
|
0.031 |
||||||||||||
|
Men |
17 043 (80.3%) |
4174 (19.7%) |
|
||||||||||||
|
Women |
14 625 (81.2%) |
3389 (18.8%) |
|
||||||||||||
|
Indigenous status |
|
|
< 0.001 |
||||||||||||
|
Aboriginal and/or Torres Strait Islander |
2447 (63.6%) |
1400 (36.4%) |
|
||||||||||||
|
Neither |
28 852 (82.5%) |
6102 (17.5%) |
|
||||||||||||
|
Not stated |
369 (85.8%) |
61 (14.2%) |
|
||||||||||||
|
Resident of an aged care facility |
|
|
< 0.001 |
||||||||||||
|
Yes |
840 (63.2%) |
490 (36.8%) |
|
||||||||||||
|
No |
30 649 (81.4%) |
7012 (18.6%) |
|
||||||||||||
|
Missing address |
179 (74.6%) |
61 (25.4%) |
|
||||||||||||
|
Remoteness area (RA) classification |
|
|
0.20 |
||||||||||||
|
Major cities (RA1) |
11 146 (81.1%) |
2602 (18.9%) |
|
||||||||||||
|
Rural (RA2–5) |
20 343 (80.6%) |
4900 (19.4%) |
|
||||||||||||
|
Missing address |
179 (74.6%) |
61 (25.4%) |
|
||||||||||||
|
Hospital admission in the past 12 months |
|
|
|
||||||||||||
|
Admission |
13 013 (81.4%) |
2970 (18.6%) |
0.004 |
||||||||||||
|
No admission |
18 655 (80.2%) |
4593 (19.8%) |
|
||||||||||||
|
|
|||||||||||||||
|
IQR = interquartile range. * Patients from whom who both MSSA and MRSA were isolated during the study period are categorised according to the organism that was isolated first. |
|||||||||||||||
Box 3 – Epidemiological categorisation of first positive isolates of methicillin-resistant Staphylococcus aureus (MRSA), Hunter New England Local Health District, New South Wales, 2008–2014, by age group
Box 4 – Susceptibility to non-β-lactam antimicrobial agents of first positive isolates of methicillin-resistant Staphylococcus aureus (MRSA), Hunter New England Local Health District, 2008–2014
|
Antimicrobial agent |
Not tested |
Community-associated MRSA |
Health care-associated MRSA |
P |
|||||||||||
|
|
|||||||||||||||
|
Total number of isolates |
|
4850 |
3669 |
|
|||||||||||
|
Ciprofloxacin |
387 |
4228/4673 (90.5%) |
2023/3459 (58.5%) |
< 0.001 |
|||||||||||
|
Co-trimoxazole |
282 |
4629/4700 (98.5%) |
3184/3537 (90.0%) |
< 0.001 |
|||||||||||
|
Erythromycin |
213 |
3616/4802 (75.3%) |
1793/3504 (51.2%) |
< 0.001 |
|||||||||||
|
Fusidic acid |
1335 |
3948/4075 (96.9%) |
2935/3109 (94.4%) |
< 0.001 |
|||||||||||
|
Gentamicin |
1489 |
3889/3968 (98.0%) |
2700/3062 (88.2%) |
< 0.001 |
|||||||||||
|
Rifampicin |
1226 |
4122/4137 (99.6%) |
3123/3156 (99.0%) |
< 0.001 |
|||||||||||
|
Tetracycline |
130 |
4270/4804 (88.9%) |
3077/3585 (85.8%) |
< 0.001 |
|||||||||||
|
|
|||||||||||||||
|
|
|||||||||||||||
Box 5 – Antibiogram phenotypes for first positive isolates of methicillin-resistant Staphylococcus aureus (MRSA), Hunter New England Local Health District, 2008–2014
|
|
Community-associated MRSA |
Health care-associated MRSA |
P |
||||||||||||
|
|
|||||||||||||||
|
Total number of isolates |
4850 |
3669 |
|
||||||||||||
|
EMRSA-15-like |
342 (7.1%) |
986 (26.9%) |
< 0.001 |
||||||||||||
|
Other non-multi-resistant |
3888 (80.2%) |
1933 (52.7%) |
< 0.001 |
||||||||||||
|
AUS-2/3-like |
546 (11.3%) |
627 (17.1%) |
< 0.001 |
||||||||||||
|
Other multi-resistant |
74 (1.5%) |
123 (3.4%) |
< 0.001 |
||||||||||||
|
|
|||||||||||||||
|
|
|||||||||||||||
Box 6 – Association of variables with isolation of methicillin-resistant Staphylococcus aureus (MRSA) from 23 220 patients who had not been admitted to hospital or undergone dialysis in Hunter New England Local Health District facilities during the previous 12 months, Hunter New England Local Health District, 2008–2014
|
|
Number of individuals |
MRSA* |
Crude OR (95% CI) |
P |
Adjusted OR (95% CI) |
P |
|||||||||
|
|
|||||||||||||||
|
Number of people |
23 220 |
4593 (19.8%) |
|
|
|
|
|||||||||
|
Sex |
|
|
|
|
|
|
|||||||||
|
Women |
10 469 |
1973 (18.8%) |
1 |
|
1 |
|
|||||||||
|
Men |
12 751 |
2620 (20.5%) |
1.11 (1.04–1.19) |
0.001 |
1.15 (1.08–1.23) |
< 0.001 |
|||||||||
|
Age (years) |
|||||||||||||||
|
< 20 |
6946 |
1765 (25.4%) |
1 |
|
1 |
|
|||||||||
|
20–39 |
5565 |
1380 (24.8%) |
0.96 (0.89–1.05) |
0.43 |
1.06 (0.97–1.16) |
0.16 |
|||||||||
|
40–59 |
4677 |
765 (16.4%) |
0.57 (0.52–0.63) |
< 0.001 |
0.65 (0.59–0.72) |
< 0.001 |
|||||||||
|
60–79 |
3803 |
398 (10.5%) |
0.34 (0.31–0.39) |
< 0.001 |
0.38 (0.33–0.43) |
< 0.001 |
|||||||||
|
≥ 80 |
2229 |
285 (12.8%) |
0.43 (0.38–0.49) |
< 0.001 |
0.39 (0.34–0.46) |
< 0.001 |
|||||||||
|
Indigenous status (missing data: 410) |
|||||||||||||||
|
Non-Indigenous |
20 244 |
3529 (17.4%) |
1 |
|
1 |
|
|||||||||
|
Indigenous |
2566 |
1006 (39.2%) |
3.05 (2.80–3.33) |
< 0.001 |
2.55 (2.33–2.80) |
< 0.001 |
|||||||||
|
Resident of an aged care facility (missing data: 177) |
|||||||||||||||
|
No |
22 576 |
4393 (19.5%) |
1 |
|
1 |
|
|||||||||
|
Yes |
467 |
153 (32.8%) |
2.02 (1.66–2.45) |
<0.001 |
4.68 (3.75–5.84) |
< 0.001 |
|||||||||
|
Remoteness area (RA) classification (missing data: 177) |
|||||||||||||||
|
Major city (RA1) |
8115 |
1517 (18.7%) |
1 |
|
1 |
|
|||||||||
|
Regional/remote (RA2–5) |
14 928 |
3029 (20.3%) |
1.11 (1.03–1.19) |
0.004 |
1.04 (0.97–1.12) |
0.23 |
|||||||||
|
Season |
|||||||||||||||
|
Winter |
4992 |
899 (18.0%) |
1 |
|
1 |
|
|||||||||
|
Spring |
4960 |
936 (18.9%) |
1.06 (0.96–1.17) |
0.27 |
1.06 (0.95–1.18) |
0.28 |
|||||||||
|
Summer |
6861 |
1411 (20.6%) |
1.18 (1.07–1.29) |
0.001 |
1.11 (1.01–1.22) |
0.032 |
|||||||||
|
Autumn |
6407 |
1347 (21.0%) |
1.21 (1.10–1.33) |
< 0.001 |
1.16 (1.05–1.27) |
0.004 |
|||||||||
|
|
|||||||||||||||
|
CI = confidence interval; OR = odds ratio. * Patients from whom both methicillin-susceptible and methicillin-resistant Staphylococcus aureus and MRSA were isolated during the study period were categorised by the organism that was isolated first. |
|||||||||||||||
Received 30 January 2017, accepted 4 May 2017
- Jason W Agostino1
- John K Ferguson2,3,4
- Keith Eastwood5
- Martyn D Kirk6
- 1 Australian National University Medical School, Australian National University, Canberra, ACT
- 2 John Hunter Hospital, Newcastle, NSW
- 3 University of Newcastle, Newcastle, NSW
- 4 NSW Health Pathology, Newcastle, NSW
- 5 Hunter New England Health, Newcastle, NSW
- 6 National Centre for Epidemiology and Population Health, Australian National University, Canberra, ACT
No relevant disclosures.
- 1. Brennan L, Lilliebridge RA, Cheng AC, et al. Community-associated methicillin-resistant Staphylococcus aureus carriage in hospitalized patients in tropical northern Australia. J Hosp Infect 2013; 83: 205-211.
- 2. Munckhof WJ, Nimmo GR, Schooneveldt JM, et al. Nasal carriage of Staphylococcus aureus, including community-associated methicillin-resistant strains, in Queensland adults. Clin Microbiol Infect 2009; 15: 149-155.
- 3. Coombs G, Daley D. Australian Staphylococcal Sepsis Outcome Program (ASSOP) 2015: final report. Perth: Australian Group on Antimicrobial Resistance, 2016. http://www.agargroup.org/files/July.2016.ASSOP%202015%20Final%20Report%202016%20(1).pdf (accessed Mar 2017).
- 4. Coombs GW, Daley DA, Thin Lee Y, et al. Australian Group on Antimicrobial Resistance Australian Staphylococcus aureus Sepsis Outcome Programme annual report, 2014. Commun Dis Intell Q Rep 2016; 40: E244-E254.
- 5. Nimmo GR, Bergh H, Nakos J, et al. Replacement of healthcare-associated MRSA by community-associated MRSA in Queensland: confirmation by genotyping. J Infect 2013; 67: 439-447.
- 6. Tong SY, Varrone L, Chatfield MD, et al. Progressive increase in community-associated methicillin-resistant Staphylococcus aureus in Indigenous populations in northern Australia from 1993 to 2012. Epidemiol Infect 2015; 143: 1519-1523.
- 7. Daley D, Coombs G, Nimmo G, et al. Staphylococcus aureus programme 2012. Community survey: antimicrobial susceptibility report. Australian Group on Antimicrobial Resistance (AGAR), 2013. http://www.agargroup.org/files/Staphylococcus%20aureus%20Programme%202012%20Susceptibility%20Report.pdf (accessed Mar 2017).
- 8. Centers for Disease Control and Prevention. Methicillin-resistant Staphylococcus aureus, 2011 [Active Bacterial Core surveillance report]. Nov 2012. https://www.cdc.gov/abcs/reports-findings/survreports/mrsa11.pdf (accessed Jan 2017).
- 9. New South Wales Health. Healthstats NSW 2016. http://www.healthstats.nsw.gov.au/Indicator/dem_pop_atsi/dem_pop_atsi_lhn_snap?filter1ValueId=18403&LocationType=Local%20Health%20District&name=Aboriginal%20Health&code=atsi%20dqi (accessed Jan 2017).
- 10. Australian Bureau of Statistics. 1270.0.55.006. Australian Statistical Geography Standard (ASGS): correspondences, July 2011. June 2012. http://www.abs.gov.au/AUSSTATS/abs@.nsf/Lookup/1270.0.55.006Main+Features1July%202011?OpenDocument (accessed June 2015).
- 11. Clinical and Laboratory Standards Institute. Analysis and presentation of cumulative antimicrobial susceptibility test data: approved guideline (CLSI document M39-A4). 4th edition. Wayne (PA): CLSI, 2014.
- 12. Grayson ML, Russo PL, Cruickshank M, et al. Outcomes from the first 2 years of the Australian National Hand Hygiene Initiative. Med J Aust 2011; 195: 615-619. <MJA full text>
- 13. Lawes T, Lopez-Lozano JM, Nebot CA, et al. Effects of national antibiotic stewardship and infection control strategies on hospital-associated and community-associated meticillin-resistant Staphylococcus aureus infections across a region of Scotland: a non-linear time-series study. Lancet Infect Dis 2015; 15: 1438-1449.
- 14. World Health Organization. Antimicrobial resistance global report on surveillance. Geneva: WHO, 2014. http://www.who.int/drugresistance/documents/surveillancereport/en/ (accessed Mar 2017).
- 15. Australian Government Department of Health, Department of Agriculture. Responding to the threat of antimicrobial resistance. Australia’s first national antimicrobial resistance strategy 2015–2019. Canberra: Department of Health, Department of Agriculture, 2015. http://www.health.gov.au/internet/main/publishing.nsf/Content/1803C433C71415CACA257C8400121B1F/$File/amr-strategy-2015-2019.pdf (accessed Mar 2017).
- 16. Duguid M, Cruickshank M (editors). Antimicrobial stewardship in Australian hospitals. Sydney: Australian Commission on Safety and Quality in Health Care, 2011. https://www.safetyandquality.gov.au/wp-content/uploads/2011/01/Antimicrobial-stewardship-in-Australian-Hospitals-2011.pdf (accessed Mar 2017).
- 17. Turnidge J, Baggoley C, Schipp M, Martin R. Resistance sans frontières: containing antimicrobial resistance nationally and globally. Med J Aust 2016; 204: 207-208. <MJA full text>
- 18. Munckhof WJ, Nimmo GR, Carney J, et al. Methicillin-susceptible, non-multiresistant methicillin-resistant and multiresistant methicillin-resistant Staphylococcus aureus infections: a clinical, epidemiological and microbiological comparative study. Eur J Clin Microbiol Infect Dis 2008; 27: 355-364.
- 19. Jeremiah CJ, Kandiah JP, Spelman DW, et al. Differing epidemiology of two major healthcare-associated meticillin-resistant Staphylococcus aureus clones. J Hosp Infect 2016; 92: 183-190.
- 20. Antibiotic Reference Group. Therapeutic guidelines: antibiotic, version 15. Melbourne: Therapeutic Guidelines Limited, 2014. https://tgldcdp.tg.org.au/guideLine?guidelinePage=Antibiotic&frompage=etgcomplete (accessed Mar 2017).
- 21. Bowen AC, Tong SY, Andrews RM, et al. Short-course oral co-trimoxazole versus intramuscular benzathine benzylpenicillin for impetigo in a highly endemic region: an open-label, randomised, controlled, non-inferiority trial. Lancet 2014; 384: 2132-2140.
Abstract
Objectives: To identify groups at risk of methicillin-resistant Staphylococcus aureus (MRSA) infection, patterns of antimicrobial resistance, and the proportion of patients with MRSA infections but no history of recent hospitalisation.
Design, setting and participants: Case series of 39 231 patients with S. aureus isolates from specimens processed by the Hunter New England Local Health District (HNELHD) public pathology provider during 2008–2014.
Main outcome measures: Proportion of MRSA infections among people with S. aureus isolates; antimicrobial susceptibility of MRSA isolates; origin of MRSA infections (community- or health care-associated); demographic factors associated with community-associated MRSA infections.
Results: There were 71 736 S. aureus-positive specimens during the study period and MRSA was isolated from 19.3% of first positive specimens. Most patients (56.9%) from whom MRSA was isolated had not been admitted to a public hospital in the past year. Multiple regression identified that patients with community-associated MRSA were more likely to be younger (under 40), Indigenous Australians (odds ratio [OR], 2.6; 95% CI, 2.3–2.8), or a resident of an aged care facility (OR, 4.7; 95% CI, 3.8–5.8). The proportion of MRSA isolates that included the dominant multi-resistant strain (AUS-2/3-like) declined from 29.6% to 3.4% during the study period (P < 0.001), as did the rates of hospital origin MRSA in two of the major hospitals in the region.
Conclusions: The prevalence of MRSA in the HNELHD region decreased during the study period, and was predominantly acquired in the community, particularly by young people, Indigenous Australians, and residents of aged care facilities. While the dominance of the multi-resistant strain decreased, new strategies for controlling infections in the community are needed to reduce the prevalence of non-multi-resistant strains.