




Medical education
Key research skills
Volume 207 - Issue 5
Statistical and clinical significance
Author: Ian A Scott
Med J Aust 2017; 207 (5): 187-189. || doi: 10.5694/mja16.01148
Published online: 4 September 2017
Published online: 4 September 2017
In published research, a statistically significant result is often wrongly interpreted as representing a clinically important finding
In published research, a statistically significant result is often wrongly interpreted as representing a clinically important finding. In this article, we explore the meanings of statistical and clinical significance.
Statistical significance
Hypothesis testing has been discussed previously in this series1 and is briefly revisited here. Statistical hypothesis testing starts by assuming no difference in an outcome of interest between two patient groups, one exposed to a study factor (often a treatment) and the other not. This is the null hypothesis. The chosen statistical test assesses if the observed results are consistent with a real difference rather than the simple play of chance. What is the largest probability of chance being the explanation of the observed difference we are willing to accept? Or what is the highest acceptable false-positive rate of seeing a supposedly real difference which, in truth, does not exist? Conventionally, we accept up to a 5% probability of a false-positive result, denoted by a P value of 0.05. The lower the P value below 0.05, the lower the probability that the observed difference (or even a larger difference) is due solely to chance, and the higher the level of statistical significance. Thus, a P value below 0.001 has a higher level of significance than a P value of 0.03.
Achieving a P value below 0.05 (a positive result) is often assumed to mean that the null hypothesis of no difference between groups has been disproved, and that any P value above 0.05 represents a negative result. Both assumptions are incorrect. As discussed previously,1 the P value should be seen as a continuum whereby the lower the value, the lower the likelihood that the observed difference is due to chance, and the greater our confidence in rejecting the null hypothesis. It does not necessarily mean the null hypothesis is false or that the alternative hypothesis is true. Small trials with inherent sampling error or studies undertaking multiple between-group comparisons can yield a positive (P < 0.05) result simply by chance (type 1 error; Box 1).
Conversely, the higher the P value, the more likely that the observed difference is due to chance, which means less evidence sufficient to reject the null hypothesis; it does not mean the null hypothesis is true or that the alternative hypothesis is false. Studies that have an insufficient number of outcome events to demonstrate what researchers have hypothesised a priori as being a minimally worthwhile treatment benefit may yield a negative (P > 0.05) result, even if the benefit truly exists (type 2 error; Box 1). Such underpowered studies due to an inadequate sample size should not be interpreted as negative but as inconclusive.
Type 1 errors are prevented by avoiding small samples, minimising the number of comparisons, and statistically correcting for multiple comparisons (by mandating lower P values [ie, higher levels of significance] for each comparison). Type 2 errors are prevented by calculating, before the trial starts, the minimum number of patients required to confer an acceptable probability (or power, set conventionally at 80%) of demonstrating the pre-specified treatment effect if it truly exists. Arguably, from an ethical viewpoint, small or underpowered trials which expose subjects to potential harms of experimental treatments with limited prospects for generating a definitive result should be avoided as much as possible.2
There may be situations which warrant the probability of a false-positive result to be considerably less than 5% (eg, P < 0.01), such as evaluating the effects of a potentially toxic or very expensive treatment. Conversely, a probability above 5% (eg, P = 0.1) may be justified when evaluating an easy to administer treatment for a lethal and rapidly progressive disease. Importantly, the P value chosen gives no indication of the actual magnitude or direction of the difference between groups or of the clinical significance of such a difference.
Clinical significance
Regardless of the level of statistical significance, is the observed difference between groups clinically meaningful and relevant to changing practice? The final arbiter may be the level of significance as determined by the patient, as researchers and patients may hold very different views on what is considered important.3 Statistical significance is used to inform clinical significance but they are not interchangeable terms, where one can be inferred from the other. For example, a trial may report a treatment effect as a relative risk (RR) or odds ratio (OR) of 0.90, a relative risk reduction (RRR) of 10% or an absolute risk difference (RD) of 0.5%. These small and most likely clinically inconsequential benefits may nonetheless be highly statistically significant (P < 0.001) in a large trial. In another scenario, the minimum treatment effect predetermined by the researchers might fail to reach statistical significance, but the observed effect may still be regarded by some as being clinically worthwhile.
Assessing clinical significance requires us to consider the magnitude (or size) of the difference between groups (what is termed the point estimate of the effect size) and its associated confidence interval (CI). The CI basically represents the range of values of the between-group difference that would be generated if the same trial was to be repeated many times, and which contains the true difference (Box 2).4 By convention, a 95% CI is chosen in accordance with the 5% false-positive rate of statistical significance. The lower boundary of the CI defines the smallest difference which, if true, may be of little clinical importance, while the upper boundary defines the largest difference which, if true, may be of considerable clinical importance. In contrast to the P value, the 95% CI permits evaluation of the clinical significance of different estimates of treatment effects while quantifying the degree of statistical uncertainty, or imprecision, surrounding the point estimate.5 If the 95% CI does not contain a null value (ie, RR or OR = 1, RRR = 0 or RD = 0), the null hypothesis of no difference is rejected and the P value falls below 0.05. The CIs will be wide or narrow depending on whether the number of events (usually correlated with sample size) is small or large respectively, reflecting greater or lesser degrees of imprecision around the true effect size.
Reconciling statistical and clinical significance
When reading a “positive” trial (P < 0.05) or “negative” trial (P > 0.05), we should ask questions that enable us to better discern the level of clinical relevance.6,7
Positive trials
A P value of 0.04 with a lower CI boundary almost touching the null does not provide conclusive evidence of a treatment effect. A single trial with this marginal level of statistical significance should not evoke major changes in clinical practice. In addition, small trials with small numbers of events can sometimes yield marked treatment effects (eg, RR = 0.4 or RRR = 60%) which can be statistically significant. Again caution is required if such effects seem too good to be true, especially if the trials have been stopped early for presumed benefit.8 In larger trials that run to completion, such effects are often markedly attenuated or disappear entirely. In contrast, a large trial may report an absolute risk reduction of 1% in clinical events which, while statistically highly significant (P < 0.001), may be too small to offset the costs, harms or burdens of the treatment. Most trials assess whether one treatment has significantly greater efficacy than (is superior to) another, or usual care, or placebo (superiority trials). On the other hand, non-inferiority trials involve comparing a novel treatment possessing appealing attributes (less toxicity, greater ease of administration, lower cost) with an existing standard treatment and determining whether the former is not that much worse than the latter in regard to the primary efficacy outcome. How much worse is defined by the non-inferiority margin, which quantifies the maximum allowable loss of efficacy. However, the non-inferiority margin chosen by researchers may be too liberal, yielding a statistically significant result for non-inferiority, at the expense of a loss in efficacy that we or our patients may deem unacceptable.9 Another situation requiring caution involves the use of surrogate outcomes, such as reductions in blood pressure or glycated haemoglobin, which, while associated with very low P values, may not translate into clinically meaningful outcomes such as reductions in cardiovascular events or mortality. In the case of statistically significant composite outcomes, one should note whether these are principally driven by a single endpoint reflecting clinician decisions (such as to ventilate or revascularise) rather than disease-related clinical events. In other trials, a positive efficacy outcome may be counterbalanced by serious harms that are often under-reported.10 Finally, defects in trial design such as missing data, absence of blinding, or patients lost to follow-up may invalidate what seems otherwise to be a strongly positive trial.
Negative trials
For a trial reporting a P value just above 0.05, first consider whether the trial was underpowered for the primary outcome. If signals of benefit consistently exist for various secondary outcomes, dismissing the trial as negative may be unwarranted. In both cases, if the point estimate and specifically the upper CI boundary suggest a worthwhile clinical benefit, then further study is justified. Negative results may also arise because the chosen outcome measures, the study population or the method of treatment administration were inappropriate based on presumed or known mechanism of action, current standards of care or the results of previous studies. Poor adherence to study protocols may also prevent recognition of an effective treatment when intention-to-treat (ITT) analyses are applied. As-treated and per-protocol analyses (Box 3)11 may help unmask potentially worthwhile treatment effects, but these need to be confirmed in further studies to rule out selection bias and confounding inherent to non-ITT analyses. Time to first event as the primary outcome may cause treatments to be under-rated by failing to ascertain reductions in repeat events over the entire study period.
Conclusion
Statistical significance relates to the probability that an observed difference between groups is related to chance, while clinical significance relates to whether this difference, even if statistically significant, is important to patient care.
Box 1 – Type 1 and type 2 errors
Type 1 (or alpha) error- A study reports a statistically significant (P < 0.05) difference between groups which, in reality, does not exist.
- This may lead you to reject the null hypothesis of no difference when in fact the null hypothesis is true.
- The probability of this false-positive result is determined by the chosen level of statistical significance (or alpha level), which conventionally is set at 0.05 (5%).
- A study reports no statistically significant (P > 0.05) difference between groups when, in reality, a difference does exist.
- This may lead you to accept the null hypothesis of no difference when in fact the null hypothesis is false.
- The probability of this false-negative result is determined by the interplay between the magnitude of difference that the investigators were hoping to see, the number of events that occurred (which relates to the sample size or number of subjects in the trial), the expected drop-out rate and loss to follow-up, and the alpha level of statistical significance. By convention, the probability of a false-negative result (beta level) is set at 0.2 (20%), with study power (1 - beta) set at 0.8 (80%).
Box 2 – Five scenarios for the primary endpoint of a randomised trial comparing new and standard treatment groups
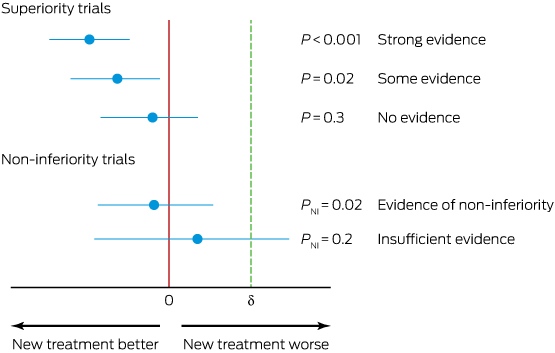
Adapted with permission from Pocock and Ware.4 Each scenario shows the estimated treatment difference and its 95% CI P value, and strength of evidence for either superiority (ie, new treatment is better than standard treatment) or non-inferiority (new treatment is non-inferior to standard treatment) depending on where the 95% CI is positioned relative to the no-difference (or null) position (0). For non-inferiority trials, the non-inferiority (NI) margin (d) is shown, and the PNI value for consequent test of non-inferiority. Researchers often choose their NI margin using statistical methods that centre on preserving at least 50% of the minimal treatment effect seen in randomised trials comparing standard treatment with placebo (see and Mulla et al9). However, what matters is whether you or your patient considers the chosen NI margin to be too liberal (ie, it allows more loss of standard treatment efficacy than you are both prepared to accept).
Box 3 – Different types of analysis of effect
Intention to treat
Patient outcomes are analysed according to the treatment group to which they were assigned at the start of the trial (ie, according to the treatment that was intended, regardless of what treatment they actually received).
Per protocol
Patient outcomes are analysed and compared between treatment groups among the patients who fully adhered to study protocol (ie, received the treatment as prescribed for the group to which they were assigned). Per-protocol analyses are prone to selection bias as they are a subset, based on adherence, of the entire trial population.
As treated
Patient outcomes are analysed according to the treatment that they actually received, regardless of their original group assignment or whether they fully adhered to study protocol. As-treated analyses are subject to bias (due to confounding) if patients received a particular treatment because of factors that are also associated with outcomes (prognostic factors).
Competing interests
No relevant disclosures.
References
- Jones MP, Beath A, Oldmeadow C, Attia JR. Understanding statistical hypothesis tests and power. Med J Aust 2017; 207: 148-150.
- Akobeng AK. Understanding type I and type II errors, statistical power and sample size. Acta Paediatr 2016; 105: 605-609.
- Furukawa TA, Scott IA, Guyatt G. Chapter 12.5: Measuring patients’ experience. In: Guyatt G, Rennie D, Meade MO, Cook DJ, editors. Users’ guides to the medical literature. A manual for evidence-based practice. 3rd ed. Boston: JAMA Press, 2015: pp. 219-234.
- Pocock SJ, Ware JH. Translating statistical findings into plain English. Lancet 2009; 373: 1926-1928.
- Gardner MJ, Altman DG. Confidence intervals rather than P values: estimation rather than hypothesis testing. BMJ 1986; 292: 746-750.
- Pocock SJ, Stone GW. The primary outcome is positive – is that good enough? N Engl J Med 2016; 375: 971-979.
- Pocock J, Stone GW. The primary outcome fails – what next? N Engl J Med 2016; 375: 861-870.
- Montori VM, Devereaux PJ, Adhikari NK, et al. Randomized trials stopped early for benefit: a systematic review. JAMA 2005; 294: 2203-2209.
- Mulla SM, Scott IA, Jackevicius CA, et al. User’s guide to the medical literature. How to use a non-inferiority trial. JAMA 2012; 308: 2605-2611.
- Seruga B, Templeton AJ, Badillo FE, et al. Under-reporting of harm in clinical trials. Lancet Oncol 2016; 17: e209-e219.
- Liao JM, Stack CB, Griswold ME, Localio AR. Understanding clinical research: intention to treat analysis. Ann Intern Med 2017; 166: 662-664.
Provenance: Commissioned; externally peer reviewed.
Driving Implementation-Focused Change for Gender Equity in Medical Leadership: A Consensus-Based Priority-Setting Approach
Belinda Garth, Jenny Proimos, Thuy Vy Nguyen, Sally Cross, Sarah Whitelaw, Helena J. Teede
Advancing Gender Equality in Australian Healthcare Leadership: Why National Targets Matter and What It Means for Healthcare Employers
Belinda Garth, Nicole Pope, Jenny Proimos, Helena J. Teede
Centring Aboriginal and Torres Strait Islander Voices: A Framework for Culturally Safe and Racism-Free Healthcare
Elissa Elvidge, Roianne West, Karen Nicholls, Kiara Harvey, Yeena Thompson, Geraint B. Rogers, Yin Paradies
Medical Colleges Have an Obligation to Ensure Full Participation in Clinical Quality Registries
Robert J. Aitken, Julian A. Smith, Guy J. Maddern