


The prevalence, morbidity and early and late mortality associated with an acute coronary event all remain substantial in Australia and New Zealand.1 In Australia, ensuring equitable provision of acute cardiac care is a difficult task because of geographic challenges, shared federal and state jurisdictional responsibility for health care, and increasingly complex patient populations.2
Randomised trial data suggest that percutaneous reperfusion for ST elevation myocardial infarction (STEMI) and routine invasive strategies for revascularisation improve outcomes in patients with acute coronary syndromes (ACS), and this has led to public health initiatives that promote access to catheterisation laboratories.3 Patients presenting to hospitals with catheterisation laboratories are more likely to undergo these procedures than those who do not.4-6 The availability of angiography facilities may be associated with an improvement in mortality,7-9 although some studies have found no difference.5,10-12 It is not clear whether the lower mortality reported by some hospitals is related to access to angiography, better application of evidence-based care, or combinations of these factors.4,5,8
In October 2014, health ministers in Australia endorsed a National Clinical Care Standard for Acute Coronary Syndromes,13 and the Ministry of Health in New Zealand has developed a quality improvement plan that includes recommendations for ACS management.14 The lack of a comprehensive national surveillance system that is focused on collecting clinical data limits both the capacity to audit compliance with these initiatives and to determine whether adoption of their recommendations achieves improved outcomes for ACS patients. In this context, SNAPSHOT ACS has emerged as an important performance measure of acute cardiac care in the two countries, informed by two earlier audits undertaken in New Zealand in 2002 and 2007.15,16 Conducted over a 2-week period in May 2012,17 the comprehensive SNAPSHOT registry collected descriptive clinical data, audited processes of care, and outcomes for 4387 patients who presented with suspected ACS to the participating hospitals; more than 90% of the hospitals across Australia and New Zealand that treat ACS patients were audited.
In this article, we describe the delivery of evidence-based care13 to patients who initially presented to either a catheterisation-capable (CC) or a non-CC hospital setting. Using binational data linkage, we also report the 18-month mortality data for all patients and explore the relationship between variations in the delivery of evidence-based care and long-term mortality.
Methods
The SNAPSHOT ACS study was a prospective audit of the care provided to consecutive patients with suspected ACS who were admitted to hospital during a 2-week period in May 2012. Details of the study have been published elsewhere.17 In brief: 478 of 525 Australian and New Zealand hospitals that treat ACS patients either obtained ethics approval (in most cases allowing an opt-out consent process) or, in the case of New Zealand, a waiver for consent for the collection of ACS patient data. Some 286 hospitals (including all 39 New Zealand hospitals that treat ACS patients) received and enrolled consecutive patients during the audit period. Eligible hospitals that did not enrol patients were smaller centres that did not treat patients with suspected ACS during the audit window.
In addition, 438 hospitals completed a survey describing local resources, including cardiac investigation and management capabilities. For the 40 hospitals that did not participate in this site survey, publicly available information, such as the presence of a catheterisation laboratory at the time of the audit, was obtained from the hospital website or by contacting the hospital directly.
An electronic case report form was used to collect comprehensive historical and clinical data on patients, including provision of invasive management, medications, and in-hospital outcomes. Linkages with the National Death Index (NDI) in Australia and the National Mortality Register (NMR) in New Zealand were performed to obtain the vital status of all enrolled patients 18 months after admission. In Australia, probabilistic matching techniques used the name, date of birth, sex and address of the patient to link clinical data and date of death. In New Zealand, the unique patient identifier was used to link to the NMR.
Patients were stratified into two groups according to whether the hospital to which they presented had a catheterisation laboratory on site.
Statistical analyses
Standard descriptive statistics for demographic and clinical characteristic of the patients, pathology investigations, invasive procedures, guideline-recommended therapies provided to patients who survived to hospital discharge, and in-hospital events are presented. Dichotomous variables are reported as numbers and percentages, and were compared using χ2 tests. Continuous variables are reported as medians and interquartile ranges, and compared using Kruskal–Wallis tests.
Kaplan–Meier survival curves are used to contrast ACS patients who presented to CC and non-CC hospitals, and were compared using log-rank tests.
A propensity score was calculated for all patients to model the likelihood of presenting to a CC hospital, and a Cox proportional hazards model, clustered by hospital, evaluated the impact on mortality of presenting to a CC hospital, after adjusting for Global Registry of Acute Coronary Events (GRACE) risk score,18 diagnosis, and propensity score. The comparison of presentation to CC and non-CC sites was then confined to the cohort of patients with overlapping propensity scores. Clinical factors included in the propensity score were: age, sex, GRACE score, elevated troponin levels, history of hypertension, diabetes, previous myocardial infarct, previous revascularisation, private health insurance, English as the primary home language, requiring assistance with activities of daily living, and being a nursing home resident.
In addition, a separate mortality model was developed for patients with an ACS (STEMI, non-ST elevation myocardial infarction [NSTEMI], unstable angina with probable ischaemic chest pain); this included the factors listed above, as well as two process measures derived from the indicators described in the Australian ACS Clinical Care Standard:13 timely delivery of reperfusion for STEMI, and coronary angiography for intermediate- or high-risk ACS.
A final propensity score-adjusted mortality model was constructed to predict postdischarge mortality, and included the previously discussed variables, together with delivery of dual antiplatelet and lipid-lowering treatment and referral to rehabilitation, measures also derived from the ACS Clinical Care Standard (Box 1).
To quantify the impact of health service improvement strategies, the attributable number of deaths hypothetically averted by application of each of the aspects of care included in the model described above was estimated using the formula:
attributable number = numberwithout Rx × (death incidencewithout Rx − death incidencewith Rx),
where Rx is the treatment factor of interest. The hazard rate (of death at 12 months) for those “with treatment” was estimated for patients who had arrived at the hospital in a timely manner and received all components of recommended care. The hazard rates for patients deficient in a specific care component were then calculated by applying the estimated hazard ratio associated with the omission of that care, derived from a Cox proportional hazards model confined to ACS patients that incorporated the primary diagnosis, the GRACE risk score, the on-site availability of catheterisation laboratory services, the propensity score for presentation to a CC facility, and the four processes of care (timely delivery of reperfusion for STEMI, coronary angiography for intermediate- and high-risk ACS, prescription of lipid-lowering and dual antiplatelet therapy, and referral to rehabilitation). Estimates of the proportions of patients for whom each component of care had been omitted were derived directly from the audit data. These estimates were then applied to a hypothetical population of 10 000 ACS patients with differing degrees of service improvement.
All analyses were conducted using Stata 13.1 (StataCorp); statistical significance was defined as P < 0.05.
Results
A total of 4387 patients with suspected ACS were enrolled, of whom 2459 (56%) presented to CC hospitals. The mean age, sex distribution and GRACE risk scores for the two patient groups were comparable. CC hospitals received a higher proportion of patients with private health insurance, a marker of socioeconomic status known to affect mortality (Box 2). This variable is included in the propensity score, so that our models are adjusted for this potentially confounding factor. In 2365 patients (53.9%), the ACS diagnosis was confirmed (Box 2).
Differences in care associated with availability of a catheterisation laboratory
The proportions of patients with STEMI who received reperfusion was less than optimal in both CC and non-CC hospitals (65.6% and 60.3%, respectively; P = 0.273). Timely reperfusion (door-to-balloon time under 90 minutes, or door-to-needle time under 30 minutes) was more likely for patients presenting to CC facilities (45.2% v 19.4%; P < 0.001) (Box 3).
ACS patients who presented to a CC hospital were more likely to undergo coronary angiography, which was offered earlier during their hospital stay. They were more likely to undergo revascularisation in hospital, and hospital survivors more likely to be referred to a rehabilitation service. There was no difference between the rates of prescribing evidence-based medications for hospital survivors discharged from CC or non-CC hospitals (Box 3).
Mortality in the 18 months after presenting with an ACS
The mortality in the overall SNAPSHOT cohort, from hospital presentation to 18-month follow-up, was 10.5% (460 deaths), and 12.6% (296 deaths) in patients with a confirmed ACS. Mortality was highest for patients with a myocardial infarction (STEMI: 68 deaths, 16.2%; NSTEMI: 165 deaths, 16.3%), followed by that for patients with a non-ACS diagnosis (107 deaths, 12.8%). Mortality was lowest for patients with unstable angina and non-ischaemic chest pain (63 deaths, 6.8%; and 57 deaths, 4.8%, respectively; P < 0.0001 for trend). Presentation to a CC hospital was associated with non-significantly reduced overall mortality for ACS patients (Box 4). Survival analysis indicated, however, that presentation to a CC hospital was associated with a significant reduction in mortality (P = 0.018), driven by separation in the mortality curves during the early postdischarge period (Box 5).
In a multivariable model that included adjustments for the propensity score for presenting to a CC hospital, GRACE risk score and patient diagnosis, presentation to a CC hospital was associated with significantly lower mortality (21%; 95% CI, 2%–37%) (Box 6).
Adding delivery of timely reperfusion for STEMI and coronary angiography for intermediate- and high-risk ACS patients to the model eliminated the independent association between presentation to a CC site and mortality. In this model, failure to provide appropriate coronary angiography was associated with a doubling of mortality (relative risk, 1.99; 95% CI, 1.42–2.79) (Box 7).
To quantify the effect on long-term outcomes of care initiated at discharge, an additional multivariable mortality model was developed for ACS patients who survived to hospital discharge. This model was confined to those in the CC and non-CC sites with overlapping propensity scores; this included 1870 patients, of whom 197 (10.5%) had died by the 18-month follow-up. Independent predictors of mortality in this population included GRACE risk score, presentation to a non-CC hospital, not receiving appropriate coronary angiography, and not being enrolled in a rehabilitation program (Box 7).
Modelling the impact of improving evidence-based care on annualised mortality
During the follow-up period, 296 of 2356 definite ACS patients had died, equivalent to an annualised mortality of 853 deaths (95% CI, 760–956) per 10 000 presentations. The estimated mortality rate at 12 months for patients in our dataset who had received all components of care was 185 deaths per 10 000 presentations. Box 8 includes estimates of the numbers of deaths within 12 months that could be averted by closing current treatment gaps for definite ACS patients, with various degrees of success, stratified by CC and non-CC facilities. If evidence-based care was improved to 50%, 70% or even 90% of optimal levels in ACS patients, we estimate that the numbers of lives saved annually in Australia and New Zealand per 10 000 ACS presentations would be 95, 133 and 171 patients, respectively. This corresponds to respective reductions in annualised mortality attributable to ACS of about 11%, 16% and 20%.
Discussion
In this comprehensive analysis of all patients with suspected ACS treated in most hospitals in Australia and New Zealand during a 2-week period in May 2012, overall mortality during the 18 months after presentation was 10.5%. The death rate was highest among patients with STEMI (16.2%) and NSTEMI (16.3%), reflecting both the substantial residual risk associated with these conditions and their comparable natural histories.20,21 The lower mortality observed in the unstable angina population contrasts with older data,22 but probably reflects the lower risk status of this population in the era of sensitive troponin assays.23
As most studies have found,4,5,10,24 ACS patients were more likely to have an angiogram if they presented to a CC hospital than to a non-CC hospital (61.5% v 50.8%). When compared with previous Australian and New Zealand reports, we have found that there has been a substantial improvement in the capacity to transfer patients from non-CC to CC hospitals in both countries over the past 10 years. The Heart Protection Project, which collected data from 27 Australian hospitals from 2003 to 2005,4 reported angiography rates of 66.4% and 20.1% for CC and non-CC hospitals respectively. Similarly, the first comprehensive New Zealand chest pain audit (2002) reported angiography rates of 30% in CC and 17% in non-CC hospitals.15 Despite the systematic improvement in access to coronary angiography we have reported, the long-term mortality for patients presenting to CC hospitals, after adjusting for their characteristics, was about 20% lower than for those who initially presented to non-CC hospitals. This finding conflicts with reports in the international literature that health systems that deliver high overall rates of coronary procedures (such as ours) are not associated with significant differences in long-term mortality,10,11 in contrast to health care systems in which invasive coronary procedure rates in non-CC sites are low (under 40%).7,9
Recent studies have highlighted the fact that attributing better outcomes in CC hospitals to invasive investigation alone may be simplistic, and suggest that a range of further structural and procedural features of hospital performance contribute to outcomes.5,8 Our study recognised this, and is the first to specifically examine the predictive value of performance indicators that have since become nationally endorsed as supplementing the ACS Clinical Care Standard in Australia.13 Interestingly, we found that one indicator described in the standard, the prescription of antiplatelet and lipid-lowering therapy, was not predictive of improved outcomes. This illustrates the obligatorily iterative nature of quality improvement initiatives, and underscores the value of clinical registries in informing these endeavours.25
SNAPSHOT ACS suffers from the potential limitations of all cross-sectional cohort studies in that, despite comprehensive risk adjustment, some of the benefits we attribute to evidence-based care may have been influenced by unmeasured confounding factors. In addition, data collection relied primarily on clinical staff in individual hospitals, in most cases after a single training session; monitoring of data quality was limited, and there was no independent adjudication of reported in-hospital clinical events. Finally, we had no information on the contribution of posthospital management to long-term mortality.
Our analysis nevertheless permits informed recommendations for guiding the setting of priorities for strategies for achieving lower long-term mortality in patients with ACS. Rates of angiography at CC hospitals, transfer rates from non-CC hospitals and access to rehabilitation in all hospitals should be further improved, and this will be facilitated by binational initiatives in health redesign, quality improvement and increased diffusion of evidence.2 One such initiative is ambulance diversion to percutaneous coronary intervention-capable hospitals after electrocardiography has been performed; this reduces reperfusion times and improves outcomes.26 We did not collect information on ambulance diversion rates in SNAPSHOT ACS, so can only speculate about the effect of diversion on non-CC performance. However, while providing timely reperfusion for STEMI patients is important, the relatively small proportion of STEMI presentations (18% of the ACS cohort) means that the greatest impact on mortality is achieved by improving care for the broader ACS population. If providing appropriate coronary angiography and rehabilitation to patients presenting with a definite ACS can each be improved to 50%, 70%, or, optimistically, 90% of ideal levels, we can anticipate reductions in the annualised mortality attributable to ACS across Australia and New Zealand of about 11%, 16% and 20%.
Box 1 – Performance measures and the Australian Acute Coronary Syndromes (ACS) Clinical Care Standard13
Performance measure |
Relevant ACS clinical care standard |
||||||||||||||
|
3. A patient with an acute ST-segment-elevation myocardial infarction (STEMI), for whom emergency reperfusion is clinically appropriate, is offered timely percutaneous coronary intervention (PCI) or fibrinolysis in accordance with the time frames recommended in the current National Heart Foundation of Australia/Cardiac Society of Australia and New Zealand Guidelines for the management of acute coronary syndromes.19 |
||||||||||||||
|
5. The role of coronary angiography, with a view to timely and appropriate coronary revascularisation, is discussed with a patient with a non-ST-segment-elevation acute coronary syndrome (NSTEACS) who is assessed to be at intermediate or high risk of an adverse cardiac event. |
||||||||||||||
|
6. Before a patient with an acute coronary syndrome leaves the hospital, they are involved in the development of an individualised care plan. This plan identifies the lifestyle modifications and medicines needed to manage their risk factors, addresses their psychosocial needs and includes a referral to an appropriate cardiac rehabilitation or another secondary prevention program. |
||||||||||||||
Box 2 – Patient demographics and clinical characteristics
Catheterisation-capable hospitals |
Not catheterisation-capable hospitals |
P |
|||||||||||||
Number of patients |
2459 |
1928 |
|||||||||||||
Sex (male) |
1473 (59.9%) |
1147 (59.5%) |
0.78 |
||||||||||||
Age, years (mean ± SD) |
66.7 ± 14.5 |
66.4 ± 14.7 |
0.54 |
||||||||||||
Diagnosis |
|||||||||||||||
STEMI |
235 (9.6%) |
184 (9.5%) |
0.96 |
||||||||||||
STEMI, presenting to hospital within 12 hours of initial symptoms∗ |
193 (83.9% of STEMI patients) |
148 (84.1% of STEMI patients) |
0.96 |
||||||||||||
NSTEMI |
567 (23.1%) |
445 (23.1%) |
|||||||||||||
Unstable angina/chest pain |
521 (21.2%) |
404 (21.0%) |
|||||||||||||
Non-cardiac chest pain |
676 (27.5%) |
518 (26.9%) |
|||||||||||||
Other |
460 (18.7%) |
377 (19.6%) |
|||||||||||||
Killip class |
|||||||||||||||
I |
2114 (86.0%) |
1674 (86.8%) |
|||||||||||||
II |
278 (11.3%) |
203 (10.5%) |
|||||||||||||
III |
46 (1.9%) |
36 (1.9%) |
|||||||||||||
IV |
21 (0.85%) |
15 (0.78%) |
0.86 |
||||||||||||
Creatinine, μM (mean ± SD) |
98.6 ± 73.4 |
99.5 ± 89.0 |
0.36 |
||||||||||||
Glomerular filtration rate, mL/min/1.73 m2 (mean ± SD) |
76.9 ± 43.8 |
77.6 ± 33.3 |
0.39 |
||||||||||||
Chronic kidney disease |
292 (11.9%) |
210 (10.9%) |
0.31 |
||||||||||||
Diabetes |
627 (25.5%) |
486 (25.2%) |
0.83 |
||||||||||||
Hypertension |
1555 (63.2%) |
1222 (63.4%) |
0.92 |
||||||||||||
Hyperlipidaemia |
1377 (56.0%) |
1006 (52.2%) |
0.01 |
||||||||||||
Smoking |
|||||||||||||||
Current |
417 (16.9%) |
382 (19.8%) |
|||||||||||||
Past |
915 (37.2%) |
714 (37.0%) |
|||||||||||||
Never |
1127 (45.8%) |
832 (43.2%) |
0.04 |
||||||||||||
Previous myocardial infarction |
683 (27.8%) |
508 (26.4%) |
0.29 |
||||||||||||
Previous percutaneous coronary intervention |
499 (20.3%) |
390 (20.2%) |
0.96 |
||||||||||||
Previous coronary artery bypass grafting |
280 (11.4%) |
186 (9.7%) |
0.06 |
||||||||||||
Atrial fibrillation |
333 (13.5%) |
331 (17.2%) |
0.001 |
||||||||||||
Peripheral arterial disease |
144 (5.9%) |
123 (6.4%) |
0.47 |
||||||||||||
Previous transient ischaemic attack or stroke |
248 (10.1%) |
205 (10.6%) |
0.55 |
||||||||||||
Major bleeding |
65 (2.6%) |
42 (2.2%) |
0.32 |
||||||||||||
Cancer |
57 (2.3%) |
49 (2.5%) |
0.63 |
||||||||||||
Lung disease |
302 (12.3%) |
271 (14.1%) |
0.08 |
||||||||||||
Dementia |
84 (3.4%) |
64 (3.3%) |
0.86 |
||||||||||||
Impaired mobility |
131 (5.3%) |
114 (5.9%) |
0.40 |
||||||||||||
Nursing home |
60 (2.4%) |
56 (2.9%) |
0.34 |
||||||||||||
Private insurance |
657 (26.7%) |
437 (22.7%) |
0.002 |
||||||||||||
GRACE risk score (median, IQR) |
1473 (59.9%) |
1147 (59.5%) |
0.78 |
||||||||||||
STEMI = ST elevation myocardial infarction; NSTEMI = non-ST elevation myocardial infarction; GRACE = Global Registry of Acute Coronary Events; IQR = interquartile range. ∗Time to presentation was not known for 13 STEMI patients (five presenting to catheterisation-capable hospitals, eight to not catheterisation-capable hospitals). | |||||||||||||||
Box 3 – Hospital performance: treatments received by patients admitted with acute coronary syndromes (ACS)
Catheterisation-capable hospitals |
Not catheterisation-capable hospitals |
P |
|||||||||||||
Performance measures for STEMI | |||||||||||||||
Total number of patients |
235 |
184 |
|||||||||||||
Offered reperfusion |
134 (65.6%) |
111 (60.3%) |
0.273 |
||||||||||||
Door-to-balloon time for primary percutaneous coronary intervention, min (median, IQR) |
70 (48–92)[n = 125] |
143 (115–194)[n = 33] |
0.0001 |
||||||||||||
Door-to-needle time for thrombolysis, min (median, IQR) |
35 (7–61)[n = 24] |
39 (20–68)[n = 73] |
0.640 |
||||||||||||
Timely reperfusion∗ |
106 (45.2%) |
35 (19.2%) |
< 0.001 |
||||||||||||
Performance measures for all ACS | |||||||||||||||
Total number of patients |
1326 |
1031 |
|||||||||||||
Coronary angiography (ACS patients) |
816 (61.5%) |
523 (50.8%) |
0.0001 |
||||||||||||
Angiography < 48 h |
539 (40.7%) |
253 (24.5%) |
< 0.001 |
||||||||||||
Percutaneous coronary intervention (ACS patients) |
442 (33.3%) |
301 (29.3%) |
0.04 |
||||||||||||
Coronary artery bypass grafting (ACS patients) |
93 (7.0%) |
64 (6.2%) |
0.42 |
||||||||||||
ACS patients prescribed four or more evidence-based therapies† |
702 (52.8%) |
514 (50.0%) |
0.165 |
||||||||||||
Dual antiplatelet and lipid-lowering therapy |
725 (54.7%) |
532 (51.6%) |
0.131 |
||||||||||||
Referred for cardiac rehabilitation |
756 (57.0%) |
546 (53.0%) |
0.05 |
||||||||||||
STEMI = ST elevation myocardial infarction; IQR: interquartile range. ∗Defined as door-to-balloon time of less than 90 minutes for primary percutaneous coronary intervention or door-to-needle time of less than 30 minutes for fibrinolysis. †Includes dual antiplatelet and lipid-lowering therapies, angiotensin-converting enzyme inhibitor or angiotensin receptor antagonist, and beta blockers. | |||||||||||||||
Box 4 – Unadjusted mortality, from admission to 18 months after admission, for all patients and for acute coronary syndrome (ACS) patients, according to whether admitting hospital was catheterisation-capable
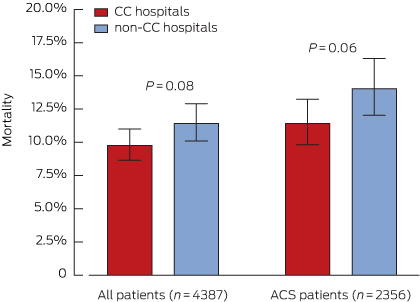
CC = catheterisation-capable.
Box 5 – Unadjusted Kaplan–Meier survival curves for acute coronary syndrome patients presenting to catheterisation-capable or non-capable hospitals
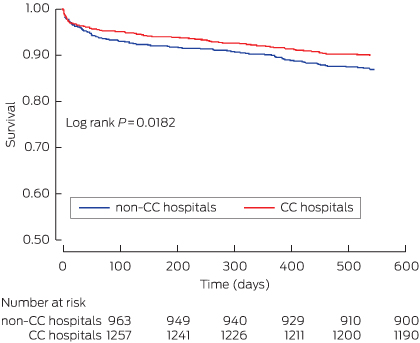
CC = catheterisation-capable.
Box 6 – Predictors of mortality, for all acute coronary syndrome patients
Variable |
Risk ratio (95% CI) |
P |
|||||||||||||
Catheterisation hospital (reference: non-catheterisation-capable hospital) |
0.79 (0.63–0.98) |
0.030 |
|||||||||||||
GRACE risk score, per point |
1.04 (1.03–1.04) |
< 0.0001 |
|||||||||||||
Diagnosis (reference: STEMI) |
|||||||||||||||
NSTEMI |
0.97 (0.70–1.36) |
0.89 |
|||||||||||||
Unstable angina |
0.93 (0.63–1.37) |
0.73 |
|||||||||||||
Chest pain, unlikely ischaemic |
0.84 (0.55–1.30) |
0.45 |
|||||||||||||
Other |
1.02 (0.71–1.46) |
0.91 |
|||||||||||||
Propensity score |
0.13 (0.01–2.15) |
0.08 |
|||||||||||||
GRACE = Global Registry of Acute Coronary Events; STEMI = ST elevation myocardial infarction; NSTEMI = non-ST elevation myocardial infarction. | |||||||||||||||
Box 7 – Predictors of mortality for acute coronary syndrome (ACS) patients, after adjustment for receiving evidence-based care
Variable |
All ACS patients (n = 1923) |
ACS survivors to discharge (n = 1870) |
|||||||||||||
Relative risk (95% CI) |
P |
Relative risk (95% CI) |
P |
||||||||||||
Catheterisation hospital (reference: non-catheterisation-capable hospital) |
0.78 (0.59–1.02) |
0.068 |
0.73 (0.54–0.99) |
0.043 |
|||||||||||
GRACE risk score, per point |
1.03 (1.03–04) |
< 0.0001 |
1.03 (1.03–1.04) |
< 0.0001 |
|||||||||||
Diagnosis (reference: STEMI) |
|||||||||||||||
NSTEMI |
1.64 (0.68–3.96) |
0.27 |
2.46 (0.75–8.14) |
0.14 |
|||||||||||
Unstable angina |
1.21 (0.47–3.14) |
0.70 |
2.0 (0.56–7.11) |
0.29 |
|||||||||||
Measures of appropriate care |
|||||||||||||||
Failure to receive timely reperfusion (STEMI) |
2.32 (0.94–5.69) |
0.066 |
2.56 (0.75–8.74) |
0.133 |
|||||||||||
Failure to undergo coronary angiography (GRACE risk score > 118) |
1.99 (1.42–2.79) |
< 0.001 |
1.67 (1.14–2.43) |
0.008 |
|||||||||||
Failure to discharge on statin and dual antiplatelet therapy |
1.21 (0.86–1.72) |
0.28 |
|||||||||||||
Failure to refer to rehabilitation |
1.51 (1.07–2.11) |
0.018 |
|||||||||||||
Propensity score |
0.57 (0.04–8.44) |
0.68 |
0.73 (0.04–12.08) |
0.824 |
|||||||||||
GRACE = Global Registry of Acute Coronary Events; STEMI = ST elevation myocardial infarction; NSTEMI = non-ST elevation myocardial infarction. | |||||||||||||||
Box 8 – Estimated number deaths per 10 000 acute coronary syndrome (ACS) presentations (with 95% CI) that could be averted in 12 months by service improvements that provide more complete application of guideline-based therapies and interventions
Improvement in providing care component: |
Catheterisation-capable hospitals (receive 56% of ACS patients) |
Not catheterisation-capable hospitals (receive 44% of ACS patients) |
|||||||||||||
50% |
70% |
90% |
50% |
70% |
90% |
||||||||||
Provide reperfusion within recommended timeframe (STEMI) |
6.6 (1.2–12.0) |
9.3 (1.8–16.8) |
11.9 (2.3–21.5) |
11.6 (−0.4 to 19.8) |
16.3 (−0.5 to 27.6) |
21.0 (−0.7 to 35.5) |
|||||||||
Provide angiography to intermediate- and high-risk patients (GRACE risk score > 118) |
26.6 (17.5–35.8) |
37.3 (24.5–50.1) |
47.9 (31.5–64.4) |
36.8 (10.0–50.1) |
51.5 (14.0–70.1) |
66.3 (18.0–90.2) |
|||||||||
Discharge patients on statin and dual antiplatelet therapy |
2.3 (0–4.7) |
3.3 (0–6.6) |
4.3 (0–8.5) |
6.2 (−1.7 to 10.5) |
9.3 (−2.5 to 14.7) |
11.9 (−3.2 to 18.9) |
|||||||||
Referral to rehabilitation |
11.3 (5.5–17.2) |
15.8 (7.6–24.0) |
20.3 (9.8–30.8) |
20.3 (0.2–29.8) |
28.5 (0.3–41.7) |
36.6 (0.4–53.6) |
|||||||||
STEMI = ST elevation myocardial infarction; GRACE = Global Registry of Acute Coronary Events. | |||||||||||||||
Received 26 April 2015, accepted 7 September 2015
- David B Brieger1
- Derek PB Chew2
- Julie Redfern3
- Chris Ellis4
- Tom G Briffa5
- Tegwen E Howell3
- Bernadette Aliprandi-Costa6
- Carolyn M Astley2
- Greg Gamble8
- Bridie Carr9
- Christopher JK Hammett10
- Neville Board11,12
- John K French12,13
- 1 Concord Repatriation General Hospital, Sydney, NSW
- 2 Flinders Medical Centre, Adelaide, SA
- 3 The George Institute for Global Health, University of Sydney, Sydney, NSW
- 4 Auckland City Hospital, Auckland, New Zealand
- 5 The University of Western Australia, Perth, WA
- 6 University of Sydney, Sydney, NSW
- 7 Flinders University, Adelaide, SA
- 8 University of Auckland, Auckland, New Zealand
- 9 Cardiac Network Agency for Clinical Innovation, Sydney, NSW
- 10 Royal Brisbane and Women's Hospital, Brisbane, QLD
- 11 Australian Commission on Safety and Quality in Health Care, Sydney, NSW
- 12 Liverpool Hospital, Sydney, NSW
- 13 University of New South Wales, Sydney, NSW
We acknowledge the contributions of all the SNAPSHOT investigators, listed in the online to this article.
David Brieger sits on the advisory boards of AstraZeneca Australia, Boehringer Ingelheim Australia, Bayer Australia, Pfizer, and BMS Australia; he has received research funding from AstraZeneca Australia, Sanofi Aventis Australia, Merck Schering Plough Australia, and Boehringer Ingelheim Australia; lecturing fees from AstraZeneca Australia and Bayer Australia; and travel assistance from Bayer Australia and Boehringer Ingelheim Australia. Derek P. Chew has received lecturing fees from AstraZeneca Australia and the educational program Heart.org. Tom Briffa has received a grant-in-aid and travel support from the Western Australia Department of Health. Tegwen Howell has received travel assistance from Heart Foundation Australia. Greg Gamble has received a grant from the Auckland Greenlane Fund. Chris Hammett is a consultant to Bayer Australia and Eli Lilly Australia, and has received lecturing fees from Boehringer Ingelheim and Eli Lilly Australia, and travel assistance from AstraZeneca Australia, Bayer Australia, Boehringer Ingelheim Australia, Eli Lilly Australia, Schering Plough Australia, and Abbott Medical Australia. John French sits on the advisory boards of Sanofi Aventis Australia, AstraZeneca Australia, Eli Lilly Australia and Boehringer Ingelheim Australia, and holds a grant-in-aid from The Medicines Company.
- 1. Australian Institute of Health and Welfare. Cardiovascular disease: Australian facts 2011. Canberra: AIHW, 2011. (AIHW Cat. No. CVD 53). http://www.aihw.gov.au/WorkArea/DownloadAsset.aspx?id=10737418530 (accessed Aug 2015).
- 2. Brieger DB, Redfern J. Contemporary themes in acute coronary syndrome management: from acute illness to secondary prevention. Med J Aust 2013; 199: 174-178. <MJA full text>
- 3. Peterson ED, Ohman EM, Brindis RG, et al. Development of systems of care for ST-elevation myocardial infarction patients: evaluation and outcomes. Circulation 2007; 116: e64-e67.
- 4. Walters DL, Aroney CN, Chew DP, et al. Variations in the application of cardiac care in Australia. Med J Aust 2008; 188: 218-223. <MJA full text>
- 5. Alter DA, Naylor CD, Austin PC, Tu JV. Long-term MI outcomes at hospitals with or without on-site revascularization. JAMA 2001; 285: 2101-2108.
- 6. Halabi AR, Beck CA, Eisenberg MJ, et al. Impact of on-site cardiac catheterization on resource utilization and fatal and non-fatal outcomes after acute myocardial infarction. BMC Health Serv Res 2006; 6: 148.
- 7. Wright SM, Daley J, Peterson ED, Thibault GE. Outcomes of acute myocardial infarction in the Department of Veterans Affairs: does regionalization of health care work? Med Care 1997; 35: 128-141.
- 8. Chen J, Krumholz HM, Wang Y, et al. Differences in patient survival after acute myocardial infarction by hospital capability of performing percutaneous coronary intervention: implications for regionalization. Arch Internal Med 2010; 170: 433-439.
- 9. Selby JV, Fireman BH, Lundstrom RJ, et al. Variation among hospitals in coronary-angiography practices and outcomes after myocardial infarction in a large health maintenance organization. N Engl J Med 1996; 335: 1888-1896.
- 10. Pilote L, Califf RM, Sapp S, et al. Regional variation across the United States in the management of acute myocardial infarction. N Engl J Med 1995; 333: 565-572.
- 11. Every NR, Parsons LS, Fihn SD, et al. Long-term outcome in acute myocardial infarction patients admitted to hospitals with and without on-site cardiac catheterization facilities. Circulation 1997; 96: 1770-1775.
- 12. Krumholz HM, Chen J, Murillo JE, et al. Admission to hospitals with on-site cardiac catheterization facilities: impact on long-term costs and outcomes. Circulation 1998; 98: 2010-2016.
- 13. Australian Commission on Safety and Quality in Health Care. Acute coronary syndromes clinical care standard. Sydney: ACSQHC, 2014. http://www.safetyandquality.gov.au/wp-content/uploads/2014/12/Acute-Coronary-Syndromes-Clinical-Care-Standard.pdf (accessed Aug 2015).
- 14. New Zealand Ministry of Health. Diabetes and cardiovascular disease quality improvement plan. Wellington: Ministry of Health, 2007. https://www.health.govt.nz/system/files/documents/publications/diabetes-cardio-quality-improvement-plan-feb08-v2.pdf (accessed Aug 2015).
- 15. Ellis C, Gamble G, French J, et al. Management of patients admitted with an acute coronary syndrome in New Zealand: results of a comprehensive nationwide audit. N Z Med J 2004; 117: 953.
- 16. Ellis C, Gamble G, Hamer A, et al. Patients admitted with an acute coronary syndrome (ACS) in New Zealand in 2007: results of a second comprehensive nationwide audit and a comparison with the first audit from 2002. N Z Med J 2010; 123: 25-43.
- 17. Chew DP, French J, Briffa TG, et al. Acute coronary syndrome care across Australia and New Zealand: the SNAPSHOT ACS study. Med J Aust 2013; 199: 185-191. <MJA full text>
- 18. Fox KAA, Dabbous OH, Goldberg RJ, et al. Prediction of risk of death and myocardial infarction in the six months after presentation with acute coronary syndrome: prospective multinational observational study (GRACE). BMJ 2006; 333: 1091.
- 19. Aroney CN, Aylward P, Kelly AM, et al. National Heart Foundation of Australia/Cardiac Society of Australia and New Zealand guidelines for the management of acute coronary syndromes 2006. Med J Aust 2006; 184 (8 Suppl): S1-S30. <MJA full text>
- 20. Fox KAA, Anderson FA, Goodman SG, et al. Time course of events in acute coronary syndromes: implications for clinical practice from the GRACE registry. Nat Clin Pract Cardiovasc Med 2008; 5: 580-589.
- 21. Armstrong PW, Fu Y, Chang WC, et al. Acute coronary syndromes in the GUSTO-IIb trial: prognostic insights and impact of recurrent ischemia. Circulation 1998; 98: 1860-1868.
- 22. Fox KAA, Carruthers KF, Dunbar DR, et al. Underestimated and under-recognized: the late consequences of acute coronary syndrome (GRACE UK-Belgian Study). Eur Heart J 2010; 31: 2755-2764.
- 23. Cullen L, French JK, Briffa TG, et al. Availability of highly sensitive troponin assays and acute coronary syndrome care: insights from the SNAPSHOT registry. Med J Aust 2015; 202: 36-39. <MJA full text>
- 24. Every NR, Larson EB, Litwin PE, et al. The association between on-site cardiac catheterization facilities and the use of coronary angiography after acute myocardial infarction. N Engl J Med 1993; 329: 546-551.
- 25. Brieger D, Aliprandi-Costa B. Developments in procedural and disease registries: a focus on coronary artery disease. Curr Opin Cardiol 2013; 28: 405-410.
- 26. Hutchison AW, Malaiapan Y, Jarvie I, et al. Prehospital 12-lead ECG to triage ST-elevation myocardial infarction and emergency department activation of the infarct team significantly improves door-to-balloon times: ambulance Victoria and MonashHEART Acute Myocardial Infarction (MonAMI) 12-lead ECG project. Circ Cardiovasc Interv 2009; 2: 528-534.
Abstract
Objectives: To assess the impact of the availability of a catheterisation laboratory and evidence-based care on the 18-month mortality rate in patients with suspected acute coronary syndromes (ACS).
Design, setting and participants: Management and outcomes are described for patients enrolled in the 2012 Australian and New Zealand SNAPSHOT ACS audit. Patients were stratified according to their presentation to hospitals with or without cardiac catheterisation facilities. Data linkage ascertained patient vital status 18 months after admission. Descriptive and Cox proportional hazards analyses determined predictors of outcomes, and were used to estimate the numbers of deaths that could be averted by improved application of evidence-based care.
Main outcome measures: Mortality for ACS patients from admission to 18 months after admission.
Results: Definite ACS patients presenting to catheterisation-capable (CC) hospitals (n = 1326) were more likely to undergo coronary angiography than those presenting to non-CC hospitals (n = 1031) (61.5% v 50.8%; P = 0.0001), receive timely reperfusion (for ST elevation myocardial infarction (STEMI) patients: 45.2% v 19.2%; P < 0.001), and be referred for cardiac rehabilitation (57% v 53%; P = 0.05). All-cause mortality over 18 months was highest for STEMI (16.2%) and non-STEMI (16.3%) patients, and lowest for those presenting with unstable angina (6.8%) and non-cardiac chest pain (4.8%; P < 0.0001 for trend). After adjustment for patient propensity to present to a CC hospital and patient risk, presentation to a CC hospital was associated with 21% (95% CI, 2%–37%) lower mortality than presentation to a non-CC hospital. This mortality difference was attenuated after adjusting for delivery of evidence-based care.
Conclusion: In Australia and New Zealand, the availability of a catheterisation laboratory appears to have a significant impact on long-term mortality in ACS patients, which is still substantial. This mortality may be reduced by improvements in evidence-based care in both CC and non-CC hospitals.